

In this post, we’ll look at how you can use OpenTelemetry to monitor your unit tests and send that data to Honeycomb to visualize. It’s important to note that you don’t need to adopt Honeycomb, or even OpenTelemetry, in your production application to get the benefit of tracing. This example uses OpenTelemetry purely in the test project and provides great insights into our customer’s code.
We’re going to use xUnit as the runner and framework for our tests. I’m sure that other frameworks will have similar concepts to these that you can use.
The repository for this example is here if you prefer to just look at the repo.
Why should we monitor our unit tests?
We add more tests to ensure that our application’s functionality isn’t changing over time. As we add these tests, or indeed change existing ones, we should be aware of the impact these are having on our CI/CD pipelines and ultimately our time to deliver the software.
xUnit monitoring
We can do a lot with xUnit outputs. Specifically, there is an XML output that will show you how long a test took to run. This can be really useful, and there are lots of CI/CD tools out there that can take that output and monitor each test over time.
What you can’t currently achieve with xUnit is showing how your application reacted to those tests—only the full test run times. That’s where we can use tracing in OpenTelemetry to provide more information, and even go a few levels deeper.
What can OpenTelemetry show?
We’re going to use tracing in this example to show how you can provide traces for your tests in an unobtrusive way.
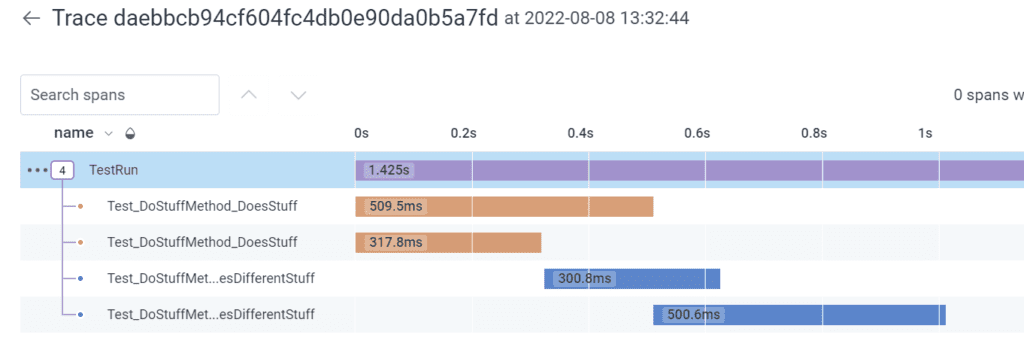
There are two options that we’ll show here. The first is treating a test “run” (the execution of your test library) as a single trace, and then each of your tests as a span in that trace. The second is treating each test as a trace in its own right. These approaches each have merit, and it’s up to you to work out which is the right approach. Personally, as I like my tests to also output the telemetry of the code it’s calling, I like to do a trace-per-test as it allows me to easily navigate and isolate the information I need.
.NET tracing is application-wide
This is a particular nuance with .NET that you won’t have to worry about in other languages. In .NET, tracing uses `ActivitySource`, and is then subsequently `ActivityListener`. These are both things that live across the whole AppDomain or Process. This isn’t normally an issue, as your application generally only runs once in your process. However, in unit tests, this is not the case.
Ultimately, that just means that we should only be monitoring the ActivitySource once per process. Luckily, xUnit has a few mechanisms we can use to ensure that we only do that once.
`IClassFixture` allows us to ensure reuse of a single instantiation of a class. This allows you to set up an OpenTelemetry `TracerProvider` and have its lifetime be for the single class it’s instantiated in. Although this is useful, most tests will cover multiple classes, and therefore we’ll end up with multiple tracers.
As of xUnit v2.4.2, there is no inbuilt mechanism to provide a lifetime of the tracer class per test run (or per process). There is, however, an extension in `xUnit.Extensions.AssemblyFixture`. This works the same way as the IClassFixture, but shares a lifetime at the process level for the assembly.
Note: xUnit v3 (which is currently in Alpha) offers this by default, and also other features that will make these sorts of things a lot easier.
Note 2: I have not tested IAssemblyFixture with multiple assemblies in a single test run. There may still be some multiple monitoring going on.
Let’s add the code
Step 1: Fixture setup
The first thing you need to do is create your OpenTelemetry Fixture that will include your `TracerProvider`. This is common whether you’re going for trace per test or per run.
Fixtures don’t need to implement anything special. As we’re going to want to flush our spans at the end of the process, we’ll need to add `IDisposable`.
This is a basic setup of a TracerProvider:
public class OpenTelemetryFixture : IDisposable
{
    private const string TracerName = "unit-test-with-otel";
    private readonly TracerProvider _tracerProvider;

    public OpenTelemetryFixture()
    {
        _tracerProvider = Sdk.CreateTracerProviderBuilder()
            .SetResourceBuilder(ResourceBuilder.CreateDefault().AddService(TracerName))
            .AddSource(TracerName)
            .Build();
    }

    public void Dispose()
    {
        _tracerProvider?.Dispose();
    }
}
Note: This is where you would add in any Custom ActivitySource names you’d like to monitor as part of the trace. This is important if you’re thinking of using the “trace per test” option further in the article as it will include them in the trace waterfall.
Step 2: Add Honeycomb exporter
We’ve set up a `TraceProvider` and given it a Service Name, and monitored a tracer with the same name. This does nothing at this stage, as we’re not sending any information anywhere. Let’s add some code to send it to Honeycomb.
       var honeycombOptions = new ConfigurationBuilder()
            .AddJsonFile("appsettings.Test.json")
            .AddEnvironmentVariables()
            .Build()
            .GetSection("Honeycomb").Get<HoneycombOptions>();

        _tracerProvider = Sdk.CreateTracerProviderBuilder()
            .AddHoneycomb(honeycombOptions)
            .AddSource(TracerName)
            .Build();
This code will grab the Honeycomb settings from either a file name `appsettings.Test.json` or it will take them from Environment variables, which can be useful if you’re running this in a build pipeline.
Step 3: Add a Test Run ID to each span
We also need to add an attribute to each span that shows which test run execution it was part of. This is really easy in OpenTelemetry with the use of a processor that will run on every monitored `Activity`. This is an example of a processor that will create a static at runtime, and then use that same static to append an attribute called `test.run_id` that we can use for querying later.
public class TestRunSpanProcessor : BaseProcessor<Activity>
{
    private readonly string _testRunId;

    public TestRunSpanProcessor(string testRunId)
    {
        _testRunId = testRunId;
    }

    public override void OnStart(Activity data)
    {
        data?.SetTag("test.run_id", _testRunId);
    }
}
We can then add that to our `TraceProvider`.
.AddProcessor(new TestRunSpanProcessor(Guid.NewGuid().ToString()))This property will allow us to do some investigations within a test run by adding queries, like the below:
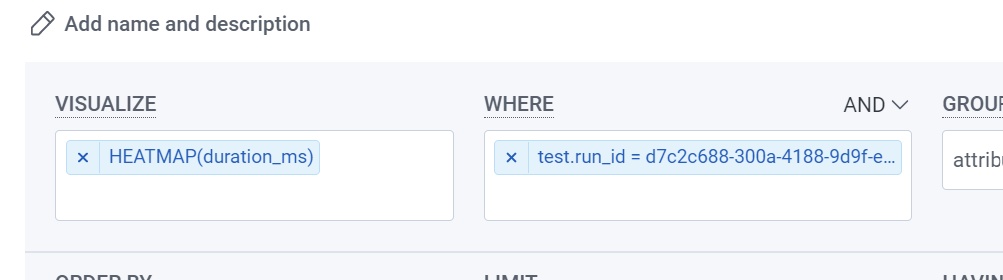
We can, for instance, heatmap some of the processes happening during the test.
We’ll add a static `ActivitySource` to our OpenTelemetryFixture so that we can attach our test spans to it. This is static so that we can access it without an instance.
Step 4: Add the fixture to assembly scope
Finally, we need to set up our fixture as assembly scoped so that we don’t create multiple providers and end up with multiple spans for the same thing. This is done using a base class for all the tests. You can add these references to your existing base class if you have one—it doesn’t need to be unique.
[assembly: TestFramework(AssemblyFixtureFramework.TypeName, AssemblyFixtureFramework.AssemblyName)]

namespace unittest_with_otel.Framework;

public class BaseTestWithAssemblyFixture : IAssemblyFixture<OpenTelemetryMonitoredFixture>
{

}
Note: You do need to add this interface to all your tests, which is why I recommend doing this with a base class instead of adding the interface to each test class.
Step 5: Choose a method of reporting
Now, we need to work out how we’re going to need to create our spans for the tests. This is where you need to decide how you want to represent your tests.
Option 1: Trace per test run
In this option, we’re going to create one span for each of the tests only, and they’ll be part of a single trace.
This approach is useful when you’re only interested in the time each test takes to run, and you don’t have 10k+ tests. It is also incredibly useful when you’re attempting to work out which of your tests are running in parallel, and which aren’t.
For this, we’re going to create a new attribute class and add that to our test classes. Xunit provides an attribute you can apply, which has methods that run before and after the test executes, called `BeforeAfterTestAttribute`.
public class TracePerTestRunAttribute : BeforeAfterTestAttribute
{
    private Activity? activityForThisTest;
    internal static Activity? ActivityForTestRun = OpenTelemetryMonitoredFixture.ActivitySource.StartActivity("TestRun");

    public override void Before(MethodInfo methodUnderTest)
    {
        if (ActivityForTestRun == null)
            throw new ArgumentNullException(nameof(ActivityForTestRun),
            "The test run Activity was null, and therefore can't be used");

        activityForThisTest = OpenTelemetryMonitoredFixture
            .ActivitySource
            .StartActivity(methodUnderTest.Name,
                ActivityKind.Internal,
                ActivityForTestRun.Context);

        base.Before(methodUnderTest);
    }

    public override void After(MethodInfo methodUnderTest)
    {
        activityForThisTest?.Stop();
        base.After(methodUnderTest);
    }
}
Let’s look at what’s in this class.
First, we have a static property for the `Activity` of the whole test run. Creating it this way will ensure that it’s both created, and exists only once for the test run.
Then, we create a new `Activity` in the `BeforeTest` that we then stop in the `AfterTest` method. When we create this `Activity`, we’re using the `MethodInfo` to get the name of the test method. This is a place where you could add more elaborate things, like tagging tests with other attributes so you can get richer information in your test spans.
Note: we’re specifically adding the `ActivityContext` of the Test Run span as our parent context to the test `Activity` for the test. This is because tests run in their own context, and don’t automatically get the `Activity` context of the TestRun as a parent. The inheritance of trace hierarchy is counterintuitive to the way `Activity` normally works in .NET, so be careful to ensure that you add the `ActivityForTestRun.Context` part.
Option 2: Trace per test
In this method, you’ll get an individual trace for each test that’s run for that execution. This can be useful if you also want to record child spans from the test. For instance, if you want to show the trace through your application in an outside-in or integration test scenario.
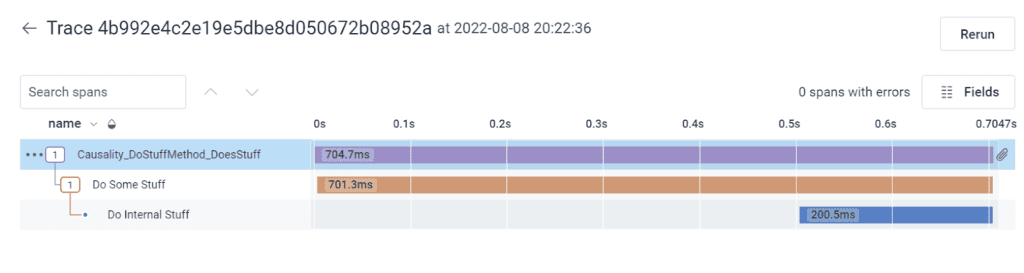
The difference between this and option one, from a code perspective, is that in the `BeforeTest` method, instead of adding the test run `Activity` as the parentcontext, we’re going to add an empty context as the parent (to indicate that it’s a root span). We’ll then add the test run `Activity` as an `ActivityLink` instead. This means that we can still get to the test run from the individual tests, however, it’s not part of the trace waterfall.
        var linkToTestRunActivity = TestRunSpan == null ?
            null :
            new List<ActivityLink> { new ActivityLink(TestRunSpan.Context) };

        activityForThisTest = OpenTelemetryMonitoredFixture.ActivitySource.StartActivity(
            methodUnderTest.Name,
            ActivityKind.Internal,
            new ActivityContext(), links: linkToTestRunActivity);
Note: In the repository, there are the above options, but also a third option, which is a single attribute with the options enabled via a boolean property.
Step 6: Add it to our tests
Now, we can set up our tests to use our fixture and our attributes so that things are recorded via our OpenTelemetry pipeline.
This is the easiest part. You add the base class inheritance and the attribute:
[TestActivityAttribute]
public class TopLevelTestsOnly : BaseTestWithAssemblyFixture
{
   … tests
}
Let’s look at the results
Depending on how you’ve chosen to record your tests, you can start to do different kinds of exploratory analysis and answer some questions about your system and the tests.
Try answering some of these questions:
- What test takes the longest?
- Does that test always take that amount of time?
- What makes that test long?
- Did all your tests run in parallel?
- Do your internal spans have consistent performance?
Conclusion
Adding OpenTelemetry to your tests can be done without adopting OpenTelemetry for your entire business. It provides amazing visibility of your application tests. Although this is not my usual “10 lines of code” example, I hope you can see that it’s not hard to do and is unobtrusive to your existing tests.
If you’d like to try this out, sign up for a free Honeycomb account and give it a go. I’d love for you to tag me on twitter with what you’re able to uncover!