
Remember the old days where if you had an uptime of 99.9 you could be fairly confident everyone was having a good experience with your application? That’s not really how it works anymore. Modern, distributed systems are so complex they typically fail unpredictably, making it much harder to diagnose issues. Traditional monitoring grew out of those early days, allowing you to check the health of simpler systems. But for today’s unknown unknowns and black holes of errors, monitoring falls short—leaving observability as the only way forward.
In a nutshell, that’s the thesis of our second Authors’ Cut webinar where we go into more detail about chapters 1, 2, 3, and 9 from our new O’Reilly Book: Observability Engineering Achieving Production Excellence.
Oh yeah, Liz Fong-Jones, George Miranda, and I wrote a book!
After three years in the making, this baby is finally live. And now it’s time for the book tour 😉. In each Authors’ Cut webinar, we’re going deep on certain chapters, then recapping our discussions in a blog. For this post, I’ll cover the topics from our second webinar. That includes our definition of observability, how debugging practices differ between observability and monitoring, and how to decide when to use monitoring vs. observability.
What is observability?
Before we get into the differences between monitoring and observability, allow me to get a little religious about our definitions. Observability has three distinct characteristics to help you understand the internal state of your systems:
- High cardinality refers to a data attribute that has many, or even multitudes, of values. A social security number field in an online banking form, for which there are hundreds of millions of values, is an example of high cardinality. Whereas species or eye color have low cardinality. If you think of a database, high cardinality is like having a table with many columns.
- High dimensionality refers to a dataset with many different attributes, such as biological science data that includes symptoms and blood test results, collected from hospital patients. With many different attributes, it’s possible to explore every facet of data. If this were a database, high dimensionality would be a table with many rows.
- Exploratory means you have the ability to explore your data in real time and ask arbitrary questions. This is in contrast with creating predefined views for particular failure states that you might be aware of. The exploratory nature of observability allows you to determine what was happening in your system at any given time when a failure occurs.
What is monitoring?
Monitoring involves gathering metrics and evaluating specific facets of a software system’s efficiency against predetermined thresholds. The primary objective is to issue alerts and notifications when known conditions are met, typically because they could signal that issues might be happening. Monitoring can help engineers pinpoint performance issues, presuming they know which exact conditions to look for.
However, that approach operates reactively. It can work well at the system layer, where components tend to either be working or broken. But it works less well at the application layer, often triggering false positives (or failing to catch issues), where components often have partial degradations occurring. In that regard, monitoring and observability serve distinct purposes and can be implemented at various stages of the software development lifecycle.
Gathering the right data makes debugging easier
At Honeycomb, we see observability as your ability to ask arbitrary questions about your environment—without having to know ahead of time what you wanted to ask. That’s why we consider the arbitrarily wide structured event as the foundation for observability. These data blobs capture high cardinality, high dimensionality, and exploratory data that provides enough context to slice, dice, and answer unknown unknowns. Honeycomb allows you to drill down into your application and telemetry data to analyze any possible combination of details that might reveal the problem in your application.
Compare that to creating a monitoring dashboard for a simple system. With only a few dimensions, it’s feasible to create a dashboard for every permutation. But when you have dimensions in the thousands, it just doesn’t make sense to populate a dashboard with every single combination.
Let’s see how that works when it comes to debugging. Say someone using your app reports an error. With observability, you can slice your telemetry data to look at only events that relate to that user’s requests and check out what’s going wrong. You can even query on dimensions like duration to find only fast-running events. That’s not possible with monitoring.
Choosing between monitoring and observability
As someone posted in the chat during our webinar, “Monitoring works for me when I already know the question I want answered. But observability is for when I don’t yet know what I’m looking for.” Ding ding! A gold star for them. They’re spot on.
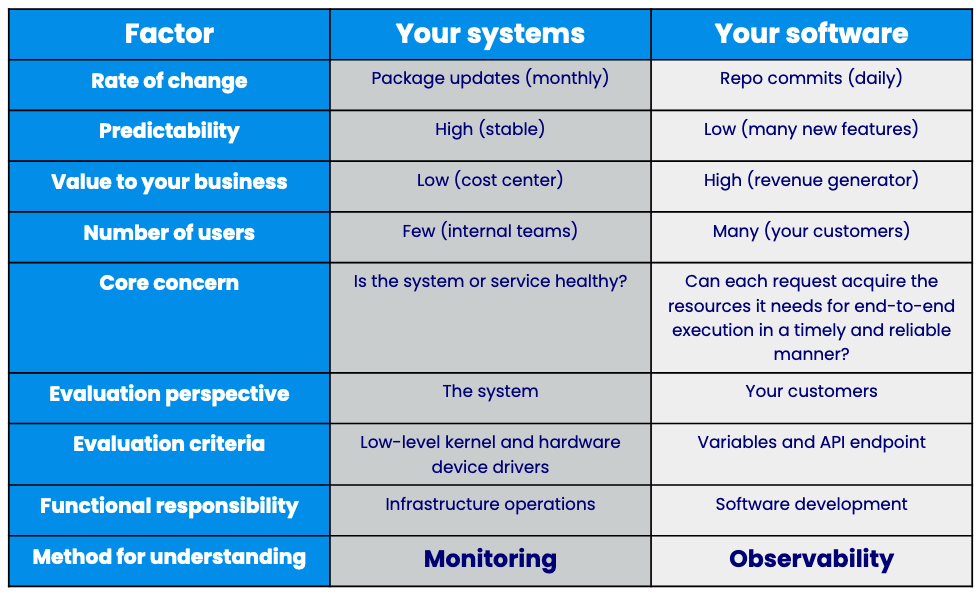
There is a time and a place for monitoring. If you work on a simple system that fails predictably, then by all means, define and monitor a metric that tells you about your system health so you can fix failures. But if you’re dealing with modern distributed systems, you’ll also need observability to dig into issues and find answers.
Here’s a snapshot of when to use monitoring versus observability:
This was just a taste
Sadly we can’t jam an entire webinar into a blog, so if you want to learn about auto instrumentation options for getting started with observability or how the cost of metrics can sneak up on you, you’ll just have to watch the recording.
But this doesn’t mean the conversation is over! We have more Authors’ Cut webinars planned, so sign up to join us live. If you truly can’t wait until our next talk, you can get your observability fix by reading our O’Reilly book.
Or you can give Honeycomb a try—there’s always that. Sign up to get started.