Transitioning to OpenTelemetry
This article touches on how we at Birdie handled our transition from logs towards using OpenTelemetry as the primary mechanism for achieving world-class observability of our systems.

By: Einar Norðfjörð
Flight to Success: Birdie’s DevOps Evolution Fueled by Observability Insights
Learn MoreThis post was first published by Einar Norðfjörð on his website.
This article touches on how we at Birdie handled our transition from logs towards using OpenTelemetry as the primary mechanism for achieving world-class observability of our systems.
We had bet on structured logging using bunyan. This meant our logging platform had an easy time parsing our logs and making them queryable on the different dimensions we were emitting. However, our logging strategy could be best summarized as “Yes.” We shipped request logs from ALB, nginx ingresses and istio sidecars, and the applications themselves as well. We logged each SQS message handling in triplicate (Received SQS Message, Started processing SQS Message, Finished processing SQS message). We tended to log method calls in duplicate (Doing X, Successfully did X). Our log levels were not well thought out and we’d often log warnings for things that were entirely expected.
It turned out that a lot of this information was already captured automatically by OpenTelemetry with the added benefit of causal linking between spans. In essence, we were effectively doubling our telemetry cost by emitting the same data in slightly different formats.
What is the difference between a log and a span?
Since we were already using structured logging, the difference between a log and a span was actually fairly small. You can think of a structured log line as an arbitrarily wide structured datablob. A span is that, with some additional conventions layered on top. A span will contain a:
- Name: The name of the operation.
- Timestamp: When did the operation occur?
- Duration: How long did the operation take?
- Kind: Is it a server, client, consumer, producer, or internal span?
- Trace ID: Which unit of work (e.g., request) is this span a part of?
- Span ID: Unique identifier for this span.
- Parent ID: The Span ID of the parent (empty for root spans).
Had we added all of the above to our logging infrastructure, it’d have been indistinguishable from OpenTelemetry spans. Of course, there’s more to OpenTelemetry than just spans. For one, it has robust context propagation. Propagation is the act of encoding and sending the “context” (trace id, span id, other baggage) to a downstream service in order to allow us to stitch together the full path of a request through our system. We had built some custom tooling for log context propagation by attaching request IDs as HTTP headers. OpenTelemetry does this automatically, meaning we’d have less code to maintain.
See the profound impact of Honeycomb and OpenTelemetry together.
Another notable difference is that OpenTelemetry serializes the spans to the OTLP format and can send them over GRPC or HTTP. These protocols are highly optimized. Bunyan, meanwhile, serializes via JSON.stringify and ships over stdout.
The biggest difference, however, is in terms of mental model. When logging, we’re appending a “point in time” information to a log. Traces, on the other hand, are more than a list of what happened. They’re connected spans in a causal tree, drawn on a timeline.
Logs vs. traces
To better understand this, let’s look at two examples of logging and tracing in different contexts.
SQS message handler (logging)
async function handleMessage(message: Message) {
  log.info({message_id: message.id, tenant_id: message.tenant_id}, 'Processing message')
  const startTime = Date.now()
  try {
      // do all sorts of stuff
  } catch (err) {
    log.error(
      {err, message_id: message.id, tenant_id: message.tenant_id, duration: Date.now() - startTime },
      'Failed to process message'
    )
    throw err
  }

  log.info(
    { message_id: message.id, tenant_id: message.tenant_id, duration: Date.now() - startTime },
    'Message processed'
  )
}SQS message handler (tracing)
async function handleMessage(message: Message) {
  // the SQS auto instrumentation will already have created a root span
  // instead of creating more spans, we add additional context to the current one
  const span = trace.getActiveSpan()
  span?.setAttributes({ 'app.message_id': message.id, 'app.tenant_id': message.tenant_id })

  // do all sorts of stuff
  // note that we do not need to manually record the exception here because the
  // auto instrumentation will have wrapped our handler with a catch that does
  // `span.recordException(err)`
}Decider transaction (logging)
I’ve written on the Equinox programming model before where deciders are a primary abstraction.
async function transact(store, decider, streamName, command) {
  const [category, streamId] = StreamName.parse(streamName)
  log.info({ category, streamId, type: command.type }, 'Handling command')

  try {
    const [version, previousEvents] = await store.readStream(streamName)
    log.info(
      { category, streamId, type: command.type, version, events: previousEvents.length },
      'Loaded events'
    )

    const state = previousEvents.reduce(decider.evolve, decider.initialState)
    const newEvents = decider.decide(state, command)
    log.info(
      { category, streamId, type: command.type, version, events: newEvents.length },
      'Appending events'
    )

    const result = await store.append(streamName, newEvents, version)
    log.info(
      { category, streamId, type: command.type, result },
      'Handled command'
    )
    return result
  } catch (err) {
    log.error(
      { err, category, streamId, type: command.type },
      'Failed to handle command'
    )
    throw err
  }
}Decider transaction (tracing)
function transact(store, decider, streamName, command) {
  const [category, streamId] = StreamName.parse(streamName)

  return tracer.startActiveSpan('transact', {
    kind: SpanKind.CLIENT,
    attributes: {
      'app.category': category,
      'app.stream_id': streamId,
      'app.stream_name': streamName,
      'app.command_type': command.type
    }
  }, async span => {
    try {
      const [version, previousEvents] = await store.readStream(streamName)
      span.setAttributes({
        'app.event_count': previousEvents.length,
        'app.version': version
      })

      const state = previousEvents.reduce(decider.evolve, decider.initialState)
      const newEvents = decider.decide(state, command)
      span.setAttribute('app.append_count', newEvents.length)

      const result = await store.append(streamName, newEvents, version)
      span.setAttribute('app.result_version', result.version)

      return result
    } catch (err) {
      span.recordException(err)
      throw err
    } finally {
      span.end()
    }
  })
}These examples hopefully illustrate two things:
- The difference between logging and tracing isn’t that big
- Yet, traces are vastly superior to structured logs
That second point likely needs some elaboration. Why exactly are traces superior here? To answer that, we need to contrast the actual outputs of each approach.
Logs
{
  "name": "test",
  "hostname": "localhost",
  "pid": 166860,
  "level": 30,
  "category": "test",
  "streamId": "1",
  "type": "command",
  "msg": "Handling command",
  "time": "2024-02-25T20:52:24.407Z",
  "v": 0
}
{
  "name": "test",
  "hostname": "localhost",
  "pid": 166860,
  "level": 30,
  "category": "test",
  "streamId": "1",
  "type": "command",
  "version": 0,
  "events": 0,
  "msg": "Loaded events",
  "time": "2024-02-25T20:52:24.408Z",
  "v": 0
}
{
  "name": "test",
  "hostname": "localhost",
  "pid": 166860,
  "level": 30,
  "category": "test",
  "streamId": "1",
  "type": "command",
  "version": 0,
  "events": 1,
  "msg": "Appending events",
  "time": "2024-02-25T20:52:24.408Z",
  "v": 0
}
{
  "name": "test",
  "hostname": "localhost",
  "pid": 166860,
  "level": 30,
  "category": "test",
  "streamId": "1",
  "type": "command",
  "result": true,
  "msg": "Handled command",
  "time": "2024-02-25T20:52:24.408Z",
  "v": 0
}Traces
{
  "duration_ms": 1.556816,
  "time": "2024-02-25T21:04:16.052Z",
  "name": "transact",
  "app.category": "test",
  "app.stream_id": "1",
  "app.stream_name": "test-1",
  "app.command_type": "command",
  "app.event_count": 0,
  "app.version": 0,
  "app.append_count": 1,
  "service.name": "test_service",
  "telemetry.sdk.language": "nodejs",
  "telemetry.sdk.name": "opentelemetry",
  "telemetry.sdk.version": "1.21.0"
}The big difference here is the span represents the operation as a single wide event, where the logs represent the operation as four distinct events with differing attributes. The general strategy and mindset when tracing is to start with an empty dictionary and populate it with whatever interesting context appears along the way. It’s not uncommon to see a single event with 300-400 different attributes.
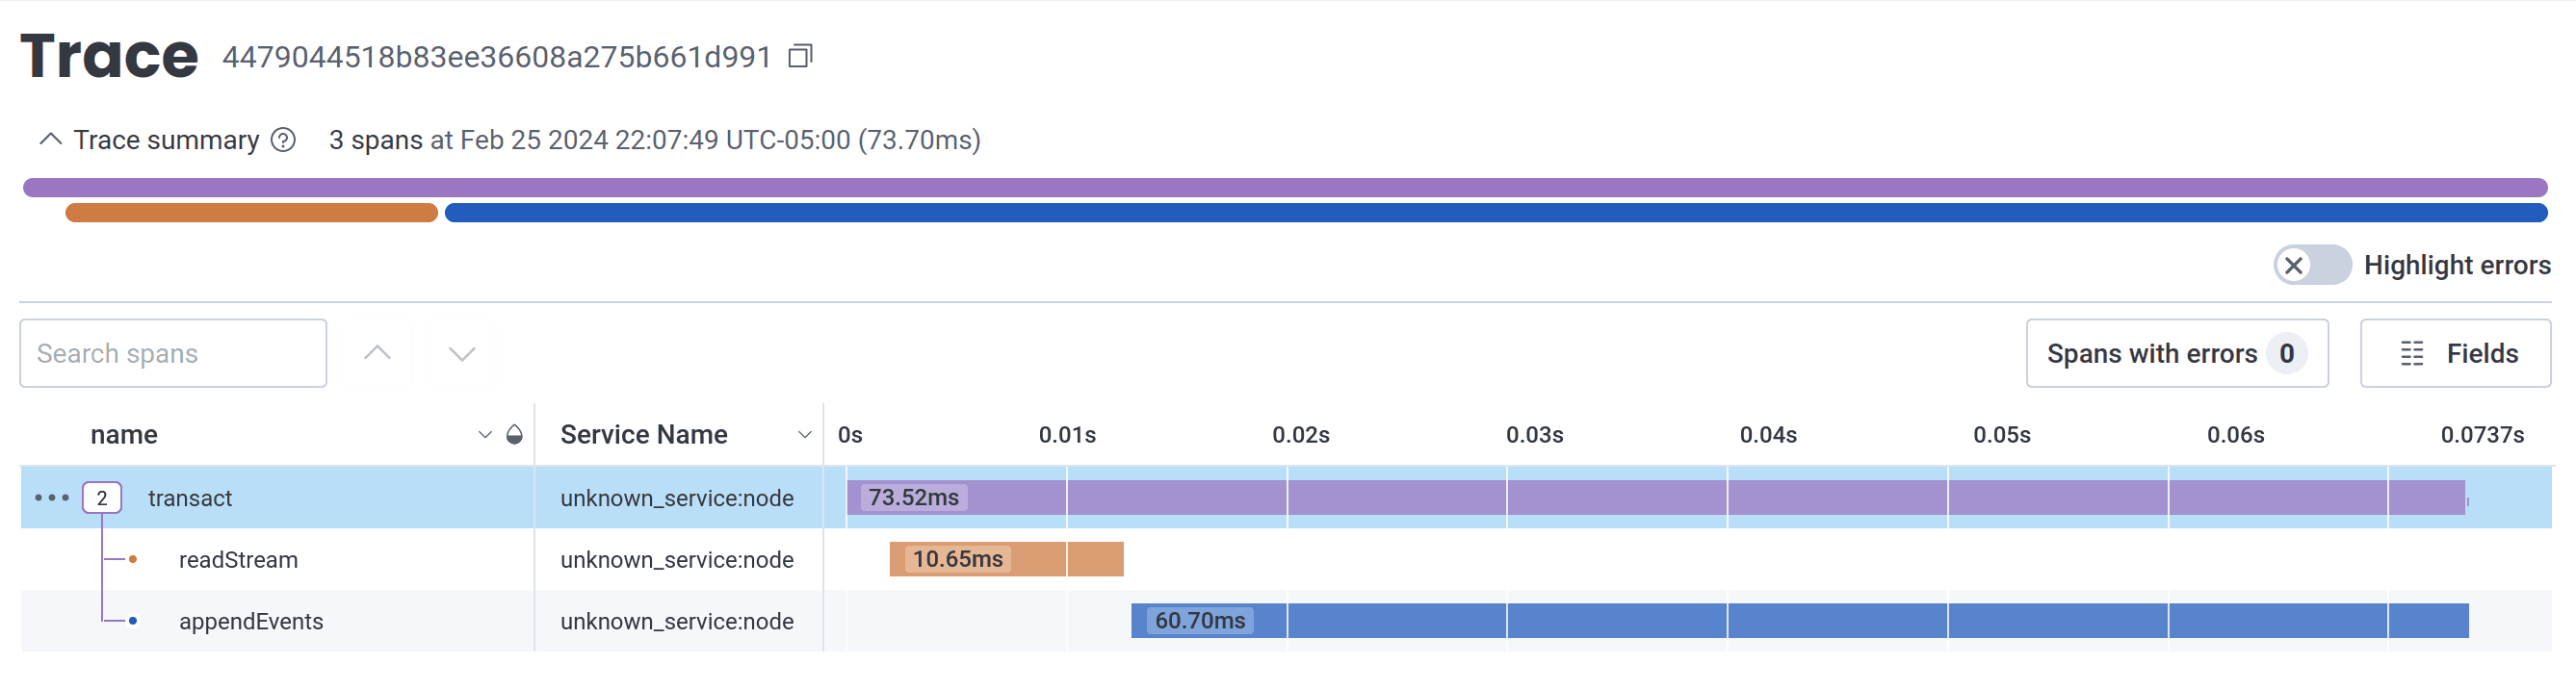
Visualizing traces
Because traces form a causation/correlation tree, it is possible to visualize them as a diagram.
The importance of vendor choice
The real win of what might not seem like a major shift in mental model comes once you have a way to extract insights from that data. You need a good tool that at minimum allows you to drill down/filter by any dimension, and preferably without requiring post-hoc configuration by you.
To illustrate, let’s look at some visualizations we take for granted these days.
Percentiles
Visualizing the P99, P75, or P999 of your durations is extremely valuable to get a quick idea of how your system is behaving.
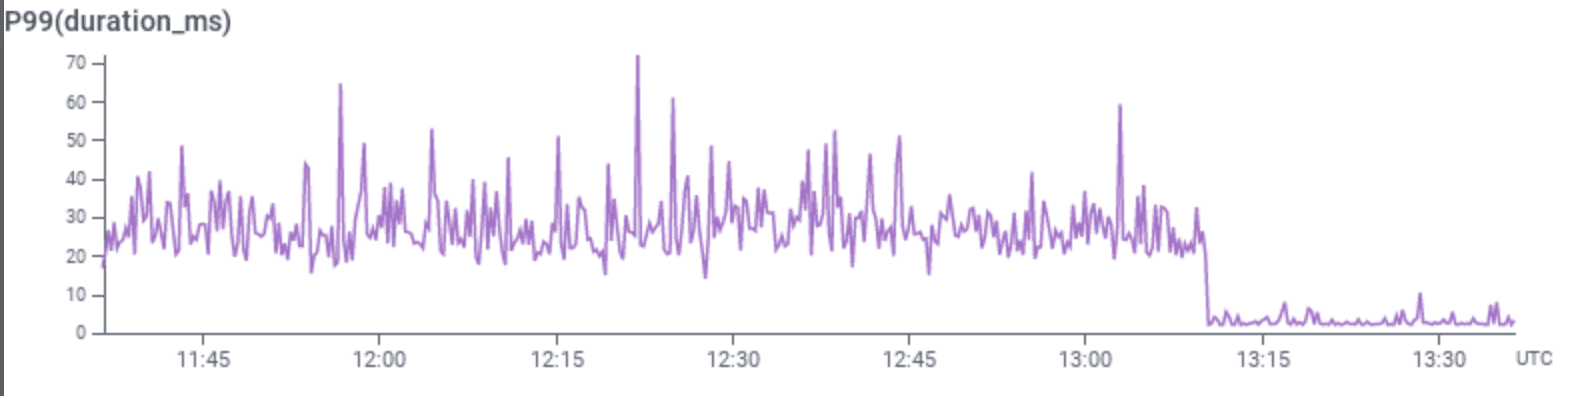
The above graph shows the impact of adding an index to a database query.
Heatmaps
The number of times P99s hid important information from us are too many to count. Take a look at these two graphs:
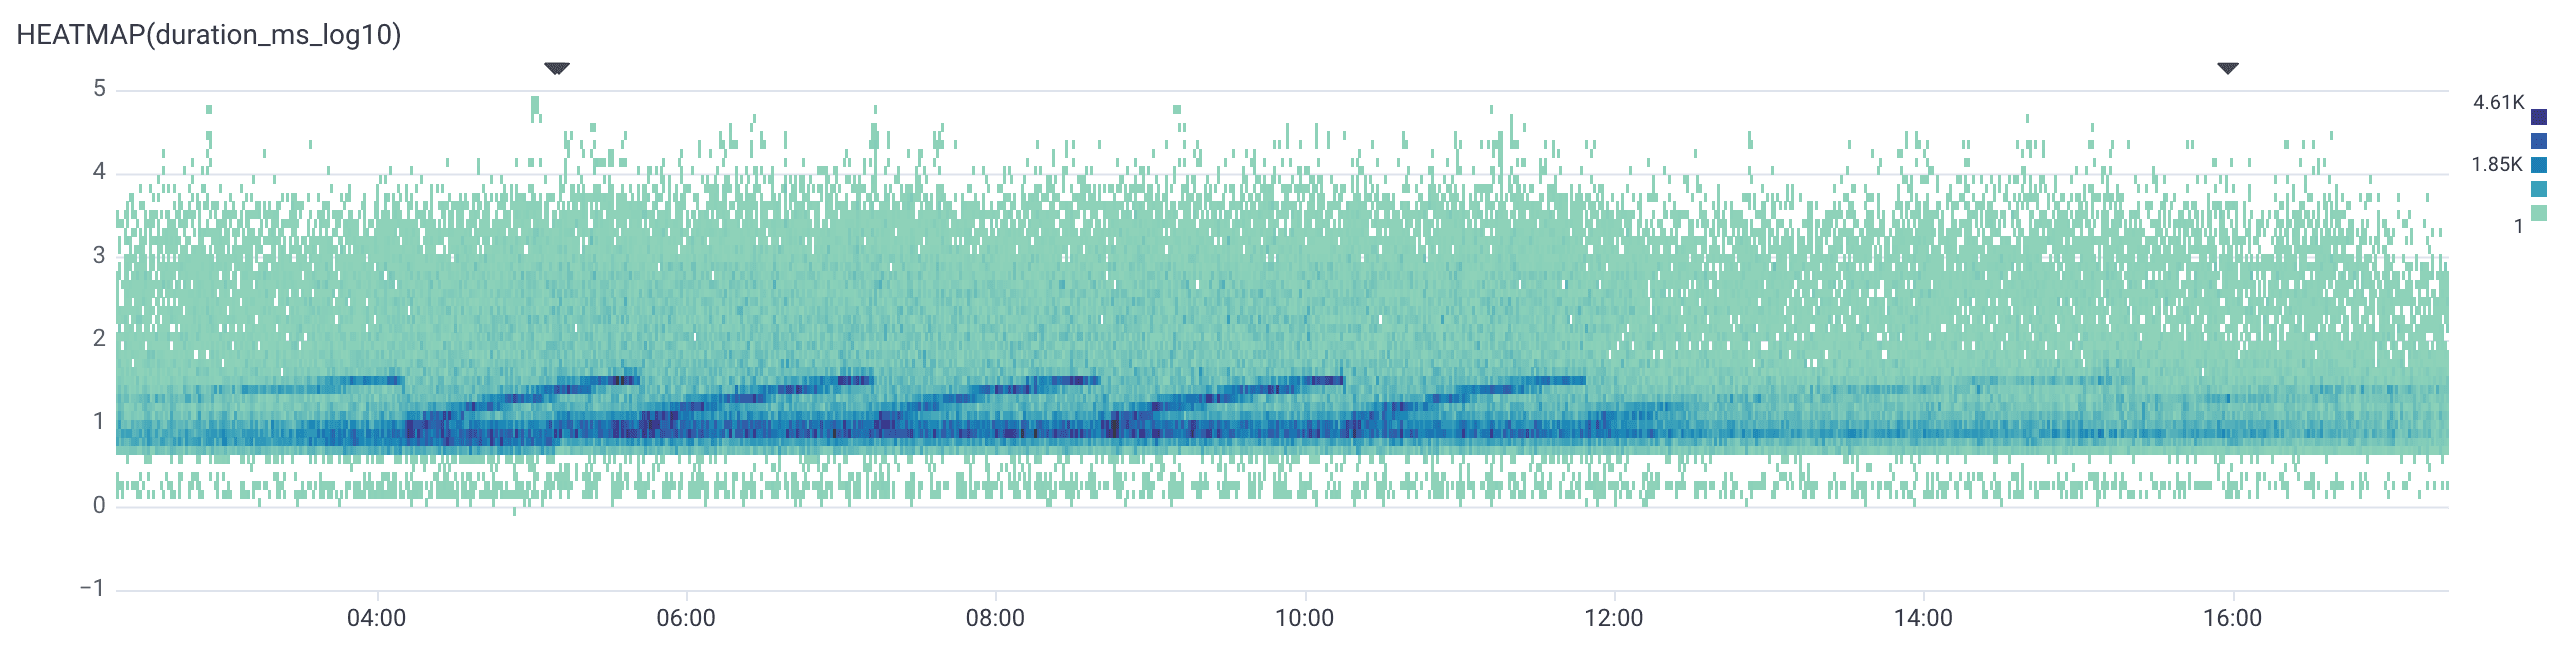
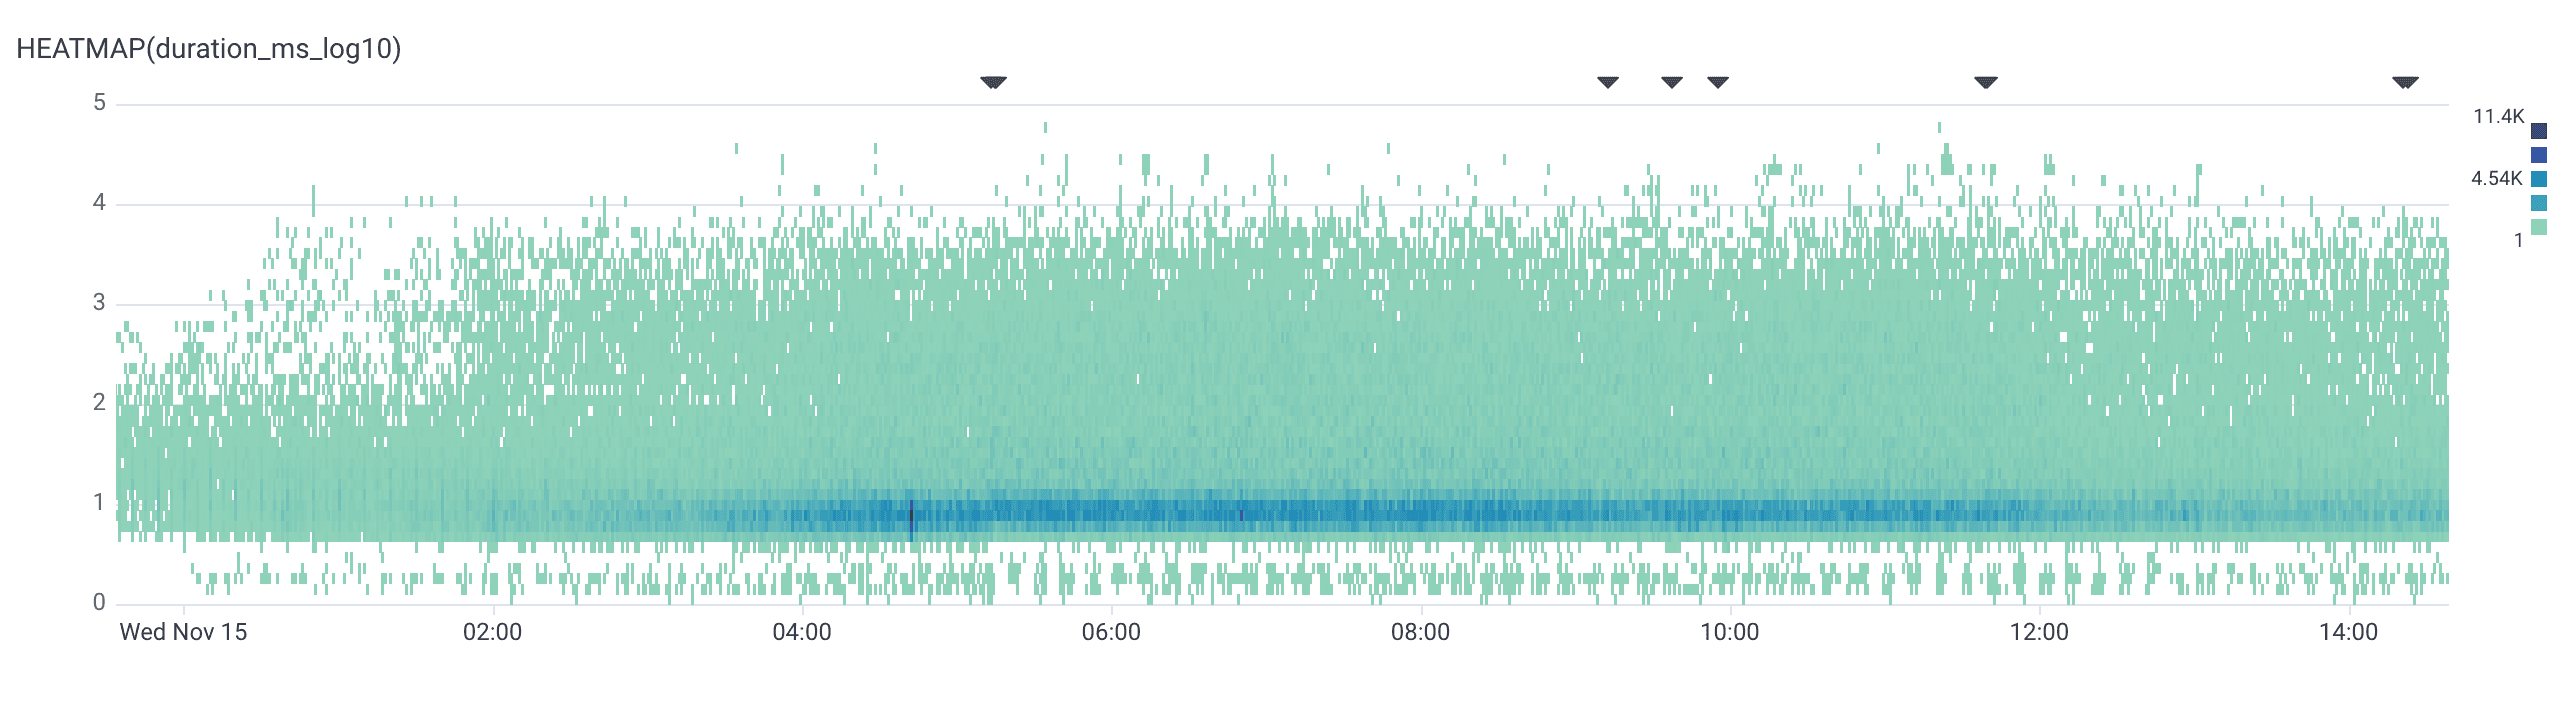
These two graphs are from the same service before and after we removed a GIN index on a highly active table. P99s could not paint this story as vividly. Those dark blue cells rising in waves on the first graph were the result of the underlying implementation of GIN indices having an in memory representation that is fast to append to, but slow to read. So periodically that structure gets flushed to disk, resetting performance (note that these flushes caused highly unpredictable insert latencies). We would not have been able to spot this pattern without the heatmap visualization.
Extra bonuses
If your vendor can automatically surface what is different between two groups of spans (e.g., those who meet an SLI and those that don’t), this can drastically shorten time to resolution when you can immediately see that an issue is affecting User 1, or Tenant 3 in particular. Or that it is localized to a particular availability zone.
The vendor we ended up going with is called Honeycomb and I could not recommend them more highly.
Resistance
I won’t lie and say this was all smooth sailing. One drawback that the team noticed fairly early was that their console was empty. They were very used to seeing what was happening locally by scanning the logs. It’s entirely possible to pipe your local traces to Honeycomb and use it during development, but we’re creatures of habit and giving up the scrolling wall of text can be a high price to pay. So instead we met our devs where they were.
It turns out you can derive logs from traces, so we did just that. I created a package called opentelemetry-exporter-console-pretty. This package outputs the spans to the console with fancy colors. Our devs can enable this exporter while developing to regain the comfy snuggle blanket of a scrolling wall of text.
Takeaways
- Structured logging and tracing aren’t very different
- OpenTelemetry takes care of a lot of the hard parts of distributed tracing
- You can derive logs (and metrics) from traces
- Tracing requires a shift in mindset
Try Honeycomb free today. Want to learn more about Birdie? Read their case study or watch the video below.
Want to know more?
Talk to our team to arrange a custom demo or for help finding the right plan.