Refinery, Honeycomb’s tail-based dynamic sampling proxy, often makes sampling feel like magic. This applies especially to dynamic sampling, because it ensures that interesting and unique traffic is kept, while tossing out nearly-identical “boring” traffic. But like any sufficiently advanced technology, it can feel a bit counterintuitive to wield correctly, at first.
On Honeycomb’s Customer Architect team, we’re often asked to assist customers with their Refinery clusters. The most common question we get is, “Why isn’t Refinery hitting the goal sample rates I’ve set? It’s not even coming close.” Sometimes, they just want Refinery to sample harder, and don’t know how to make that happen.
This blog post details the techniques we use to get Refinery sampling far more effectively, as well as troubleshooting common pitfalls. We assume you’re already running the latest version of Refinery (1.21 at the time of writing) and sending all your traffic through it. If not, check out this guide first.
Start here
Life-saving diagnostic fields
Before you do anything else, ensure that you have the following diagnostic config options set in your Refinery config file (/etc/refinery/refinery.toml). These will add some fields to all new spans, but don’t sweat it! They won’t impact performance or cost you a penny:
AddHostMetadataToTrace = true
AddRuleReasonToTrace = true
AddSpanCountToRoot = true
QueryAuthToken = "SomeRandomValue"
# Adjust the error fields according to availability in your dataset and diagnostic value
AdditionalErrorFields = [
  "trace.trace_id", "trace.parent_id", "service.name", "name", "host.name"
]
# Cache sampling decisions for much longer than default
[SampleCacheConfig]
Type = "cuckoo"
KeptSize = 100_000
While you’re in that config file, let’s ensure Refinery is reporting back to Honeycomb so that you can leverage the fantastic Refinery Starter Pack. More on this later.
If you’re a Honeycomb Enterprise customer, you’re entitled to free Refinery metrics and logs. Talk to your account team about this! If not, feel free to crank up the LoggerSamplerThroughput and MetricsReportingInterval values to fit your events budget.
LoggingLevel = "info"
Logger = "honeycomb"
Metrics = "honeycomb"

[HoneycombLogger]
LoggerHoneycombAPI = "https://api.honeycomb.io"
LoggerAPIKey = "${HONEYCOMB_API_KEY}"
LoggerDataset = "Refinery Logs"
LoggerSamplerEnabled = true
LoggerSamplerThroughput = 10

[HoneycombMetrics]
MetricsHoneycombAPI = "https://api.honeycomb.io"
MetricsAPIKey = "${HONEYCOMB_API_KEY}"
MetricsDataset = "Refinery Metrics"
MetricsReportingInterval = 60
A side quest into Usage Mode
Let’s run some queries in Usage Mode. If you’re not familiar with it, Usage Mode disables Honeycomb’s automatic adjustments for sample rate and provides you with a Sample Rate field you can visualize. There are two ways to get into it:
Usage Mode, the clicky way
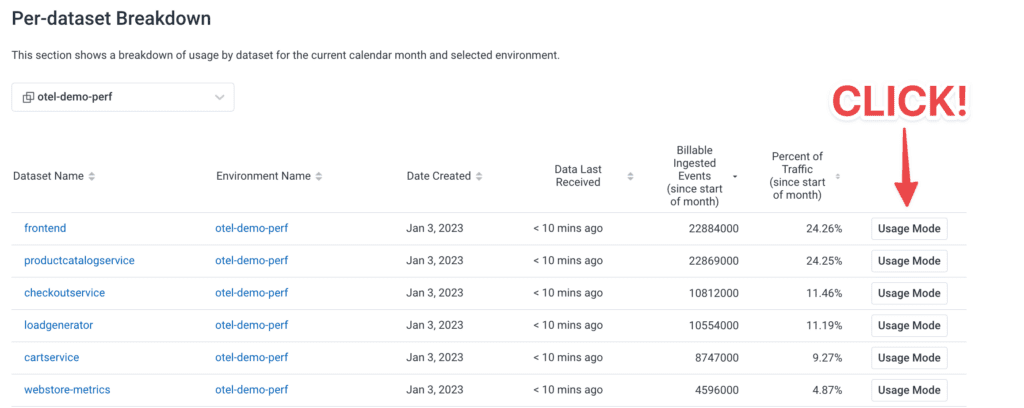
First, head on over to your Usage page, via the “mood ring” in the bottom-left corner of the Honeycomb UI.

Scroll to the bottom of the Usage page, where you’ll find the Per-dataset Breakdown section. Sort this by either Billable Ingested Events or Percent of Traffic, and click the Usage Mode button for the top one. Now, you’re querying that dataset in Usage Mode (note: if this is a non-Classic environment, you can switch to “All datasets in environment” and remain in Usage Mode).
Usage Mode, the hacker way
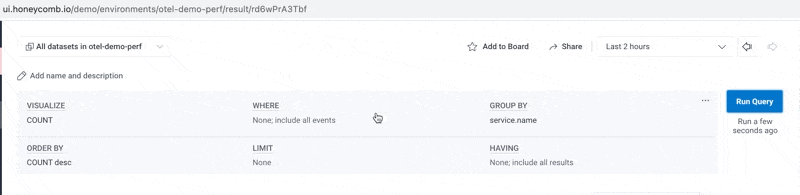
The astute will notice that the query builder URL is slightly different—there’s now /usage/ in the path. That’s the whole trick, right there.
You can take any empty query builder screen and throw /usage/ at the end:

You can even take any existing query and ✨transform✨ it into Usage Mode! Make sure to hit “Run Query” again to get the right results.
How’s my sampling doing now?
Now that you’ve identified your biggest (by event volume) datasets and environments and know how to query them in Usage Mode, let’s start with a simple visualize of COUNT, AVG(Sample Rate) , MAX(Sample Rate), and MIN(Sample Rate) over the past 24 hours. Later on, you can optionally replace those three Sample Rate vizzes with a heatmap—but for now we want to see are straight numbers reported in the results table below.
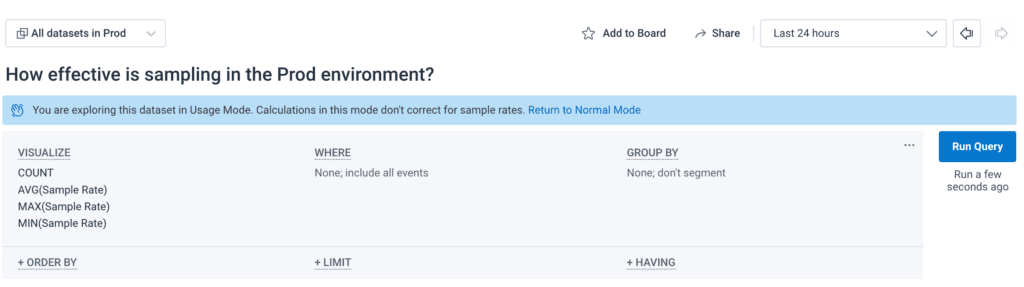
This results in the following:
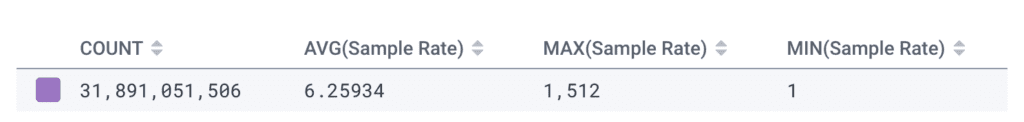
In this environment, some things are heavily sampled (one out of every 1512 events), but our overall sample rate is relatively poor—just one out of every six events. We could probably do better.
Breaking down the data to find what went wrong
Let’s iterate through a few different GROUP BY sets to figure out where the poor (and great) sampling is. Let’s start with some well-known low-cardinality identifiers. I always start with service.name, but this may vary in your data.
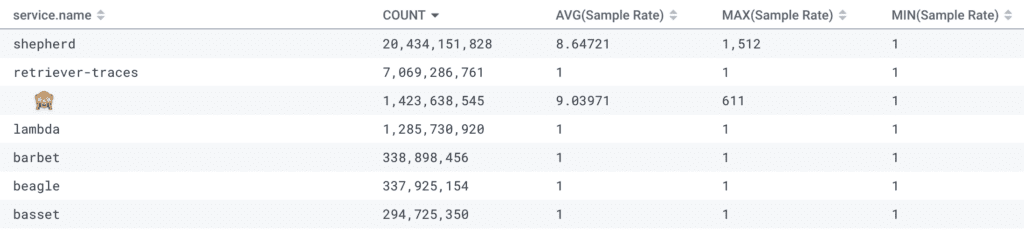
We can see right away that the shepherd service is where we should spend our time and energy. It has sent more post-sampled events than all of the other services combined.
Another example of what can go wrong right out of the box:
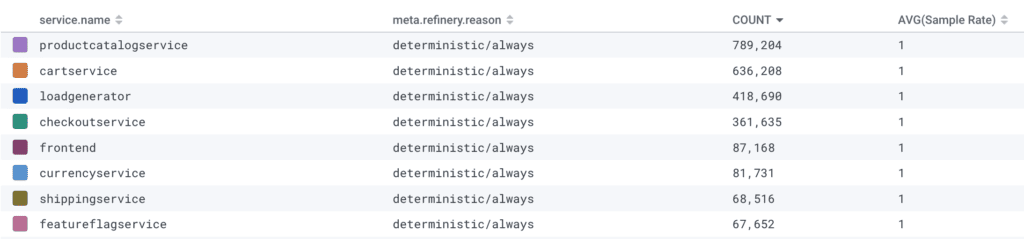
Oops! The environment name was typoed in the rules.toml, so none of the events matched and were passed through with the reason deterministic/always.
High cardinality is awesome and we love it, except as a dynamic sampler key
The dynsampler key is your best friend when diagnosing dynamic sampler misbehavior. If you’ve configured Refinery to do so (recommended! Remember, there’s no additional cost in Honeycomb to do so 🙂), you’ll see a meta.refinery.reason field (if AddRuleReasonToTrace = true is in the config) and/or a field of your choosing (the AddSampleRateKeyToTraceField key under the EMADynamicSampler rule).
Once you’ve narrowed down to a particular service.name or other identifier, let’s GROUP BY one of the aforementioned fields to explain what I mean.
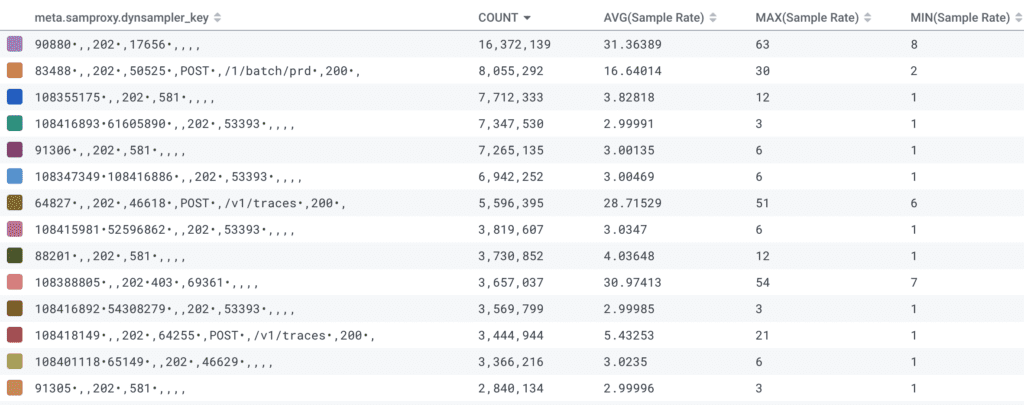
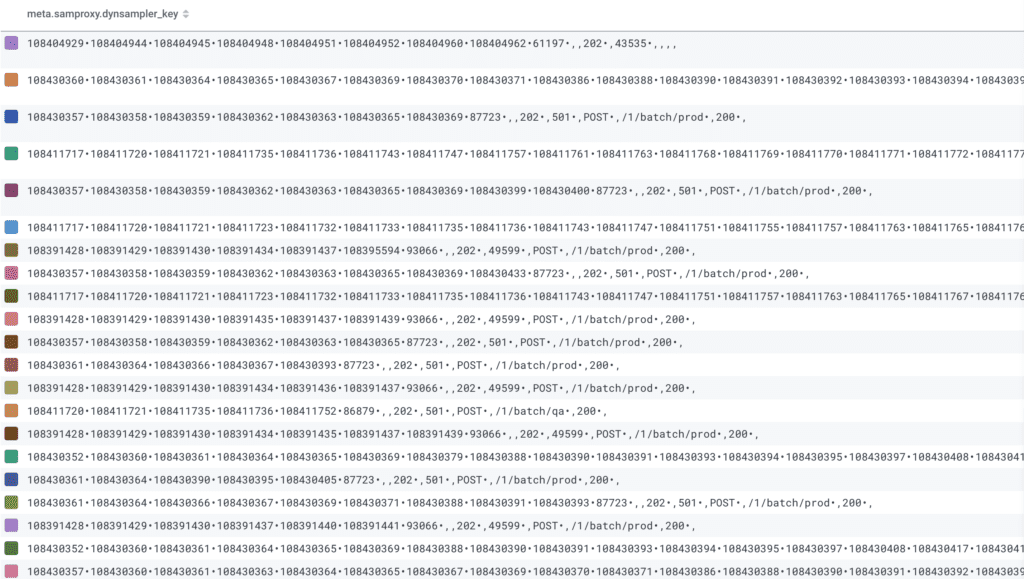
The dynsampler key is comprised of all of the fields EMADynamicSampler FieldList, separated by a comma. Inside that, you’ll see a list of all detected values in a trace separated by a bullet (•).
This is quite a big gotcha with Refinery’s dynamic sampler. Because it’s making a trace-level sampling decision, it must consider all of the unique values of every field in the field list, and every unique combination is a new sampler key. This means that Refinery will consider it to be unique and interesting, and worth applying a very low sample rate to.
In the most extreme examples, you can have dozens of different values for a given field, because each span in the trace emits a different value for that field. This results in thousands of unique sampler keys, and very little chance that dynsampler will hit the goal sample rate (see example below). Ideally, you want no more than a few dozen (certainly <100) unique dynsampler keys if you want Refinery to hit the goal sample rate and behave in a predictable fashion.
For greater predictability, consider RulesBasedSampler
One of the most difficult aspects of dynamic samplers is that they’re not deterministic, meaning you won’t know in advance what they’ll do. While that’s fine in some cases, users have found themselves wanting greater predictability and control. For these cases, we’ll ask you to consider the following: What if what you really wanted all along was deterministic tail-based sampling?
Consider the following Refinery rules, which are often good enough for most cases, yet are far more easy to reason about:
[MyEnvironment]

Sampler = "RulesBasedSampler"

[[MyEnvironment.rule]]
name = "never sample errors"
SampleRate = 1
[[MyEnvironment.rule.condition]]
    field = "http.status_code"
    operator = ">="
    value = 400
[[MyEnvironment.rule.condition]]
    field = "status_code"
    operator = "<="
    value = 511

[[MyEnvironment.rule]]
name = "Keep all traces with any slow spans"
SampleRate = 1
[[MyEnvironment.rule.condition]]
    field = "duration_ms"
    operator = ">="
    value = 1000

[[MyEnvironment.rule]]
name = "drop healthy healthchecks"
drop = true
[[dataset4.rule.condition]]
    field = "http.route"
    operator = "="
    value = "/healthz"

[[MyEnvironment.rule]]
name = "Keep more information about Enterprise customers"
SampleRate = 10
[[MyEnvironment.rule.condition]]
    field = "app.pricing_plan_name"
    operator = "="
    value = "Enterprise"

[[MyEnvironment.rule]]
name = "Default Rule"
SampleRate = 100
In this example, we do the following:
- Never sample traces that contain errors or exceed our threshold for duration, because we don’t want our Honeycomb triggers and SLOs unduly impacted by sample rate amplification
- Drop all health checks (unless they were errored or slow)
- Apply custom sampling based on our business logic, reducing the sample rate (or perhaps boosting it) for specific customers
- Deterministically sampling everything else. Although you could replace this with an EMADynamicSampler rule, there are predictability advantages to not doing so. And sometimes, predictability matters more when you’re planning—or in the middle of an incident.
Sampling is powerful, but it’s not magic 🪄
Tail sampling gives you the ability to sample traces while retaining the context for interesting transactions. This hinges on some assumptions about the shape of the data coming to Honeycomb. To get the right balance of meaningful content while reducing lower-quality volume, it takes some review and refinement.
Keep in mind that what is important to your teams will change over time. And as the software changes, the sampling rules will need to change their shape to match. This process of refinement is important to revisit occasionally and share with developer stakeholders so we can all improve our shared understanding of the system.
In case you got here from Google and aren’t a Honeycomb user yet, I’ll leave you with an invitation to try our very useful and generous free tier today.
See you soon,
Irving