Frontend Monitoring: Deliver Seamless and Performant User Experiences
In this blog, we’ll share the fundamentals of frontend monitoring, including what you need to know about performance measurement and strategies for staying ahead of monitoring challenges to deliver high-performing, user-centric applications.

By: Rox Williams

Migrate from RUM to Honeycomb for Frontend Observability
Learn More88% of online consumers are less likely to return to a site after a bad user experience. This means that addressing frontend issues such as slow load times, broken features, and unresponsive elements is crucial. Frontend monitoring helps development and IT teams proactively catch and resolve these issues to improve their user experience.
In this blog, we’ll share the fundamentals of frontend monitoring, including what you need to know about performance measurement and strategies for staying ahead of monitoring challenges to deliver high-performing, user-centric applications.
What is frontend monitoring?
Frontend monitoring is the process of tracking and analyzing the performance of client-side components in web and mobile applications. Unlike backend monitoring, which focuses on server performance, frontend monitoring ensures that the user interface (UI) delivers seamless interactions, fast load times, and bug-free functionality.
Whether you’re optimizing for Core Web Vitals (CWVs), fixing Javascript errors, or analyzing real user sessions, frontend monitoring gives developers a starting place to address performance issues.
Types of frontend monitoring
Several forms of frontend monitoring can be used to address different use cases.
- Real-time monitoring tracks live system performance data, allowing teams to identify and address performance bottlenecks in real-time.
- Synthetic monitoring simulates user interactions to measure web or app performance from different locations and devices to gauge performance under various scenarios.
- User experience monitoring, like real user monitoring (RUM), gathers data from actual user sessions, offering insights into how users interact with the application.
These methods help developers and UI/UX designers find errors, maintain consistency across devices and experiences, and refine features to enhance the user experience.
How does frontend monitoring work?
Frontend monitoring uses real-time and synthetic data, collected from client-side components (such as Javascript in browsers or mobile applications) to provide a view of a frontend component’s performance. This data is sent to a server for analysis, enabling developers, DevOps teams, and UI/UX designers to identify and address performance issues.
Key measurements for frontend monitoring
When monitoring frontend performance, focus on a few key categories of metrics. These metrics are crucial for optimizing performance and user experience while also improving search engine visibility, as search engines factor in Core Web Vitals and other signals to determine page rankings.
Performance metrics
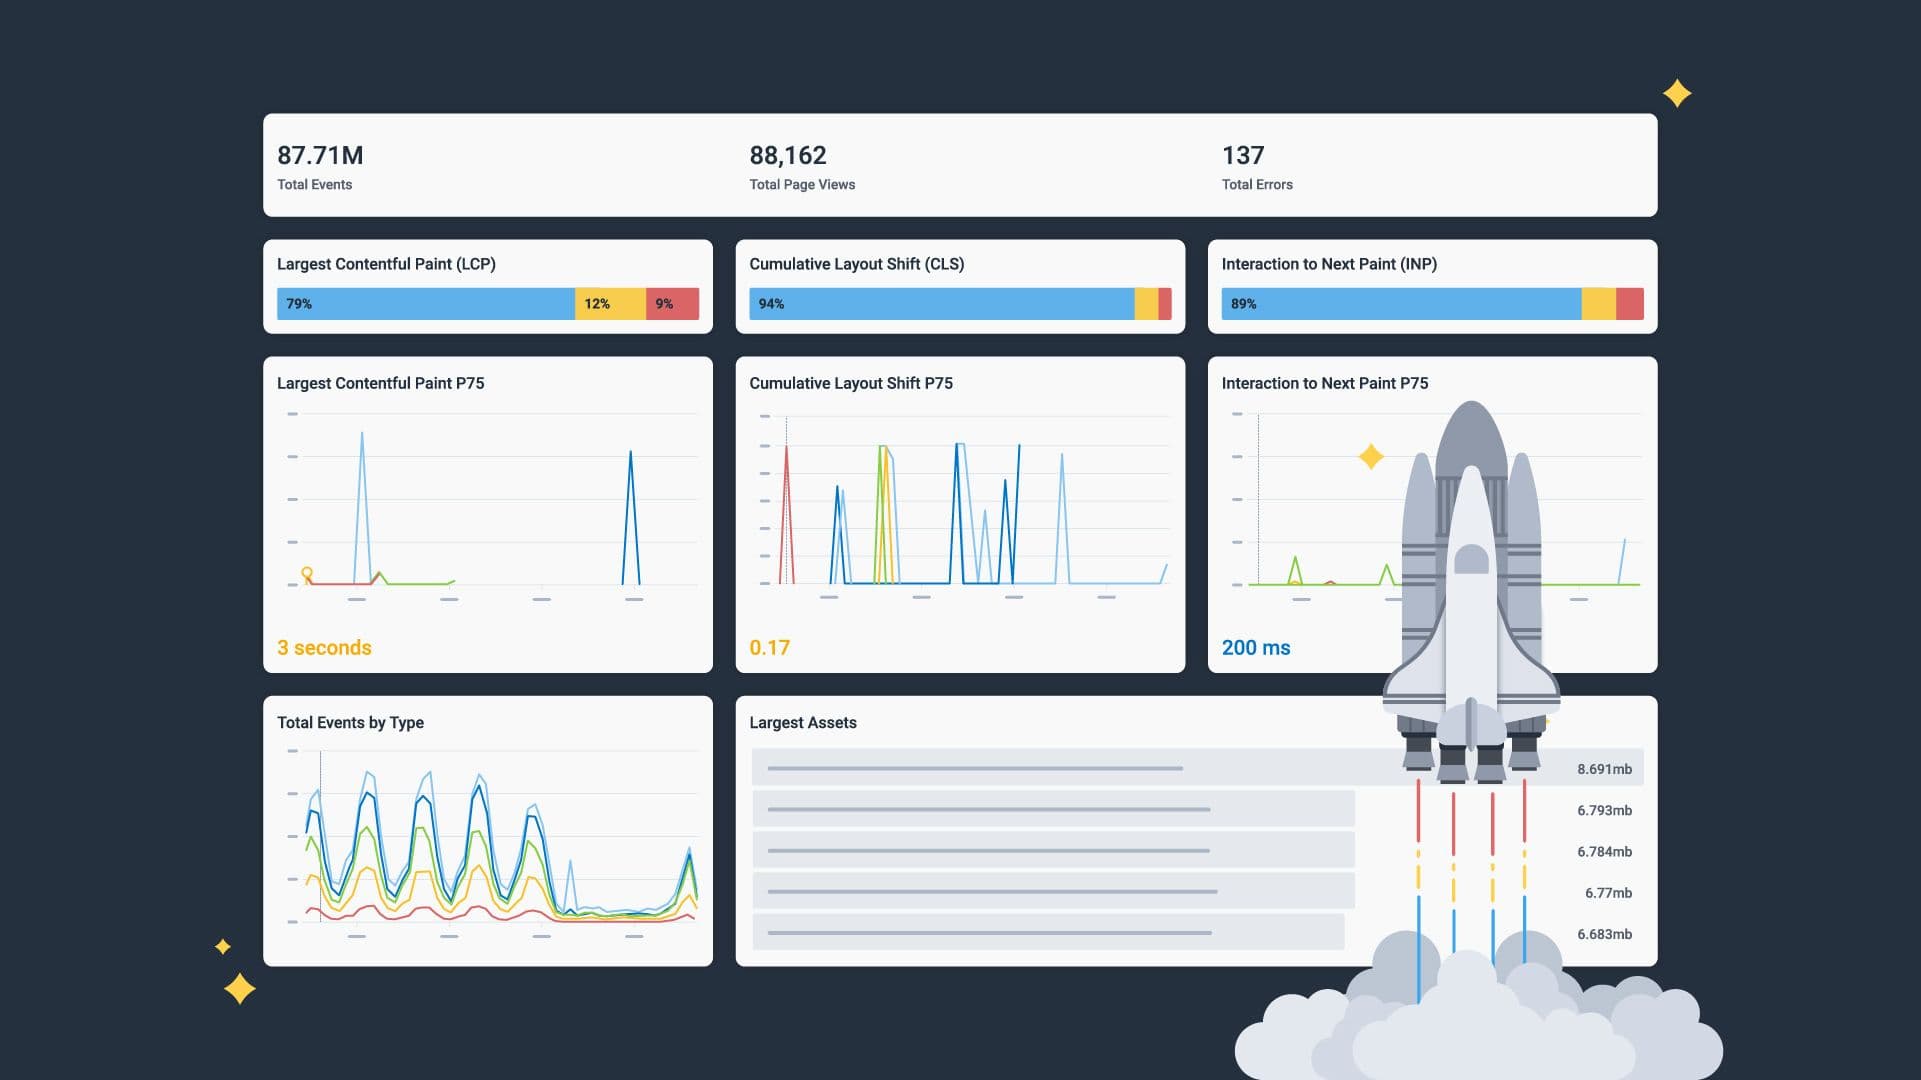
- Largest Contentful Paint: LCP is a proxy for how fast your page finishes loading. It measures how many seconds it takes for the largest element in view to fully render on page.
- Cumulative Layout Shift: CLS is a proxy for how much content on your page moves around as the page loads. It’s represented as a unitless score derived from how much of the page is affected by shifting content.
- Interaction to Next Paint: INP is a direct measurement of how fast the browser is able to respond to user input. It measures (in milliseconds) the time between an interaction (click, navigation, submit, etc.) and the next frame that the browser can render.
Error tracking
- Error rate: Error rates are percentages for requests that result in errors. It can identify problematic pages or client components.
- Failure events: Tracks specific failures, such as crashes or exceptions.
- Latency issues: Detects delays in processing or delivering content, which can signal bottles in the system.
User behavioral insights
- Click-through rate: CTR is the percentage of users who click on a specific client component compared to the total number of users who viewed it.
- Session duration: Tracks the average length of user sessions.
- Navigation patterns: Analyzes how users move through the site, highlighting popular paths or drop-off points in the client.
Search engines collect and analyze these metrics to assess the performance, relevance, and user-friendliness of sites. By monitoring these key metrics, developers and IT teams can ensure a seamless, high-performing frontend experience for users.
How to choose a frontend monitoring solution
Not all tools are created equal. Evaluate platforms for frontend monitoring using this short list of key features:
- Comprehensive coverage: The solution should support performance scenarios with both real user monitoring (RUM) and synthetic load generation. RUM captures performance measures directly from real users in diverse environments, offering a more accurate view of user experiences than synthetic tests, which rely on predefined scripts and controlled environments.
- End-to-end integration: Solutions should integrate frontend monitoring data with backend performance monitoring so that insights into latency can be attributed to client components.
- Scalability: The solution should scale and meet the monitoring needs of your system.
- User analytics: Prioritize tools that can track and analyze user interactions effectively and organize performance metrics for important features of the frontend client, including screen size, device, and browser information.
RUM can leave questions unanswered.
Honeycomb for Frontend Observability doesn’t.
Challenges in frontend monitoring
Frontend monitoring has become increasingly more difficult with the introduction of new devices and software architecture that continues to grow in scale and complexity. A common challenge for frontend monitoring involves browser and device variability. Performance issues may occur across any device, browser, or screen size, and there can be problems debugging and resolving these variations. Even minor discrepancies can lead to performance issues.
Debugging and resolving issues for complex user journeys is also a challenge. Monitoring intricate workflows with multiple touchpoints requires tools to track and analyze user interactions effectively. Development teams can become overloaded or fatigued by too much information if critical issues are lost in the noise of data.
Stay ahead of issues with frontend observability
Engineers with the right tools and insights can drastically reduce downtime, improve user satisfaction, and drive business success as issues arise. However, when the risks are high and negative user impressions can have a lasting effect on a business, we require a proactive approach to protecting and improving the user experience.
By enhancing frontend monitoring with observability, developers and IT teams can catch and resolve problems proactively before they escalate. Developers can use observability, not only when something is failing, but also to understand how their software is succeeding.
An observability solution can offer capabilities including:
- End-to-end tracing: an observability solution links frontend performance issues directly to backend operations, APIs, and services so you can understand the entire path requests are taking to isolate where issues originate.
- Actionable insights: observability solutions don’t just tell you that something is slow, they show you why by providing important details in an easily digestible format in real-time. For example, instead of being flagged with a slow LCP, observability will also show you which elements are loading slowly.
Stay ahead of performance issues by trying Honeycomb for Frontend Observability.
Want to know more?
Talk to our team to arrange a custom demo or for help finding the right plan.