Unpacking Events: All the Better to Observe
At Honeycomb, we believe events are the building blocks for observability. What exactly is an event? What does that mean for your team’s observability journey?

By: Shelby Spees
(This post was updated on 2021-02-26.)
At Honeycomb, we believe events are the building blocks for observability. What exactly is an event? What does that mean for your team’s observability journey?
You Already Think About Events
Honeycomb defines an event as a single “unit of work” in your application code. But a “unit of work” can have a dozen meanings in a dozen contexts. It can be as small as flipping a bit or as large as a round-trip HTTP request. The simplest definition is that an event is usually either a trace span, or a log event.
Let’s unpack that a bit further.
Log Events
For logs, enumerating events is pretty straightforward. If you use (or if you’re planning to use) honeytail to send structured logs into Honeycomb, you likely already know how many log events you’re sending. For infrastructure teams with less authority over code changes, installing an agent like honeytail, the AWS integrations, or the newly-upgraded Kubernetes agent is the best way to get data into Honeycomb. Each event in these agents corresponds to one event in Honeycomb.
Trace Spans and Events
With spans, we need to examine the definition a bit more. To start: we’ve decided that one span equals one event.
If you want high-res observability into your systems, you’ve probably looked into trace-aware instrumentation like our Beelines. We’ve already written a lot about the benefits of tracing. For this post, let’s focus on what 1 span == 1 event would mean for adding trace-aware instrumentation to your service.
As a service owner, you already have your own concept of events in your world: HTTP or API requests, background tasks, queue events, etc. If your app is in production, you probably know your traffic patterns, i.e.:
- How many of your service’s events you experience at any particular time scale—per second, per hour, per day, per month
- The seasonality of those events at different times of the day, week, month, year
When you’ve instrumented for tracing, one of your service’s events generates a single Honeycomb trace. A trace is made up of one or more spans. Remember that in this world, one span is one event.
Estimating Honeycomb Events
From here you can roughly predict your Honeycomb usage as a function of your traffic. For example, you could estimate your monthly usage like so:
(Number of your service’s events per month) × (Number of spans in each service event) _____________________________________________ = Honeycomb usage per month
So how do you figure out the number of spans for each of your service’s events?
A useful guideline: one span gets generated from each method call, down to a certain level of granularity. By “granularity,” we mean how deep you go down the call stack. Sometimes you care about the context in methods being called by other methods, and sometimes you don’t.
For example, you probably care more about what kinds of database queries your controller is making, and less about what arguments went into Math.sum(). (Don’t let me tell you what’s important, though! You know your code better than I do.)

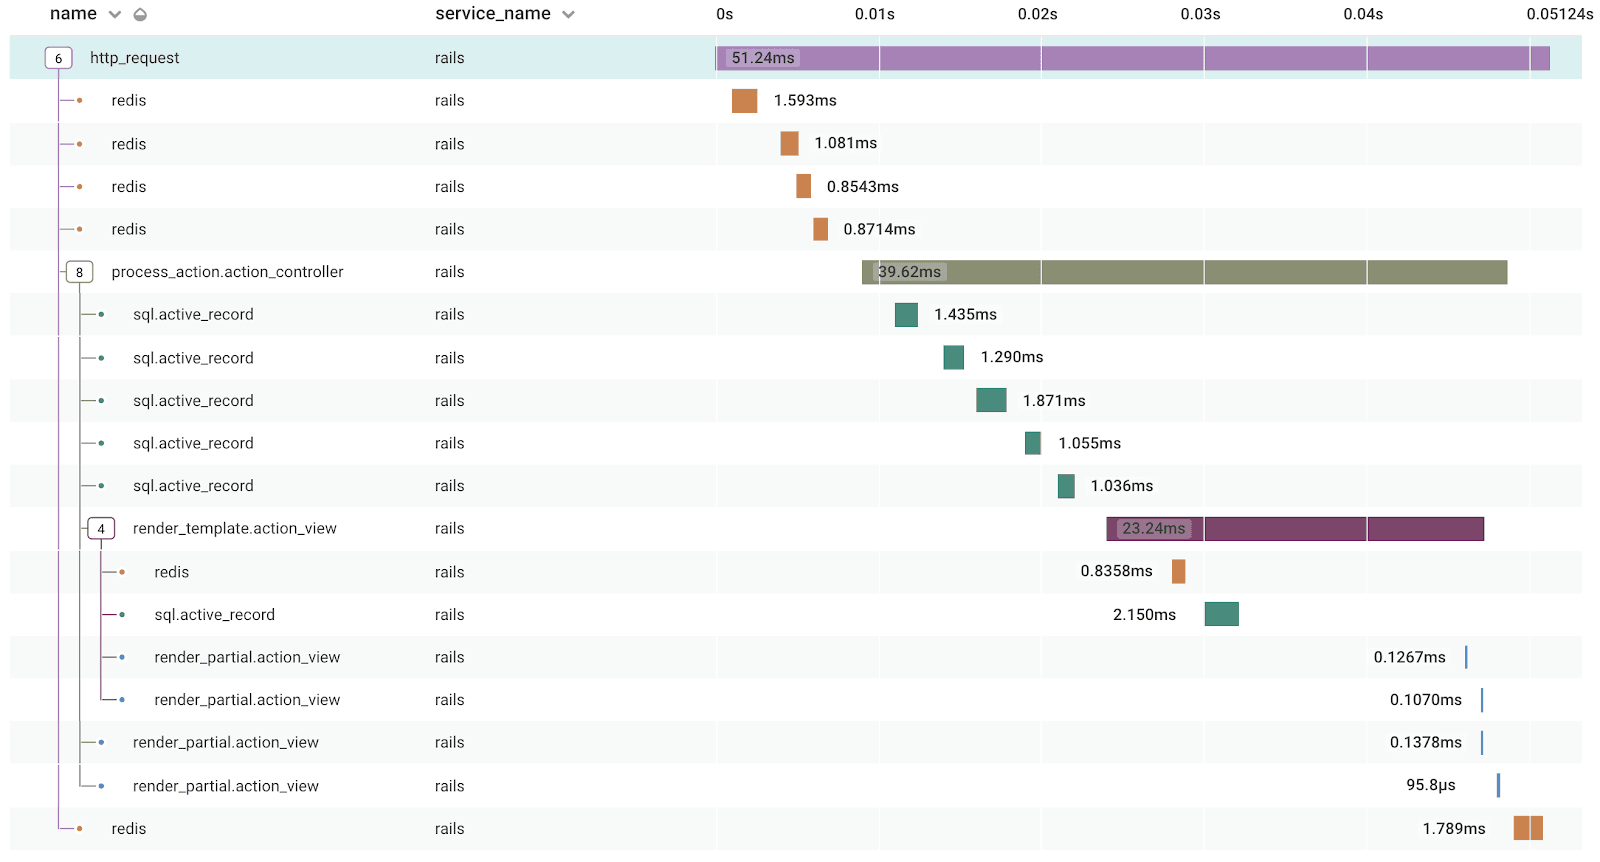
Still, the number of spans generated from one of your service’s events depends on the kind of event that is. In this example, an HTTP request using the ruby-beeline Rails integration, generated 18 spans. If you’re calling out to another service like Redis or S3, that will generate more spans.

Here’s the same HTTP request, fully expanded:
What to expect
There’s no magic number for the “proper” level of granularity in tracing. As you ramp up your use of Honeycomb, you’ll make discoveries that’ll guide how to further instrument your code. New Honeycomb users often discover long-hidden bugs and inefficiencies when they first instrument for tracing. Aim for higher granularity early on with the goal of learning, finding these inefficiencies, and nipping them in the bud.
So when you see a high-granularity trace with many spans, ask yourself, “Is this trace valuable?” It’s entirely in the eye of the beholder!
After this initial period of discovery, you’ll gain familiarity with what a normal trace looks like for various parts of your service. Going forward, you’ll be much more interested in the abnormal and better able to tune your instrumentation.
Let’s look back at our estimation formula from up above to figure out exactly what usage to expect:
(Number of your service’s events per month)
× (Number of spans in each service event)
_____________________________________________ = Honeycomb usage per month
Plugging in some numbers, let’s say your service gets around 1 million requests per day, or up to 30 million requests per month. If each request sends ~20 spans, then you’re looking at 600 million Honeycomb events per month. If each request sends ~50 spans, you’ll be sending 1.5 billion Honeycomb events per month.
Rather than worrying about storage size and retention periods, in this event-based world you’d be able to quickly ascertain what your usage needs are. In other posts, we cover more about how to think about observability costs and how to even further optimize your usage with techniques like dynamic sampling:
- We listened. Simpler Pricing. You’re welcome.
- How Much Should My Observability Stack Cost?
- Sweetening Your Honey
Have questions on how to get started? Want help estimating your event volume? Reach out to our team at support@honeycomb.io, or chat with us on Intercom (the chat bubble icon at the bottom right corner of the page).
Want to know more?
Talk to our team to arrange a custom demo or for help finding the right plan.