Level Up With Derived Columns: Understanding Screen Size (With Basic Arithmetic)
When we released derived columns last year, we already knew they were a powerful way to manipulate and explore data in Honeycomb, but we didn’t realize just how many different ways folks could use them.

By: Emily Nakashima
When we released derived columns last year, we already knew they were a powerful way to manipulate and explore data in Honeycomb, but we didn’t realize just how many different ways folks could use them. We use them all the time to improve our perspective when looking at data as we use Honeycomb internally, so we decided to share. So, in this series, Honeycombers share their favorite derived column use cases and explain how to achieve them.
Have a favorite derived column use case of your own? Send us a screenshot and description and we’ll send you something in the mail 🙂

What’s in a page size?
Most of our Honeycomb datasets contain data from our backend services and systems, but we have a few datasets we use for client-side data. The most interesting of these is our User Events dataset, which contains product analytics captured in customers’ browsers, like how often customers ran a query or how many created a new Board from the Query Builder vs. from the Boards page.
Each event we send from the browser has a “type” that tells us which interaction it represents, but the event is also enriched with a lot of context about the current page load. (We believe in the power of wide events with many fields, and we find that our client-side events are often even wider than the ones we send server-side.)
Some of the most useful context we can capture is information about the environment where our users are running our app. So, each time we send a page load event from the browser, we capture some context like the user agent (which will tell us the operating system and browser version) and the effective internet connection type (3G, DSL, cable…). We also capture the current window and screen height and width in pixels, so we can understand how much screen space is available as we design our UI:
{
    // Capture how large the user has made their current window
    window_height: window.innerHeight,
    window_width: window.innerWidth,
    window_size: window.innerHeight * window.innerWidth, // looks repetitive!

    // Capture how large the user's entire screen is
    screen_height: window.screen && window.screen.height,
    screen_width: window.screen && window.screen.width,
    screen_size: window.screen && (window.screen.height * window.screen.width) // also repetitive!

    // ...
}Fewer calories, same great taste (get the same info with less data)
But looking at window_size and screen_size, it’s a little silly to need to send those fields and store their data in Honeycomb — they are calculated entirely based on information we’re _already_ sending. Instead, we can just send the _height and _width fields, and use a Derived Column in Honeycomb to do the multiplication for us.
MUL($window_height, $window_width)
MUL($screen_height, $screen_width)This will let us do the same sorts of calculations we’d be able to do if we had sent those extra fields on the event. For example, here are heatmaps of window_height, window_width, and window_pixels, a derived column created using the first formula above.
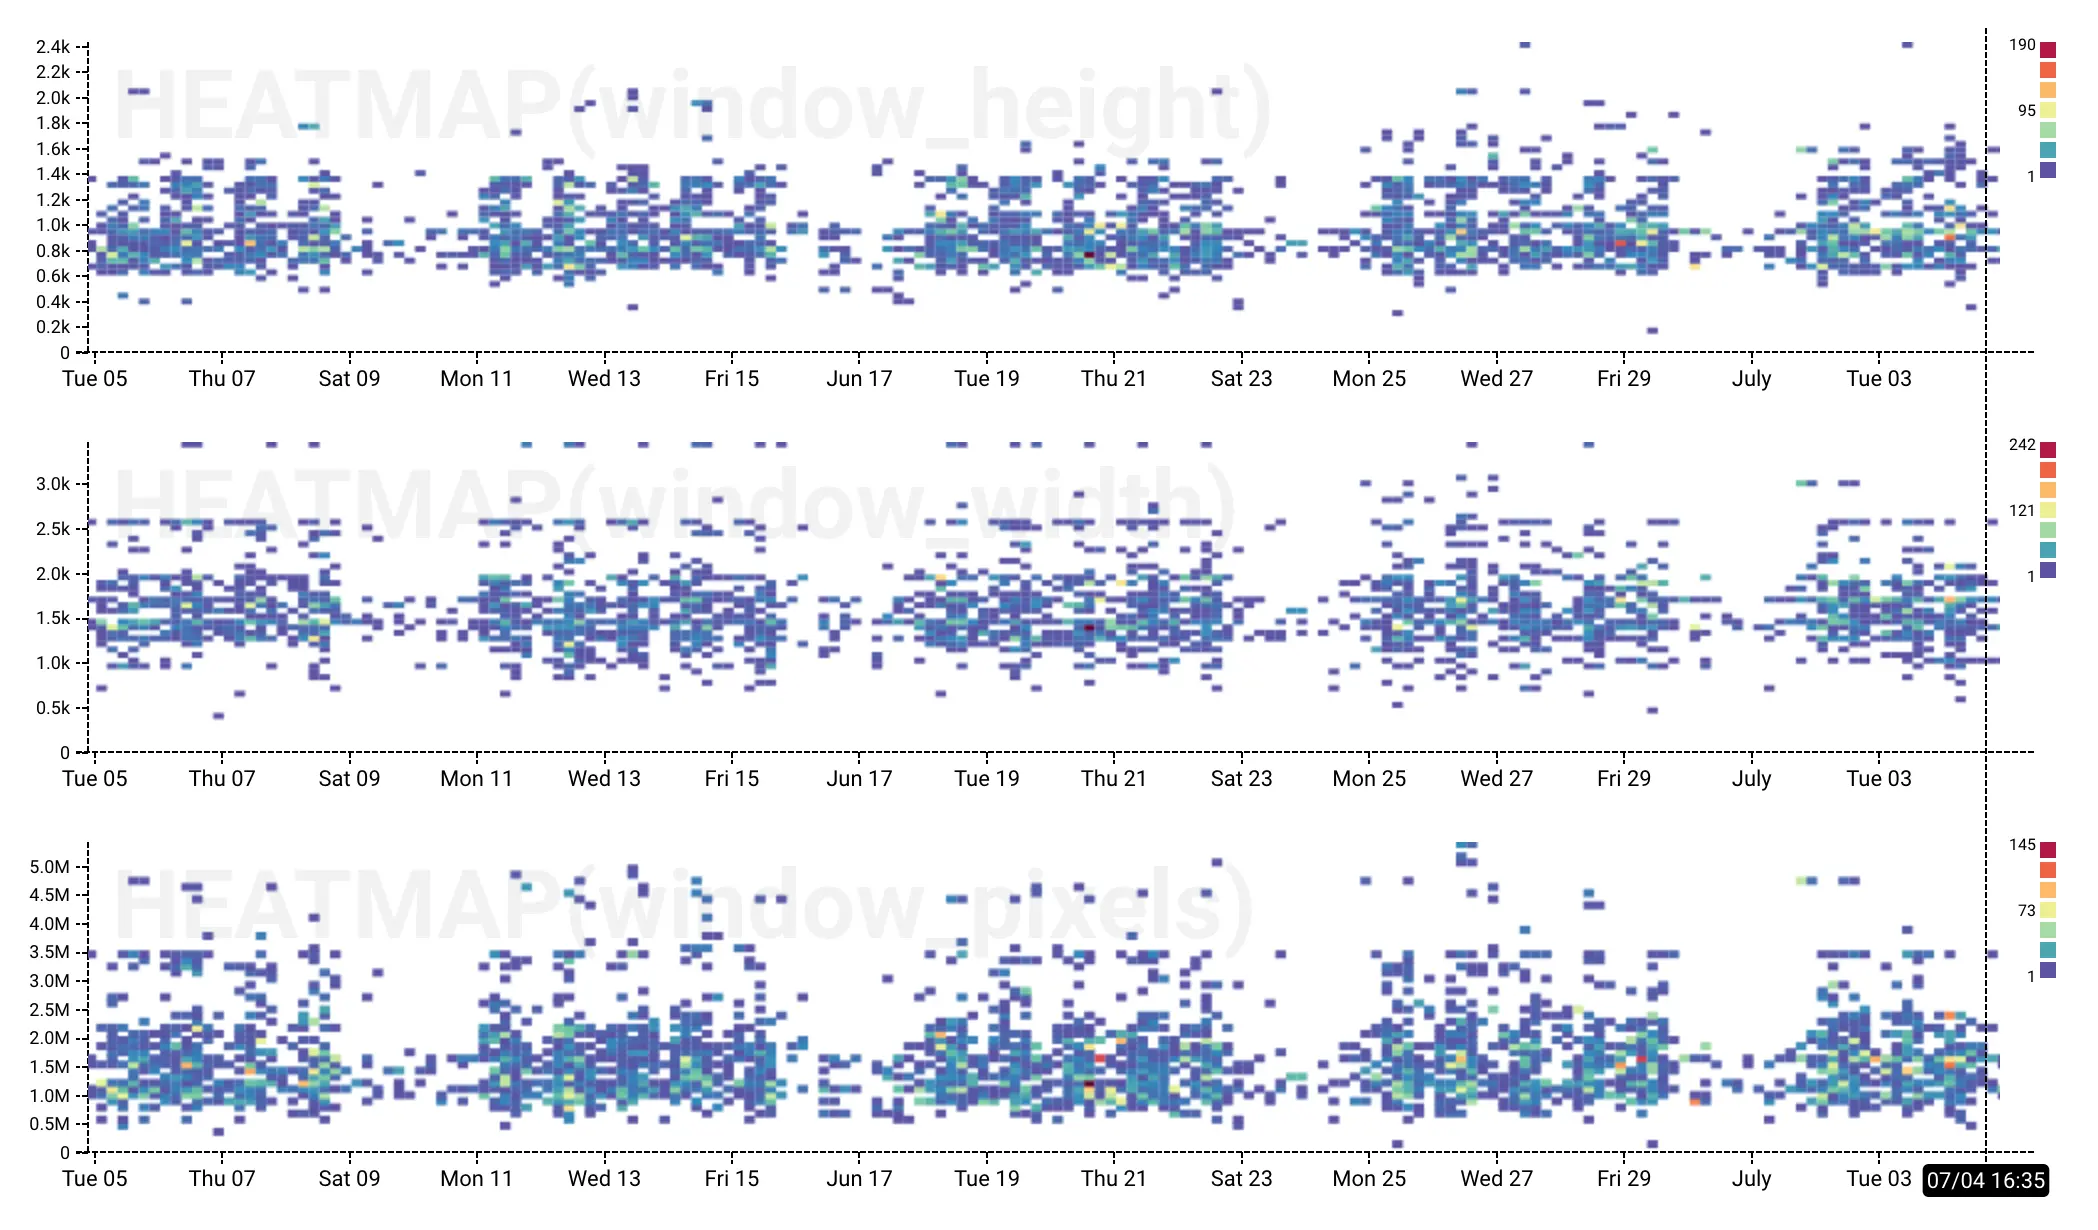
That’s handy. It lets us know what size most of our users have their browser windows set to, so we can make sure it matches our UI design assumptions.
Is there room to grow?
But what if we were thinking about making our pages taller or wider, or adding a UI element that might make the page more crowded across one dimension? Then we’d want to know, how does the _window_ size compare to the _screen_ size? Are users able to resize their browser window larger to see more content, or are they already maxed out? Derived columns to the rescue!
DIV(MUL($window_height, $window_width), MUL($screen_height, $screen_width))Derived columns support division, so we can calculate the ratio of window size to screen size. Here’s a heatmap of that calculated value (we call it screen_used):
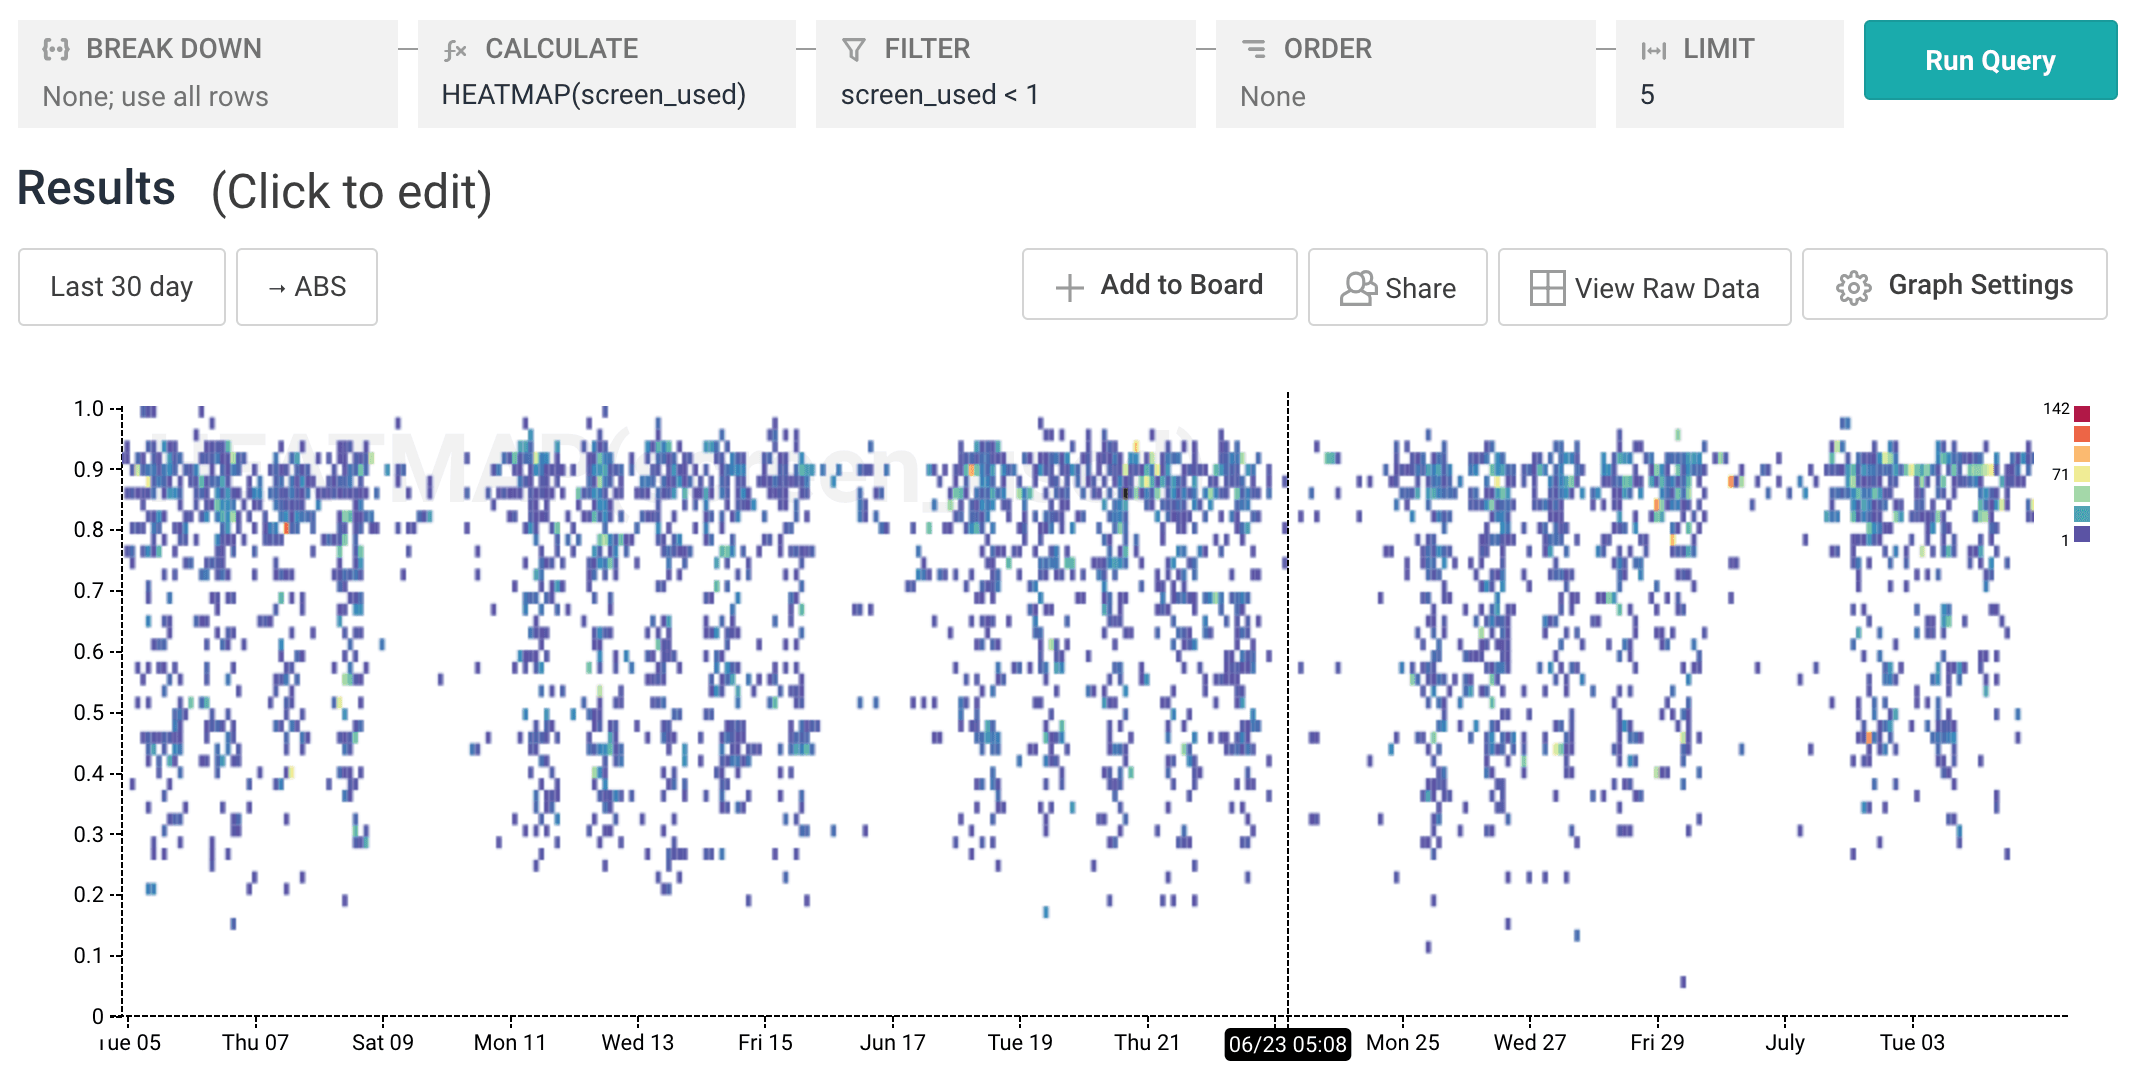
Bingo. The dots clustered toward the top of the distribution tell us that most users are already using the great majority of their screen when they view the site, so we probably shouldn’t size things up any further.
We can also see one more interesting fact: there seems to be some sort of natural limit on how big users can make their screens, since we have almost zero data points over 0.95. From that, we can guess that the most common browser & operating system combos have UI chrome that takes up about 5% of the page (we could verify this with a little research using our user agent strings, if we wanted to).
Other use cases for derived column arithmetic
Once we started using derived columns for doing a little math on our client-side data, we kept finding more & more use cases. For example, they are great for normalizing performance data that might be in seconds or milliseconds so we can compare the same units for everything. We just MUL(1000, $some_measurement_in_s) We also send lots of page load timings for different portions of the page load (DNS lookup, SSL handshake, asset download) and use the SUM function to add the timings into an overall page_load_dur_ms column.
As programmers, we know that duplicated data or logic is often a precursor to bugs — that’s why we talk about concepts like DRY (don’t repeat yourself) and SSoT (single source of truth) so often. Derived columns are a great way to help DRY up our instrumentation code and make sure the logic or data to calculate a piece of context only needs to live in one place.
Want to know how to do more derived column arithmetic? Learn about derived columns in our documentation, or sign up and give Honeycomb a try for yourself!
Want to know more?
Talk to our team to arrange a custom demo or for help finding the right plan.