OpenTelemetry: New Honeycomb Exporters
We’re really big fans of OpenTelemetry at Honeycomb. As we’ve blogged about before, OpenTelemetry is the next phase of the OpenTracing and OpenCensus projects. Instead of working on separate but similar efforts, those two…

By: Paul Osman

We’re really big fans of OpenTelemetry at Honeycomb. As we’ve blogged about before, OpenTelemetry is the next phase of the OpenTracing and OpenCensus projects. Instead of working on separate but similar efforts, those two projects have merged to create OpenTelemetry. This is wonderful for the larger community as it gives people a clear way to instrument their code for metrics and traces that isn’t specific to any tool or vendor. OpenTelemetry is a CNCF sandbox project.
The OpenTelemetry project consists of different components, including language specific SDKs and a collector that can be used to build metrics and tracing pipelines for your telemetry data. The project is heading towards beta very soon, so we wanted to take this opportunity to highlight two recent additions that make it possible to send traces to Honeycomb with OpenTelemetry!
OpenTelemetry Collector
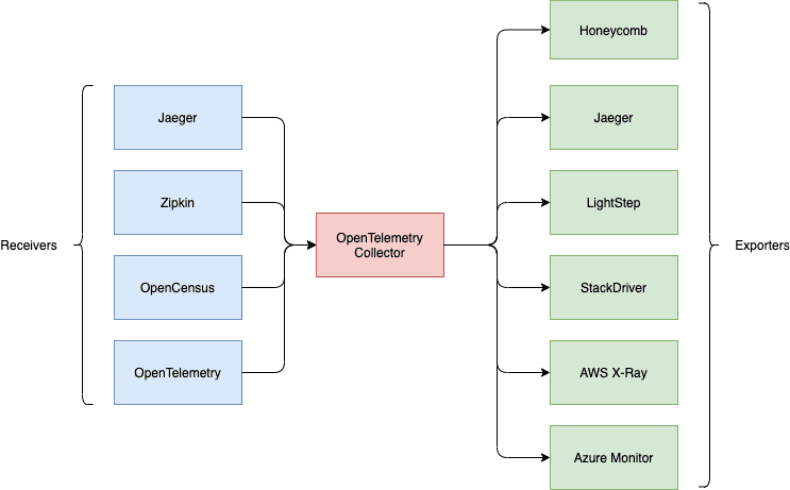
There’s now a Honeycomb exporter for the OpenTelemetry collector. This means it is possible to send trace data from any service instrumented with Jaeger, Zipkin, OpenCensus or OpenTelemetry to Honeycomb with zero code changes.
The OpenTelemetry Collector is designed to receive metrics and trace data in a variety of supported formats, optionally process that data, and export it to any supported backend provider. The collector can be run as an agent / sidecar, or as a separate service receiving data from multiple applications.
Because the collector can receive traces in a number of supported formats, it’s a great way to make use of existing code that has already been instrumented using an OpenTracing compatible format such as Jaeger or Zipkin, or existing standards like OpenCensus. Of course the collector will also support receiving metrics and traces in the OpenTelemetry format.
Our Head of Customer Success, Irving Popovetsky, put together a great video demonstrating the OpenTelemetry collector using the Hipster Shop microservices demo.
We think this is a big deal because it means a lot of people can now start using Honeycomb with zero code changes. If you have existing code instrumented with OpenCensus, Jaeger or Zipkin, and are able to run the collector in your infrastructure (as a sidecar or service) you’ll now be able to send us traces without making any changes to your instrumentation. What a great way to try out Honeycomb quickly!
Together with all vendor specific extensions, the Honeycomb collector is part of the opentelemetry-collector-contrib repo. As mentioned above, the collector is still in Alpha, but rapidly approaching Beta status. We expect that this will eventually replace the need for the existing Honeycomb OpenTracing Proxy. We’ll continue to support that project for the foreseeable future, but will focus future efforts on the OpenTelemetry exporter.
Python SDK Exporter
The OpenTelemetry project includes a number of language specific SDKs. If you are unable, or simply do not want to run the collector in your infrastructure, you can also use an SDK exporter to send trace and metrics data to a specific provider. These exporters require minimal code, so you only have to add a few lines at most to your OpenTelemetry instrumented application in order to start sending telemetry data directly to the provider of your choice.
The first SDK exporter we wrote was for Go, which makes sense since we’re mostly a Go shop here at Honeycomb. But I’m now happy to announce that we have a working SDK exporter for Python as well! Using an exporter in an application that is instrumented with an OpenTelemetry SDK involves adding a few lines to instantiate and register the exporter:
from opentelemetry import trace
from opentelemetry.ext.honeycomb import HoneycombSpanExporter
from opentelemetry.sdk.trace import TracerSource
from opentelemetry.sdk.trace.export import BatchExportSpanProcessor

trace.set_preferred_tracer_source_implementation(lambda T: TracerSource())

exporter = HoneycombSpanExporter(
service_name="test-service",
writekey=<HONEYCOMB_WRITEKEY>,
dataset=<HONEYCOMB_DATASET>,
)

trace.tracer_source().add_span_processor(BatchExportSpanProcessor(exporter))
tracer = trace.get_tracer(__name__)

with tracer.start_as_current_span('service_one'):
with tracer.start_as_current_span('service_two'):
print("Hello, from a child span")Because the SDK exporter is just responsible for shipping OpenTelemetry data to a provider, the actual code required to write one is quite minimal. The Python exporter was actually written by Liz Fong-Jones, our principal developer advocate, in a few hours to prepare for a workshop she was running! (The code may be fairly minimal, but this was still a pretty amazing feat – with a huge assist from Ben Hartshorne who wired up the setuptools config. Get yourself a team like that!).
Now that we have a Go SDK exporter and a Python SDK exporter, we’d like to prioritize other languages popular with our users. We also have a community contributed .NET Honeycomb exporter thanks to community contributor extraordinaire, Martin Thwaites!
We’re really excited that as OpenTelemetry gets closer to beta, users have more ways to use vendor neutral instrumentation with Honeycomb.
Want to know more?
Talk to our team to arrange a custom demo or for help finding the right plan.