
When the cool kids talk about interesting log data, no one seems to want to talk about nginx. Web servers are the workhorses of the internet, reliable and battle-hardened, but the logs are standard and never have anything of the interesting application metadata anyway.
But wait! Web logs are also often one of the easiest, broadest sources of data for systems at a high level—and are killer for answering questions like “Oops—I forgot to instrument my new feature, how much is its corresponding endpoint actually being hit?” or “Uh… how many req/sec is this service serving, really?”
There’s an almost infinite number of possible customizations given enough time and patience, but here are a couple quick wins we’ve found particularly essential:
- Request time (docs): Did you know that nginx can calculate start-to-finish times per request, right out of the box? Don’t leave the house without this one, folks: just add
$request_timeanywhere in yourlog_formatdirective. - Upstream response headers (docs): Tuck useful metadata from your application into your HTTP response headers, and tell nginx to pull
X-Whatever-You-Wantout into your logs.
Voilà! User IDs, database timers, and server metadata—right alongside high-level, granular data surrounding each request.
Let’s take a look at what that can tell us about a service:
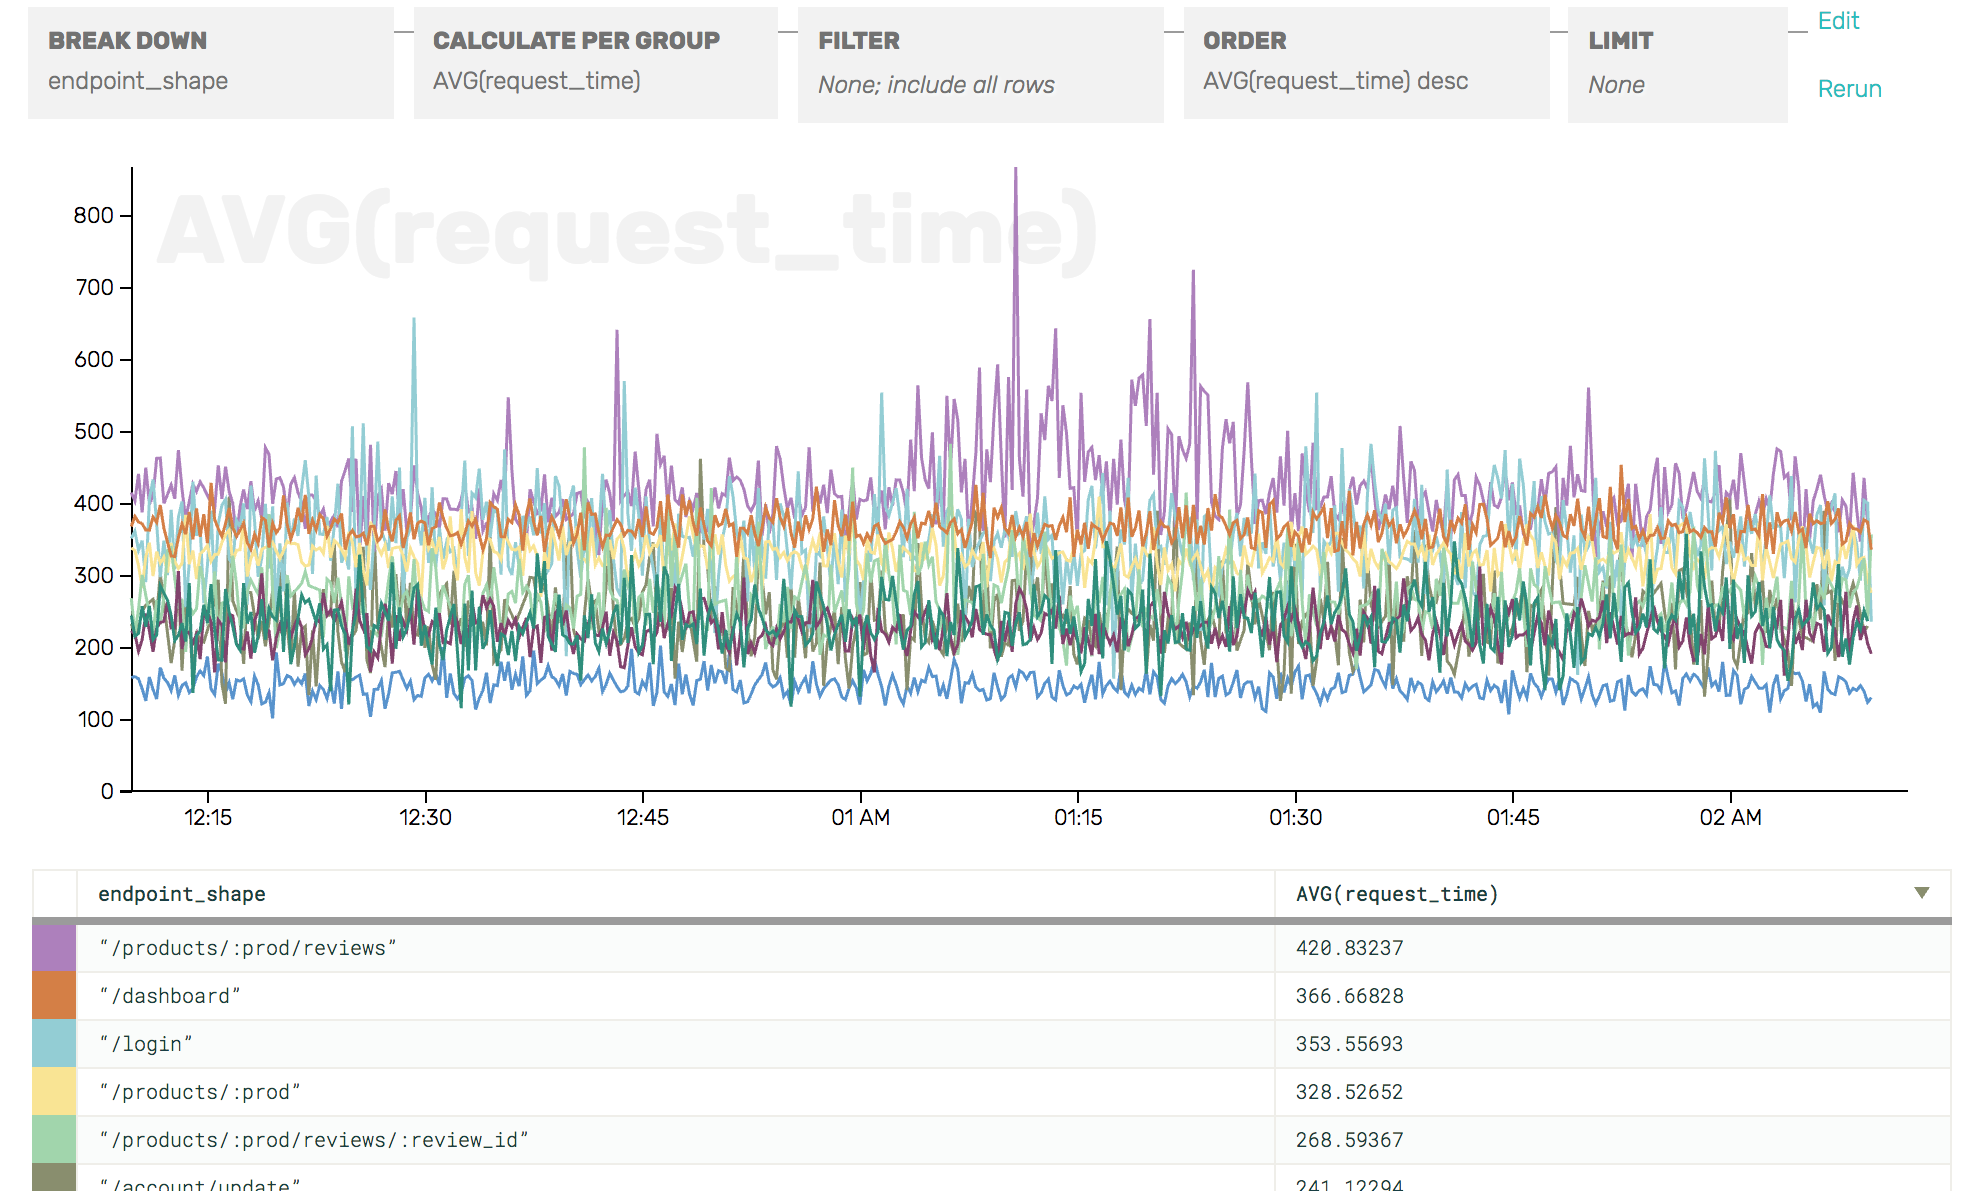
With just request_time and a header value generalizing the shape of the endpoint path (e.g. /products/foobarbaz → /products/:prod), we can see—incredibly quickly—which endpoints (not specific URLs!) are the slowest, or the most numerous, or causing the most load on my server.
Guess what else we can do with nginx?
Oops! you’ll have to wait for the next installment.
The sky’s the limit when it comes to slicing this birds’-eye view of your web traffic by arbitrary app metadata: ID the users seeing the most 404s, or graph load by availability zone, hostname, or database cluster! Read more about working with response headers here or sign up to give it a whirl today 🙂
Note: we talk about upstream response headers as a way to get normalized endpoint shapes, but our nginx connector can do that for you, too!