Unleash SaaS Data With the Webhookevent Receiver
There are many vendors, Honeycomb included, where actions on the application can emit a web request that goes to another service for coordination or tracking purposes. Many vendors have pre-built integrations, but some have a fallback that says “Custom Webhook” or similar. If you’re looking to create a full picture of your request flow, you would want these other services to show up in your trace waterfall.

By: Mike Terhar
Honeycomb & OpenTelemetry for in-depth observability
Learn MoreThere are many vendors, Honeycomb included, where actions on the application can emit a web request that goes to another service for coordination or tracking purposes. Many vendors have pre-built integrations, but some have a fallback that says “Custom Webhook” or similar. If you’re looking to create a full picture of your request flow, you would want these other services to show up in your trace waterfall.
Example: Outsourcing authentication to Auth0
If you look at Auth0’s integrations on their website, you’ll notice that Honeycomb sadly isn’t among them. However, thanks to a recent improvement in the webhookeventreceiver in OpenTelemetry, you can now configure a Collector to receive the webhooks and send them to Honeycomb.
Why didn’t this work before?
Auth0 offers the ability to stream logs via custom webhooks. The Collector has had a webhook event receiver for a long time, but early in its development, people sent multi-line JSON objects in the request body, which caused it to create multiple “logs” for a single request where the first log was just “{“ and the rest broken into lots of log records. This wasn’t what anyone wanted, so they changed it to pull the whole request into a single OpenTelemetry log record.
Auth0’s log streaming webhooks send payloads, which include multiple logs in the body, each separated by a newline character. This meant if a person did an action, it would be sent in a webhook to the Collector and get processed properly. If 30 people did an action, or one person did dozens of things, the emitted log record would be very long and include a lot of the same fields.
Even with OpenTelemetry tricks like the transform processor, there was no way to fix this in the pipeline. Each log that comes out of the receiver is a distinct thing—it can’t be merged or separated. One goes into the processor, one comes out.
Log streaming from Auth0 to OpenTelemetry
With PR #38042 and the release of 0.121, the webhookeventreceiver now supports a new config option:
receivers:
  webhookeventreceiver:
split_logs_at_newline: trueWhen enabled, this option tells the receiver to split the incoming payload at each new line, treating each line as a separate log entry—exactly how Auth0 structures its streamed logs.
What this means for you
- No need for custom parsing logic.
- Each Auth0 log is parsed and handled independently.
- Better observability and cleaner logs in your pipeline.
All you have to do is configure an OpenTelemetry Collector with this receiver and give it an ingress route. Since it will take telemetry from outside your network, I suggest deploying a distinct one that only handles webhook requests from Auth0 rather than adding this configuration to an existing deployment.
Set up the Collector in a Kubernetes cluster
kubectl create ns auth0collector
kubectl config set-context --current --namespace=auth0collector
helm repo add open-telemetry https://open-telemetry.github.io/opentelemetry-helm-chartsCreate the Honeycomb API Key as a secret.
kubectl create secret generic honeycomb --from-literal=api-key=hcaik_BLAHBLAHBLAHWhen creating the OpenTelemetry Collector values file, we need a few things:
- Use an image with the receiver and include the Honeycomb API key
- Configure the receiver to get events
- Configure the pipeline to parse out the fields
- Configure the exporter and pipeline to send data to Honeycomb
- Ingress to route traffic from Auth0 to the Collector
1. Helm chart configurations
mode: deployment

image:
  repository: ghcr.io/open-telemetry/opentelemetry-collector-releases/opentelemetry-collector-contrib
  tag: 0.125.0

command:
  name: otelcol-contrib

extraEnvs:
  - name: HONEYCOMB_API_KEY
    valueFrom:
      secretKeyRef:
        name: honeycomb
        key: api-key
  - name: COLLECTOR_POD_NAME
    valueFrom:
      fieldRef:
        fieldPath: metadata.name

replicaCount: 12. Configure the receiver
config:
  receivers:
    webhookevent:
      endpoint: "0.0.0.0:8080"
      path: "/v1/webhook"
      line_break_split: true
      required_header:
        key: "authorization"
value: "Bearer blah:blah2"3. Configure the transform processor to convert JSON strings into attributes
config:
  [. . .]
  processors:
    transform/add-auth0-k8s-source:
      error_mode: ignore
      log_statements:
        - context: log
          statements:
            - set(attributes["auth0.k8s.source"], "${env:COLLECTOR_POD_NAME}")
    transform/unpack-flatten-string:
      error_mode: propagate
      log_statements:
        - context: log
          statements:
            - merge_maps(cache, ParseJSON(body), "upsert") where IsMatch(body, "^\\{")
            - flatten(cache, "", 4)
- merge_maps(attributes, cache, "upsert")4. Configue the exporter and pipelines
config:
  [. . .]
  exporters:
    otlp/auth0:
      endpoint: "api.honeycomb.io:443" # US instance
      #endpoint: "api.eu1.honeycomb.io:443" # EU instance
      headers:
        "x-honeycomb-team": "${env:HONEYCOMB_API_KEY}"
        "x-honeycomb-dataset": "auth0-logs"

service:
    pipelines:
      traces: null
      metrics: null
      logs:
        receivers: [ webhookevent ]
        processors:
          - memory_limiter
          - transform/add-auth0-k8s-source
          - transform/unpack-flatten-string
          - batch
exporters: [ otlp/auth0]When configuring pipelines, the memory_limiter and batch processors are configured in the Helm chart’s processors block so we don’t have to redefine them. They’re part of a nested object so it’s merged in by Helm.
With the logs pipeline, on the other hand, each of the pipelines is an array so all of the objects in the array are replaced by what you put in your included values. This means we have to respecify the memory_limiter and batch processors for any of the default pipelines we want to use.
5. Configure ingress to let traffic from Auth0 into the collector
This configuration uses Amazon ALB Ingress Controller so the annotations are configured to wire up a TLS certificate and DNS.
ingress:
  enabled: true
  ingressClassName: alb
  annotations:
    kubernetes.io/ingress.class: alb
    alb.ingress.kubernetes.io/certificate-arn: arn:aws:acm:us-east-1:xxxxxxxxxxxxxx:certificate/xxxxxxxxxxxxxxxxxxxxx
    alb.ingress.kubernetes.io/scheme: internet-facing
    alb.ingress.kubernetes.io/target-type: ip
  hosts:
    - host: "auth0-otel-webhook-receiver.mydomain.com"
      paths:
        - path: /
          pathType: Prefix
          port: 8080
  tls:
    - hosts:
        - "auth0-otel-webhook-receiver.mydomain.com"
secretName: auth0-otel-webhook-receiver-tlsTesting the webhook receiver with curl
curl -X POST https://auth0-otel-webhook-receiver.mydomain.com/v1/webhook -H "Authorization: Bearer blah:blah2" -H "Content-Type: application/json" --data-binary '{"message": "Hello, World!"}'What shows up at Honeycomb:
auth0.k8s.source: 10.0.210.175
body: {"message": "Hello, World!"}
flags: 0
library.name: otlp/webhookevent
library.version: 0.119.0
meta.signal_type: log
receiver: webhookevent
severity: unspecified
severity_code: 0
source: webhookeventAny minor configuration changes:
helm upgrade my-opentelemetry-collector open-telemetry/opentelemetry-collector -f otel-webhook-receiver.yaml --debug --waitConfiguring Auth0 to send to the webhookeventreceiver
In your Auth0 configuration dashboard, you should have a section for Monitoring, and below it, Log Streams.
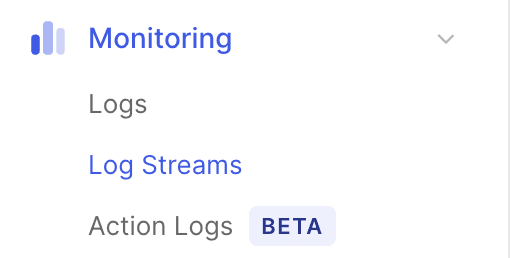
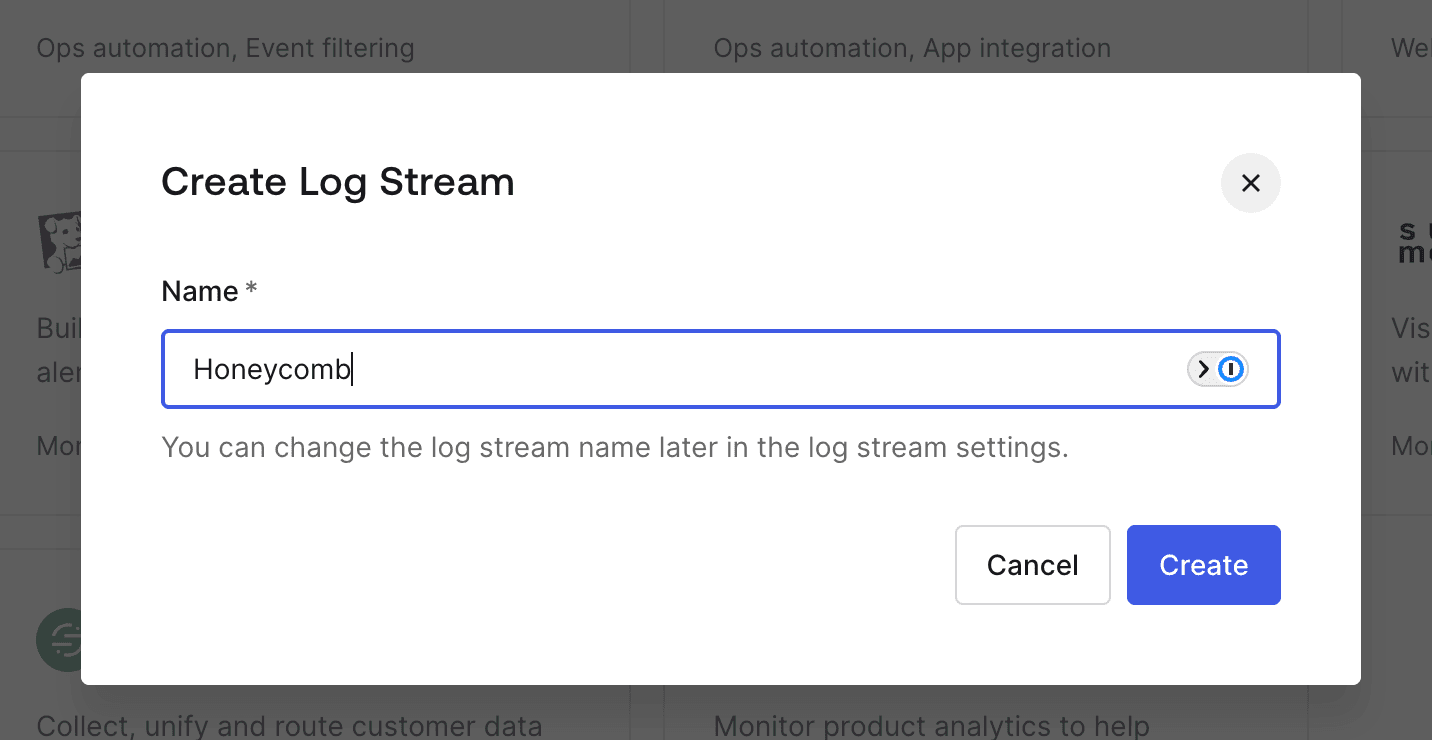
Click Create Log Stream to make a new one.
Name it “Honeycomb” (or something cooler).
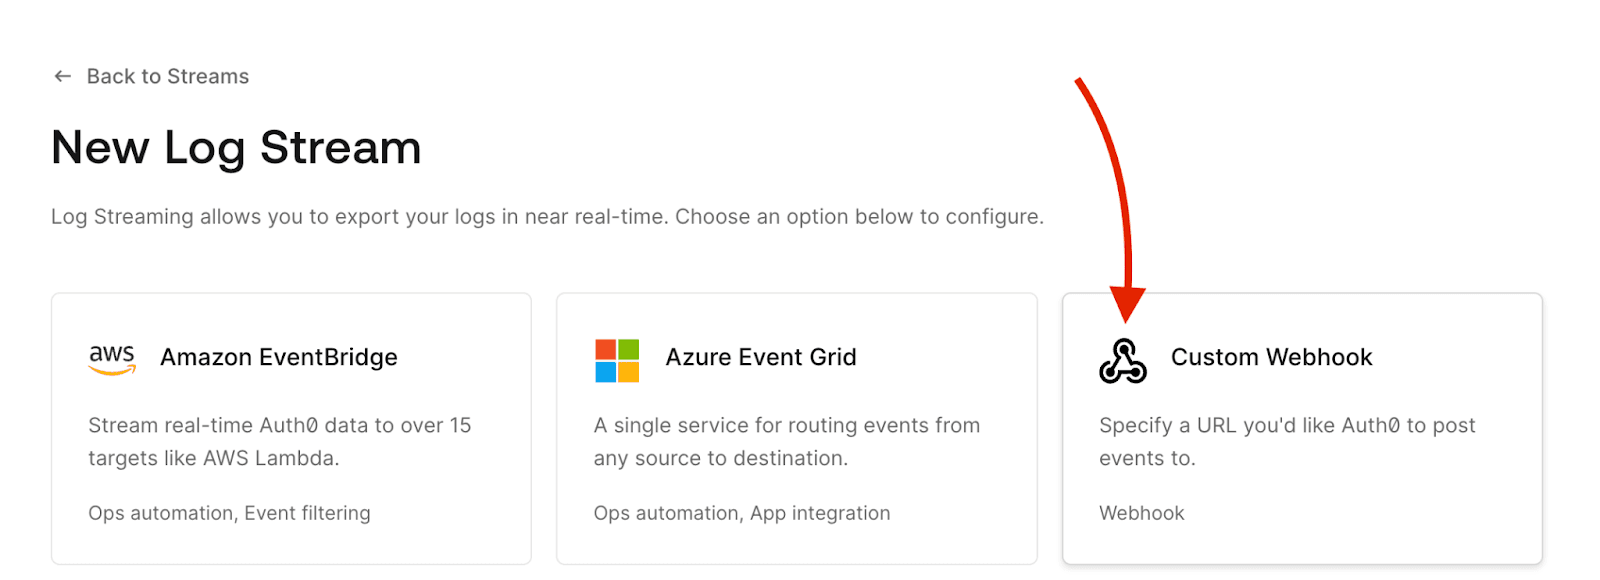
Set up the webhook with the following configuration:
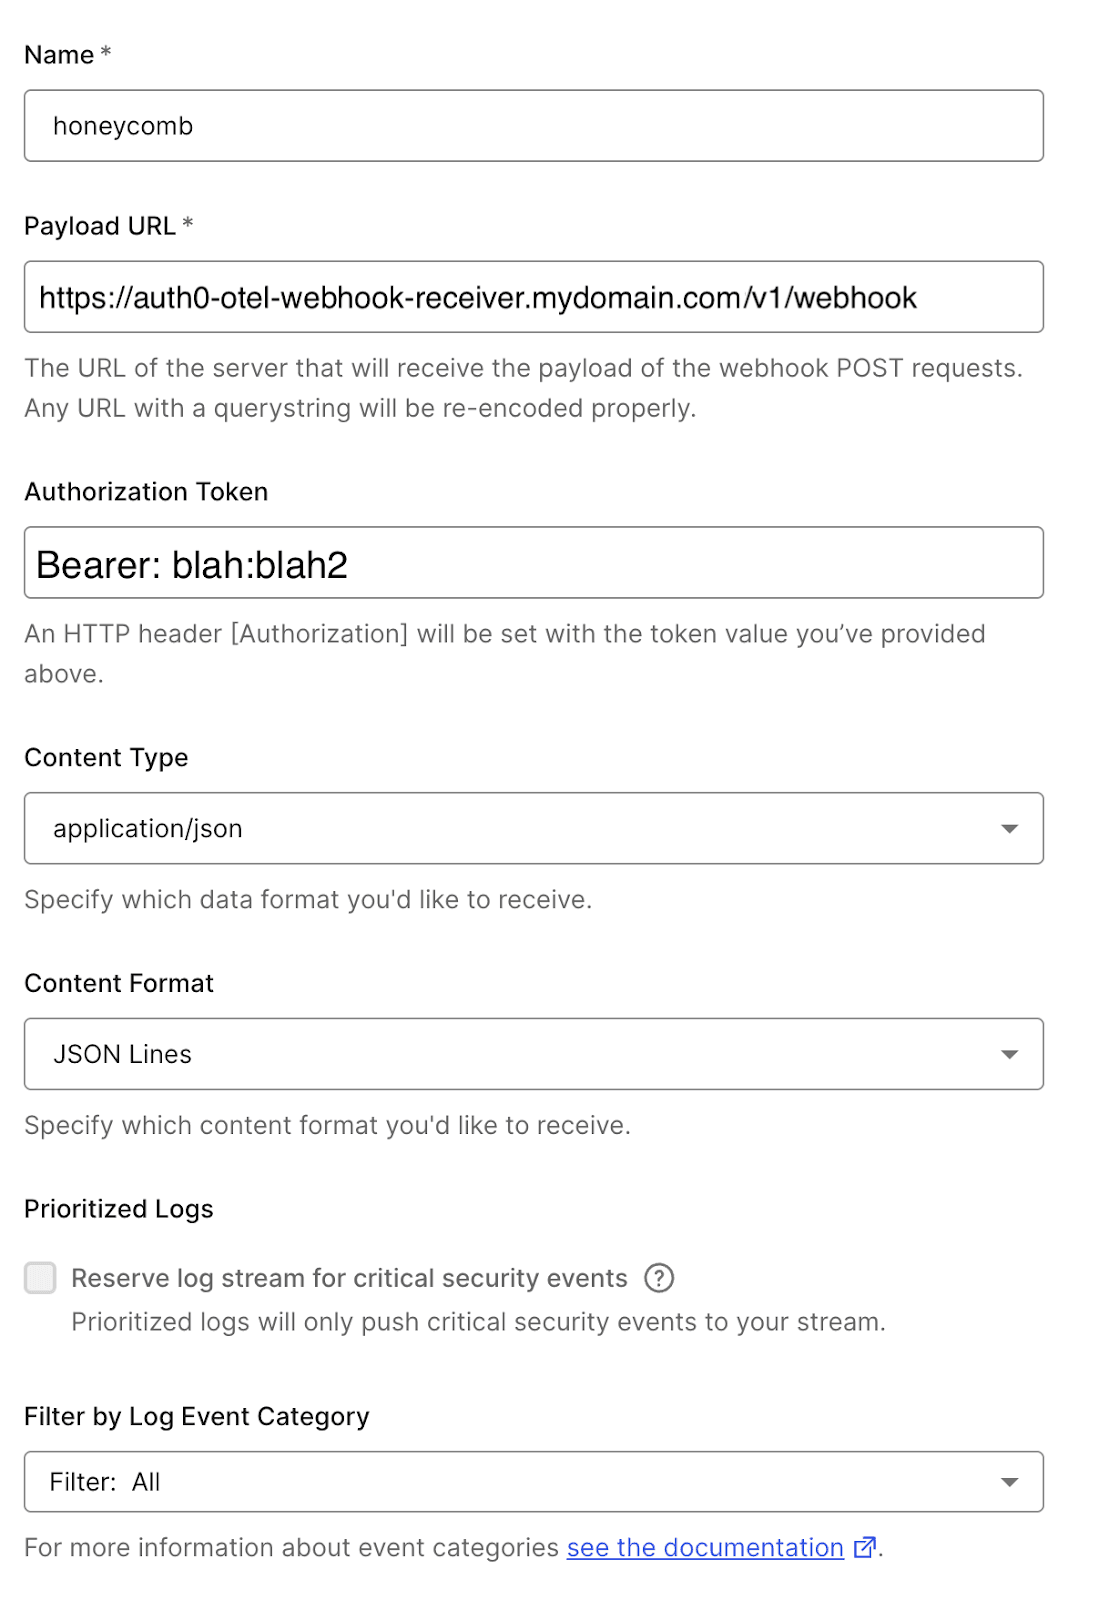
For the Authorization Token, it needs to include the Bearer part of the string that was set in the Collector configuration.
Set the Content Format to JSON Lines. The alternatives will format the body a bit differently, which can lead to receiver or attribute parsing failures.
You can go over to the test tab to validate that it works. If you’re not seeing errors, check Honeycomb for some juicy new events.
What you see in Honeycomb
When the Collector parses the raw logs as configured above, it will parse the body into JSON and then add them to the event. Emptying the body field may help with costs and clutter, but the example above leaves the body field intact so you can see both.
The most useful fields are:
- data.description
- data.details.request.auth.user.name and …email
- data.details.response.statusCode
- data.details.request.path
It also appears to be smart enough to omit things like the JWT or other sensitive fields.
Setting the severity
In Honeycomb, we would expect these logs to go to a dataset where no other logs are going. Because the feed is going through OpenTelemetry, there is a severity field that exists on the logs and it’s always set to unspecified.
If you would like to enhance the Collector to set the severity, it can be done using the transform processor. The easier way is to create a Derived Column in Honeycomb that displays “error” or “info” based on data.details.response.statusCode.
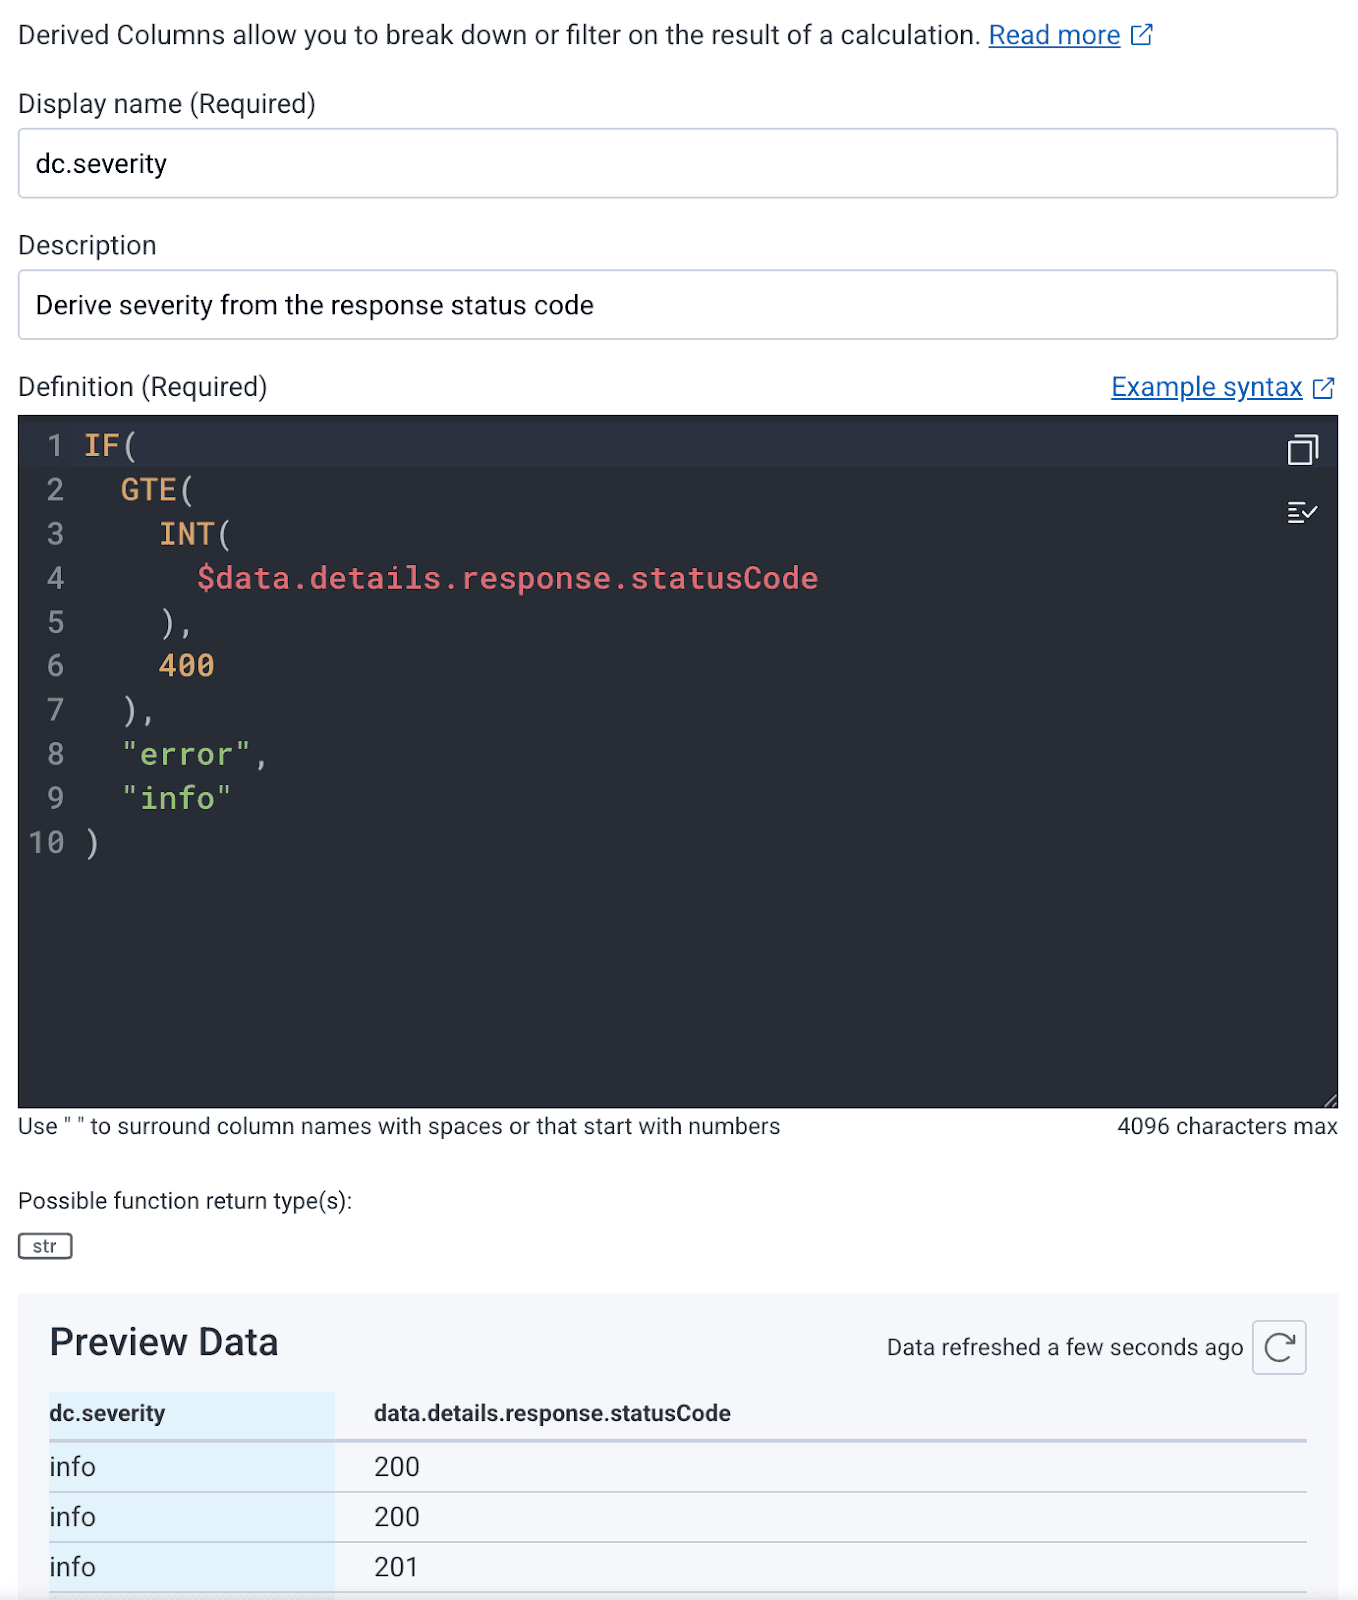
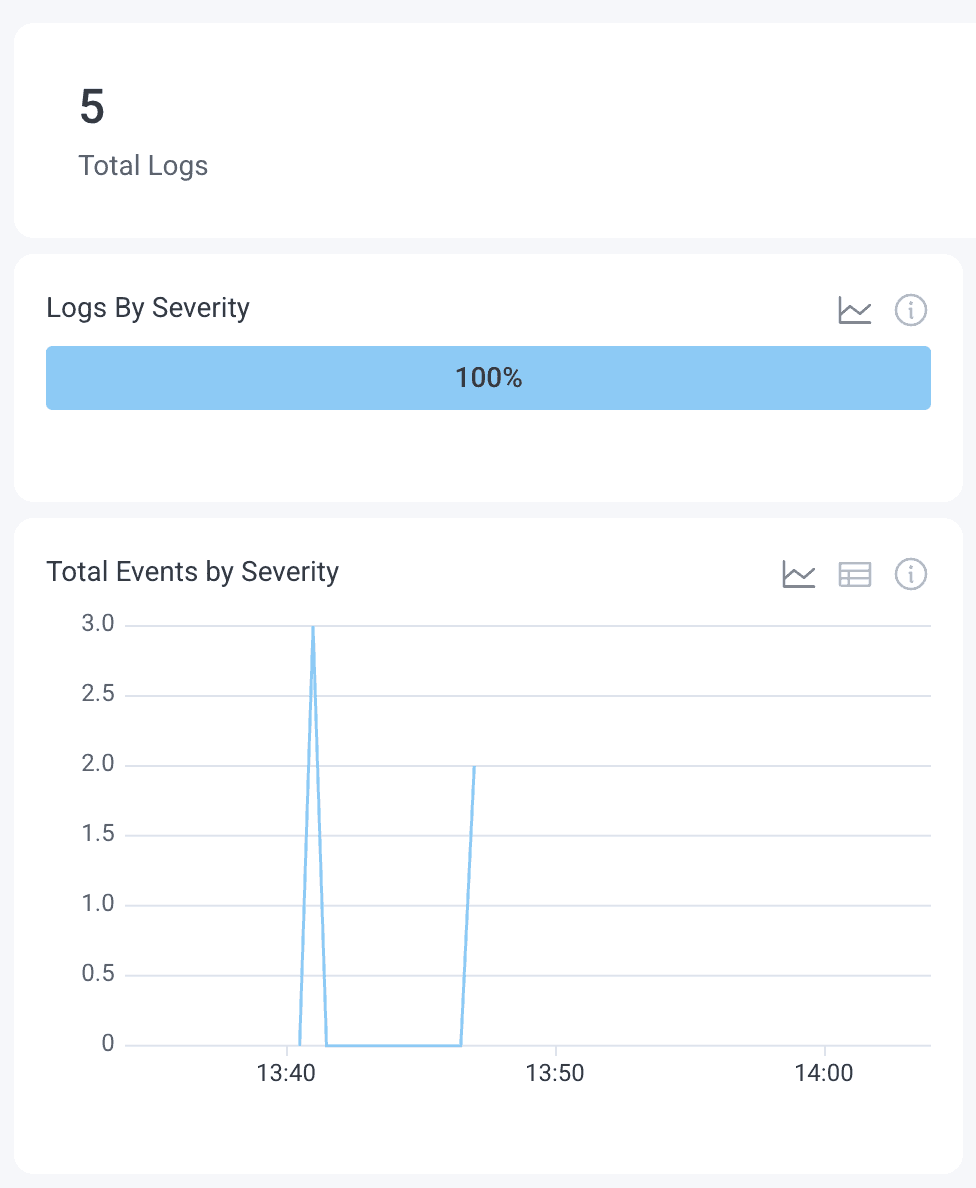
I suggest using dc.severity so you can differentiate it from the OpenTelemetry-supplied column. Set the formula to IF( GTE( INT( $data.details.response.statusCode ), 400 ), "error", "info" ) and your home screen’s log tab will show proper responses. In my testing, I didn’t have any errors or issues so the screenshot is a bit boring.
Now that you have the data in Honeycomb, you can also create triggers or SLOs based on the availability or other aspects of user activity.
Observing authentication
The ultimate goal is to be able to catch things before users open a support ticket or share issues on social media. Any time a request crosses organizational boundaries, it can be difficult to get a cohesive view of everything that’s happening. With this integration, you can now correlate the Auth0 activities with application traces in Honeycomb.
To close the last gap, you can add an X-Correlation-ID header in your API calls to Auth0 and it will reflect them in the body of the webhooks that hit your Collector. They’re attached under resources.correlation_id.
When initiating the API call to Auth0, you can take the current Trace ID and Span ID and assemble them into a traceparent-looking string with “00-” + traceID + “-” + spanID + “-01”. When the log line hits the Collector, we can unpack this using the transform processor:
transform/correlation-id:
    error_mode: ignore
    log_statements:
    - context: log
      conditions:
        - attributes["references.correlation_id"] != nil and Len(attributes["references.correlation_id"]) > 51
      statements:
        - set(attributes["trace.trace_id"],  Substring(attributes["references.correlation_id"], 3, 32))
        - set(attributes["trace.parent_id"], Substring(attributes["references.correlation_id"], 36, 16))
        - set(attributes["trace.span_id"], Substring(SHA1(attributes["references.correlation_id"]), 1, 16))
        - set(attributes["meta.annotation_type"], "span_event")
        - set(attributes["duration_ms"], 0)
- set(attributes["name"], "auth0 webhook")Note that it’s also adding the meta.annotation_type, duration, and name so that the dataset will be flagged on for trace data and the span events will pop into the waterfall view as little circles on the parent spans.
Webhooks and transforms are quite powerful
While this solution requires deploying a Collector and managing a set of configurations that are pretty specific, it does afford a new layer of visibility to the developers who rely on Honeycomb. Any time you can add a third party to your internal tracing tool, it allows a much clearer view of how they are impacting your users. For better or worse, it’s good to be able to detect these integration points and react to them degrading or breaking without switching tools.
There are many other products out there that can integrate with webhooks. If you find one that is interesting and get it working, come share in Pollinators! If it’s not working right, come by and we can take a look.
Want to know more?
Talk to our team to arrange a custom demo or for help finding the right plan.