Updates to the Java Beeline: Sweeter Than Ever Before
We’ve released some improvements to our Java Beeline library! Allow me to share all the interesting new features. Hot topics: Spring Boot Sleuth Starter, JDBC auto-instrumentation, Simplified Beeline Builder, W3C and AWS trace header propagation.

By: Mike Goldsmith
We’ve released some improvements to our Java Beeline library! Allow me to share all the interesting new features.
Hot topics:
- Spring Boot Sleuth Starter
- JDBC auto-instrumentation
- Simplified Beeline Builder
- W3C and AWS trace header propagation
Spring Boot Sleuth Starter
Sleuth is a popular Spring framework used to generate distributed tracing data for Java applications. With our new beeline-spring-boot-sleuth-starter package, it’s super easy to send Sleuth trace data to Honeycomb!
Import our new package and set a couple of application.properties entries, and you’re good to go!
Gradle:
implementation 'io.honeycomb.beeline:beeline-spring-boot-sleuth-starter:1.1.1'Maven:
<dependency>
    <groupId>io.honeycomb.beeline</groupId>
    <artifactId>beeline-spring-boot-sleuth-starter</artifactId>
    <version>1.1.1</version>
</dependency>application.properties:
honeycomb.beeline.writeKey=my-write-key
honeycomb.beeline.dataset=my-datasetAnd that’s it!
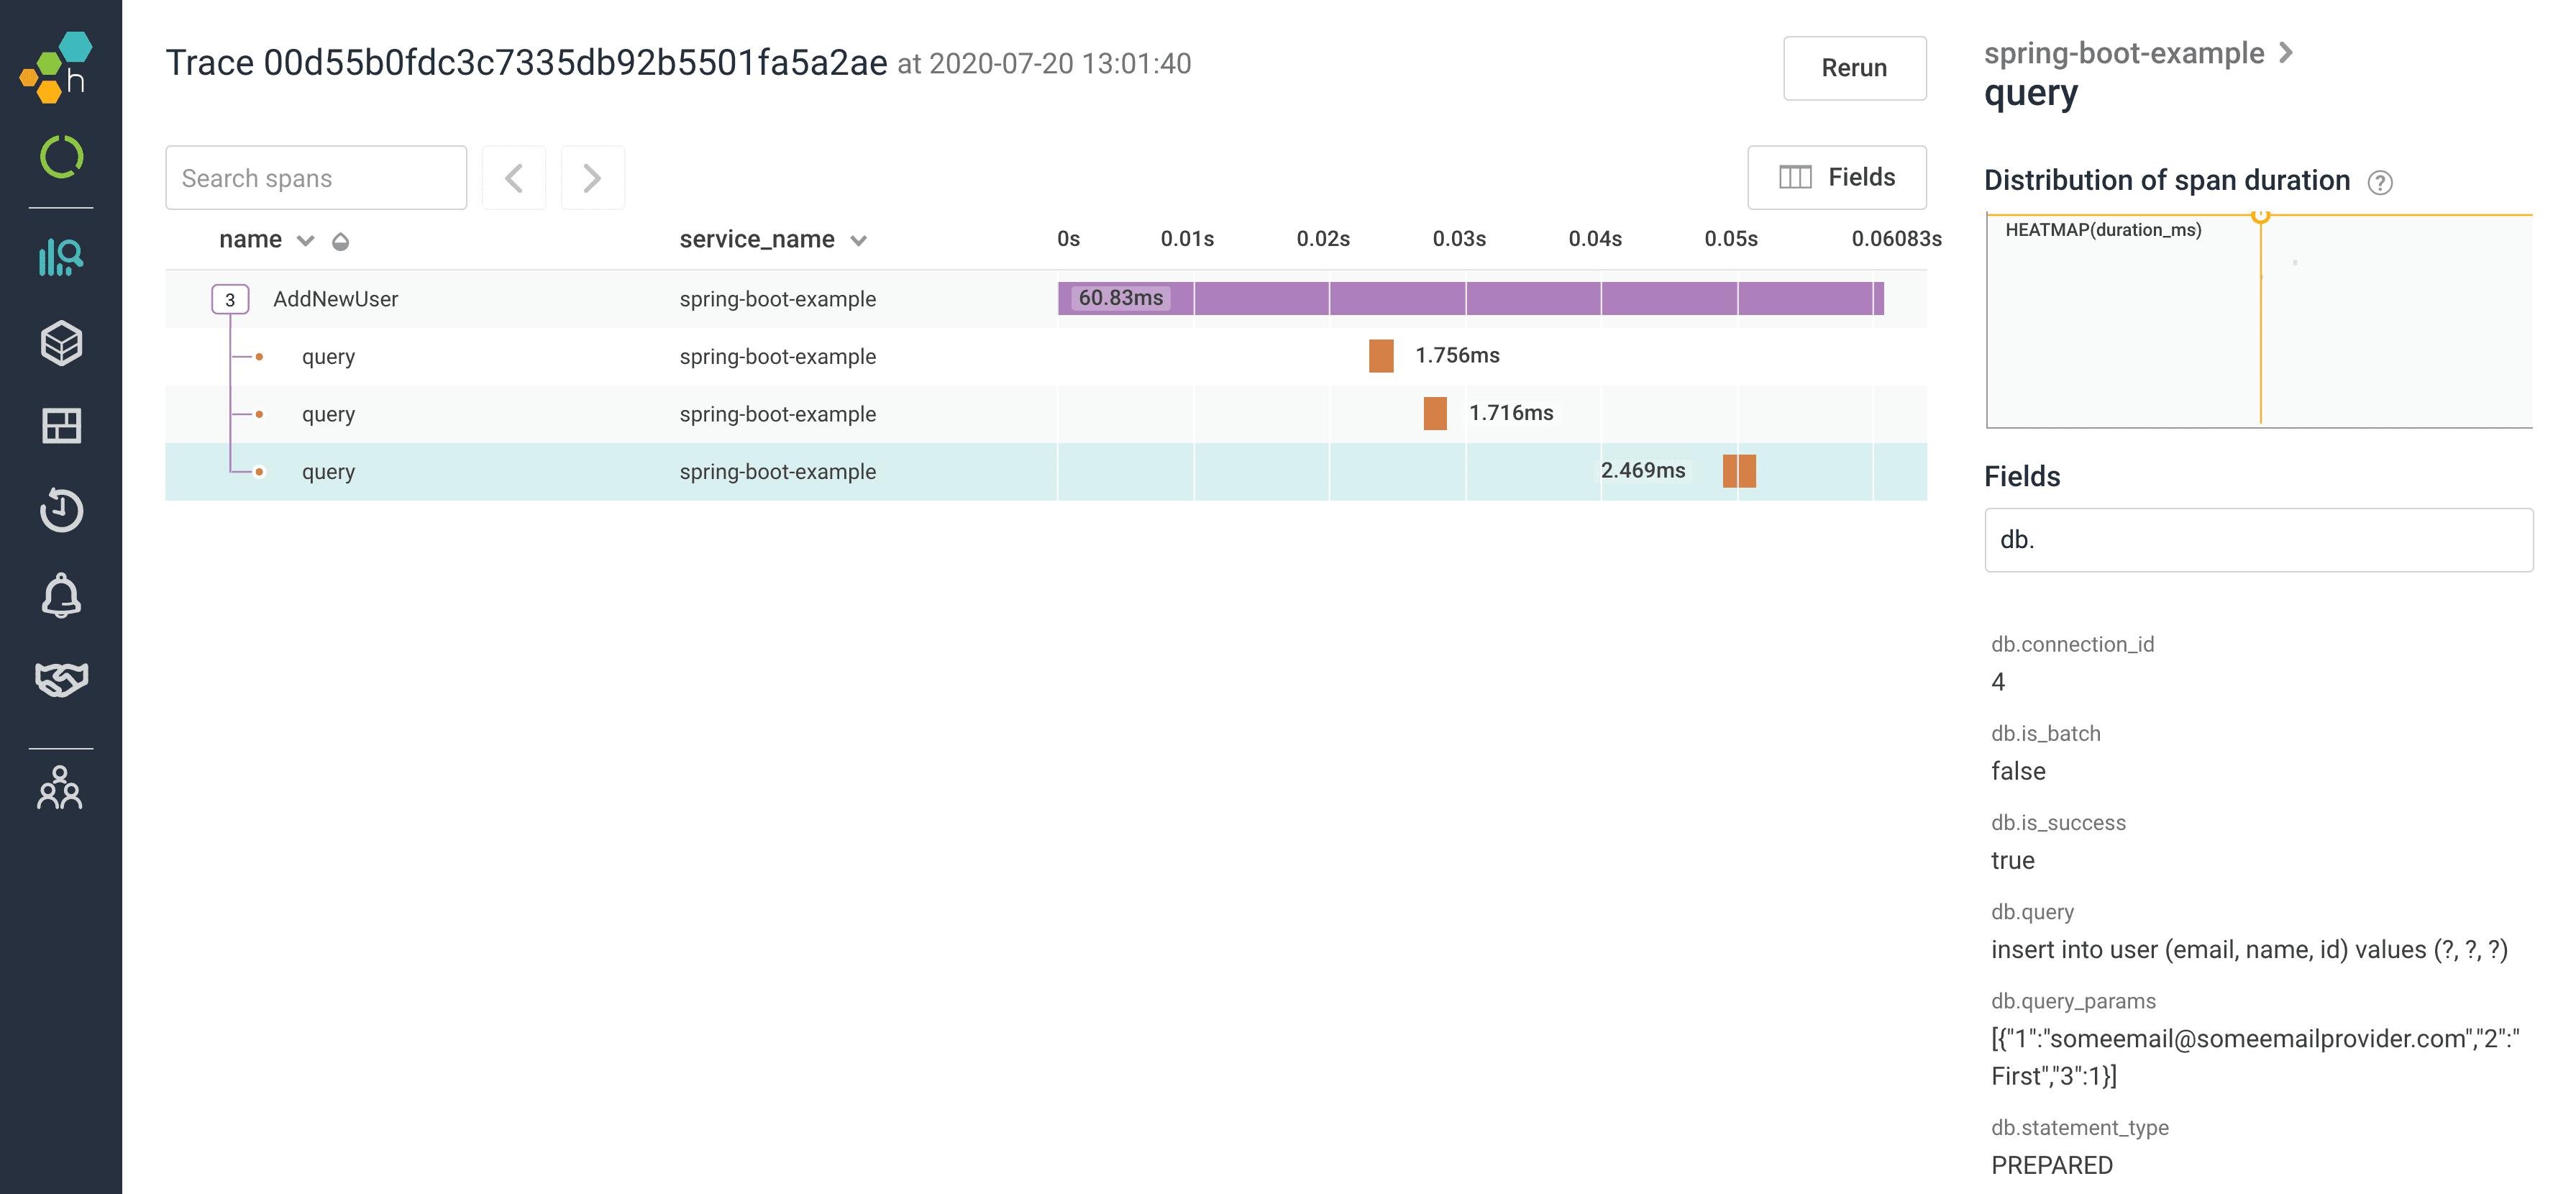
JDBC auto-instrumentation
We have extended our auto-instrumentation in the Java Beeline to trace JDBC queries–upgrade your Beeline version to enable it. Traced queries include:
- DB connection ID
- statement
- parameters
- duration (in milliseconds)
- any error information, if the query failed
and more.
Below is an example of an HTTP endpoint that makes a query, all visualized within Honeycomb:
Simplified Beeline Builder
We’ve added a BeelineBuilder utility to help streamline user configuration between the Beeline and the HoneyClient. This reduces the lines of code required to create and configure a Beeline in your application. We’ve also included an enhanced API for adding proxies.
Add these lines to your application startup:
final BeelineBuilder builder = new BeelineBuilder();
builder.dataSet("my-dataset").writeKey("my-write-key");
final Beeline beeline = builder.build();And this is how you add proxies to the builder:
builder.addProxy("https://myproxy.example.com");DefaultBeeline also supports passing in the builder along with your application name for easier management:
final DefaultBeeline beeline = DefaultBeeline.getInstance(builder, "my-app");W3C and AWS trace header propagation and beyond
Trace propagation is used to pass key trace information between processes so that events generated across multiple processes can be compiled into a single trace. Typically this includes a trace ID and the parent event ID, and can optionally include extra information, e.g. a Honeycomb dataset name.
There are many different formats of trace propagation outside of Honeycomb’s and we’re expanding the HTTP formats that our Beelines support. Two popular HTTP trace formats are W3C and AWS, and adding support for them means the Beelines can receive and send traces from sources that are not instrumented using a Honeycomb SDK. This allows teams to more easily switch services over to Honeycomb incrementally, rather than having to change them all at once.
The new trace propagators are now in the Beeline, and we’ll be adding more configuration functionality in later releases. Watch this space for more updates.
Learn more about the benefits of observing your code from development to production–download the Observability for Developers white paper today.
Want to know more?
Talk to our team to arrange a custom demo or for help finding the right plan.