In the old days, the most senior members of an engineering team were the best debuggers. They had built up such an extensive knowledge about their systems that they instinctively knew the right questions to ask and the right places to look. They even wrote detailed runbooks in an attempt to identify and solve every possible issue and possible permutation of an issue.
But, today’s modern systems rarely fail the same way twice. That extensive knowledge still matters, but it can’t prepare you to quickly understand every possible new and novel failure mode in a complex system. You can’t instinctively know all the right questions to ask and all the right places to look, so a new approach to debugging is necessary. That’s where observability and Honeycomb come in.
In this blog, I’ll dive into debugging with the Core Analysis Loop, the functional requirements for a backend datastore that make this possible, and whether it makes sense to build or buy your own observability solution. If these topics sound familiar, it’s because they’re chapters 8, 15, and 16 from our new O’Reilly Book: Observability Engineering Achieving Production Excellence! We discussed them in our interactive Authors’ Cut webinar and I’ll recap the highlights here.
Remember the scientific method?
In a world where the most senior engineers have a mysteriously magical touch for knowing the exact right questions to ask and the right places to look when debugging issues, what we’re doing is debugging from known conditions. Based on how this system has broken in the past, we divine solutions to problems that might occur in the future. If your system is static and simple enough, that methodology still works. But in a world of modern complex systems, troubleshooting by intuition simply isn’t serving most teams anymore.
Instead, managing modern complex systems requires us to debug from first principles. And that looks a lot like the scientific method we learned in middle school. It’s a methodology to systematically probe, observe, and scientifically take one step after another to follow clues and find answers. The best part is, anyone who has any level of familiarity with your system is able to follow the steps to debug and solve issues—you’re no longer reliant on the magical divining powers of your most senior engineers to help.
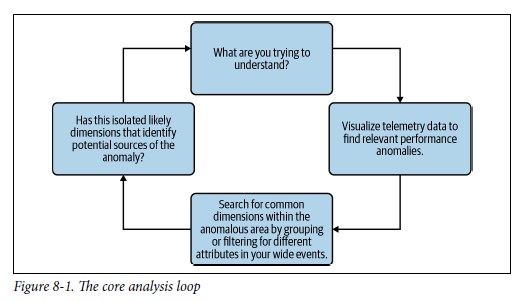
We call that methodology the Core Analysis Loop. It’s the process of formulating a hypothesis based on what you really know to be true, then testing it. It follows these four stages:
Determine what you know: This is where you build your hypothesis.
Prove or disprove your hypothesis: Then, you visualize performance in your system with a graph to validate or invalidate that hypothesis.
Look for why: If your hypothesis is valid, use outlier conditions and patterns of correlation to help you determine what’s causing your hypothesis to be true.
Assess what you learned: If you learned enough about potential causes, then you’re done. If not, start with what you now know to be true and repeat the loop.
What functional requirements do I need from a datastore to enable that analysis?
The Core Analysis Loop requires iterative and exploratory investigation. You assemble any view of system performance you need, ad-hoc, to answer any question you may have. Starting from first principles means that you start with a fresh view of the situation, rather than starting from “known” conditions.
If you’re starting your analysis from dashboards, you’re starting from previously known conditions and that inevitably biases your investigation toward past assumptions and limitations. Maybe you have a dashboard grouped by service or user ID, but the issue you have is only happening in certain regions. Without the ability to quickly and iteratively try different groupings (like availability_zone), filter out unhelpful attributes, or dig further into the interesting ones, you’ll instead be scrolling through endless dashboards that may or (more likely) may not be leading you in the right direction.
Starting with ad-hoc queries, like those favored by Honeycomb, enables you to quickly visualize and gather current facts about changes in application performance behavior, plus easily see any outliers. Spotting those outliers and forming a hypothesis is what kicks off the core analysis loop. At Honeycomb, we’ve automated the Core Analysis Loop for you. Rather than manually going through numerous iterations of the loop until you zero in on the interesting commonalities, BubbleUp does that work and it automatically surfaces the likeliest causal attributes.
That type of iterative, ad-hoc, explorative slicing and dicing of data to surface causal attributes requires churning through massive amounts of data in a relatively short amount of time. Therefore, a datastore running an observability workload needs certain characteristics to make that kind of investigation possible.
Tuning a datastore, like Honeycomb, for an observability workload means that it must meet these functional requirements:
- Queries must return results within seconds
- Any field within any event/span must be queryable, because you don’t know which one matters
- Events cannot be pre-aggregated
- If events are aggregated, the unaggregated data must be accessible to avoid dead ends
- Retrieval performance for particular dimensions cannot be privileged—all possible data must be indexed, or data retrieval must always be fast without indexes in place
- Freshly ingested data must be available for query within seconds, to verify issues are fixed
- Data store must be durable and reliable, because you need that data at critical moments
There are several possible ways to implement a datastore that meets those requirements. Time series databases aren’t up to the task and you’ll more than likely need to start with a columnar datastore to accomplish such a feat. There are several considerations and difficult challenges to overcome to build an observability datastore. Check out Chapter 16 of the O’Reilly book for an in-depth case study on how we did that with Honeycomb’s Retriever engine (as one example).
Build vs buy: What should I do when it comes to observability solutions?
Did you read Chapter 16 of the book yet? If not, I have some (slight) spoilers for you. It’s a lot to build—especially at scale.
For some organizations, it makes sense to build an observability solution in house—and for others, it’s too much of a lift. It comes down to the return on investment and understanding exactly what goes into that investment. Oftentimes, the option to build a solution seems free (after all, engineering salaries and open source components are free… right?). But if you objectively start to add up costs (including infrastructure costs and opportunity costs), the math isn’t quite so simple.
The option to buy also carries some inherent risk. Most notably, buying from a vendor means that you may not be getting as customized a solution as one you build in-house (which is both a blessing and a curse). Chapter 15 of the book explores this in-depth and we spent a fair chunk of the webinar exploring the topic.
And keep in mind, the build vs buy question may not only have two distinct and polar answers—there can be a middle ground. For instance, you could buy a vendor solution that is extensible enough for you to build any last mile customization you may need.
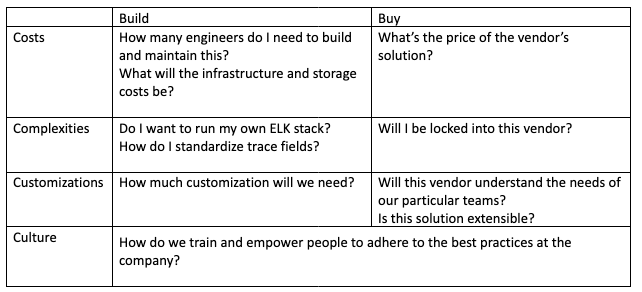
There are many more considerations, but here are some starter questions to ask yourself to get a better handle on the build vs buy equation:
Ready to learn more?
We’ve only scratched the surface here. If you want to keep learning, you can check out our O’Reilly book or hear us talk about these chapters and watch a live demo in our webinar recording.
Stay tuned for our next discussion in our Authors’ Cut series on July 26, where we’ll cover changing practices on your team, and observability-driven development.If you want to give Honeycomb a try, sign up to get started.