How 3 Companies Implemented Distributed Tracing for Better Insight into Their Systems
Distributed tracing enables you to monitor and observe requests as they flow through your distributed systems to understand whether these requests are behaving properly. You can compare tiny differences between multiple traces coming through your microservices-based applications every day to pinpoint areas that are affecting performance. As a result, debugging and troubleshooting are simpler and faster. No one has to guess or spend countless hours researching possible causes for issues, like you would if traditional logging methods were your only resource.

By: Rebecca Carter
Distributed tracing enables you to monitor and observe requests as they flow through your distributed systems to understand whether these requests are behaving properly. You can compare tiny differences between multiple traces coming through your microservices-based applications every day to pinpoint areas that are affecting performance. As a result, debugging and troubleshooting are simpler and faster. No one has to guess or spend countless hours researching possible causes for issues, like you would if traditional logging methods were your only resource.
What makes distributed tracing so powerful? Instrumentation. Through instrumenting your code, users can parse large amounts of high-cardinality data that can then be further parsed and analyzed at extremely granular levels. Honeycomb recommends instrumentation through OpenTelemetry SDKs. OpenTelemetry is an open source project that lets users collect, export, and generate distributed traces with the most popular and common languages without having to lock in with a specific vendor.
This blog shares how Honeycomb users Slack, HelloFresh, and Intercom implemented and incorporated distributed tracing and how it helped accelerate their development cycles—and find fast answers to complex problems.
Clearing up flakiness: Implementing distributed tracing in steps at Slack
In 2020, Slack, the employee messaging and productivity hub, faced a major challenge created by rapid growth. Its rate for flaky tests, which return both a passing and failing result despite no changes in the code, climbed as high as 50%. This impacted Slack’s continuous integration (CI) pipelines, where developers frequently integrate code into a central repository. Developer trust in tests declined, velocity slowed, and teams struggled with a massive Jenkins queue.
The solution? Trace the CI logic with an in-house data structure called “SpanEvent” and Honeycomb. Slack implemented a SpanEvent that allows them to create an event once and use it in multiple places. Slack’s SlackTrace pipeline can ingest SpanEvents from multiple clients, allowing the Slack team to create views from the same data model by processing it through Kafka. Then, SpanEvents can be accessed and analyzed through a data warehouse or a real-time store. As a result, Slack reduced flaky tests to 5% and triaged other CI issues quickly by using Honeycomb.
To get buy-in, Slack took a three-step approach:
- Start small so the team experiences quick wins. “One way I was able to understand how the pieces fit together was by using tracing to put in easy, small flags,” said Slack Senior Staff Engineer Frank Chen. For example, using this method with Honeycomb, the team was able to fix a Git checkout quickly and easily. Enthusiasm increased.
- Demonstrate how much faster distributed tracing can be. Reusing the test instrumentation in a cross-service trace, in just two hours, the source of the Jenkins queue problem was clear. Git LFS (Large File Storage) slowed down the entire system. An engineer that witnessed it all said, “That’s dope.”
- Organize a unified effort to reduce flakiness. A set of shared dimensions for legible and accessible Honeycomb queries, created from the CI tracing solution, were stubbed early in a library and instrumented with a few clients. Teams extended and reused these dimensions, creating a shared vocabulary for distributed tracing.
Recipe for success: Taking a gradual approach to distributed tracing at HelloFresh
The platform engineering team at HelloFresh, the world’s leading meal kit company, provides centralized platform and payment services to internal teams. This team used a long list of tools to help troubleshoot production issues, but maintaining these solutions was burdensome. Today, thanks to distributed tracing with Honeycomb, the HelloFresh team spends less time on maintenance, and has reduced the number of tools they use.
VP of Engineering Renato Todorov approached the implementation of Honeycomb gradually. He knew that fast incident resolution could reduce friction for developers supporting production services. When Honeycomb identified the cause of a problem that the incident management team was still investigating with other tools, his team experienced the power of faster incident resolution results. Todorov said, “It’s what convinced us.”
To help enable organization-wide adoption, Todorov asked questions to discover pain points that learning could address, along with the preferred method of learning. He also used the answers to determine which teams would be early adopters, laggards, or champions. Assisted by champions, he helped teams understand what effective instrumentation would mean for their applications and how to implement it.
Paging visualizations: A proof of concept speeds adoption at Intercom
Intercom enables businesses to engage with their customers throughout their web properties. The web requests that Intercom’s system processes use code from as many as 14 different product teams. Because the code is so complex, Intercom uses distributed tracing to understand what’s going on. Intercom’s engineering team can see how a certain signal changes over time or under certain conditions, view distributions in the form of heatmaps to identify outliers, and much more.
When Intercom made the decision to use Honeycomb for distributed tracing, it knew it had to show value quickly. So, Intercom worked with Honeycomb on a proof of concept to get tracing into the hands of engineers as fast as possible. “In the end, we concluded that Honeycomb not only worked better for the main workflow we had identified, but also ticked the boxes on sampling, pricing, and usage metrics,” explained Kesha Mykhailov, Product Engineer at Intercom. The proof of concept also enabled the entire company to see how Honeycomb’s visualizations make observability workflows more efficient. Adoption began.
To measure this adoption, Intercom mines its issue tracking in GitHub for data. The premise is that if insights from tracing are valuable, people will share them with one another in GitHub.
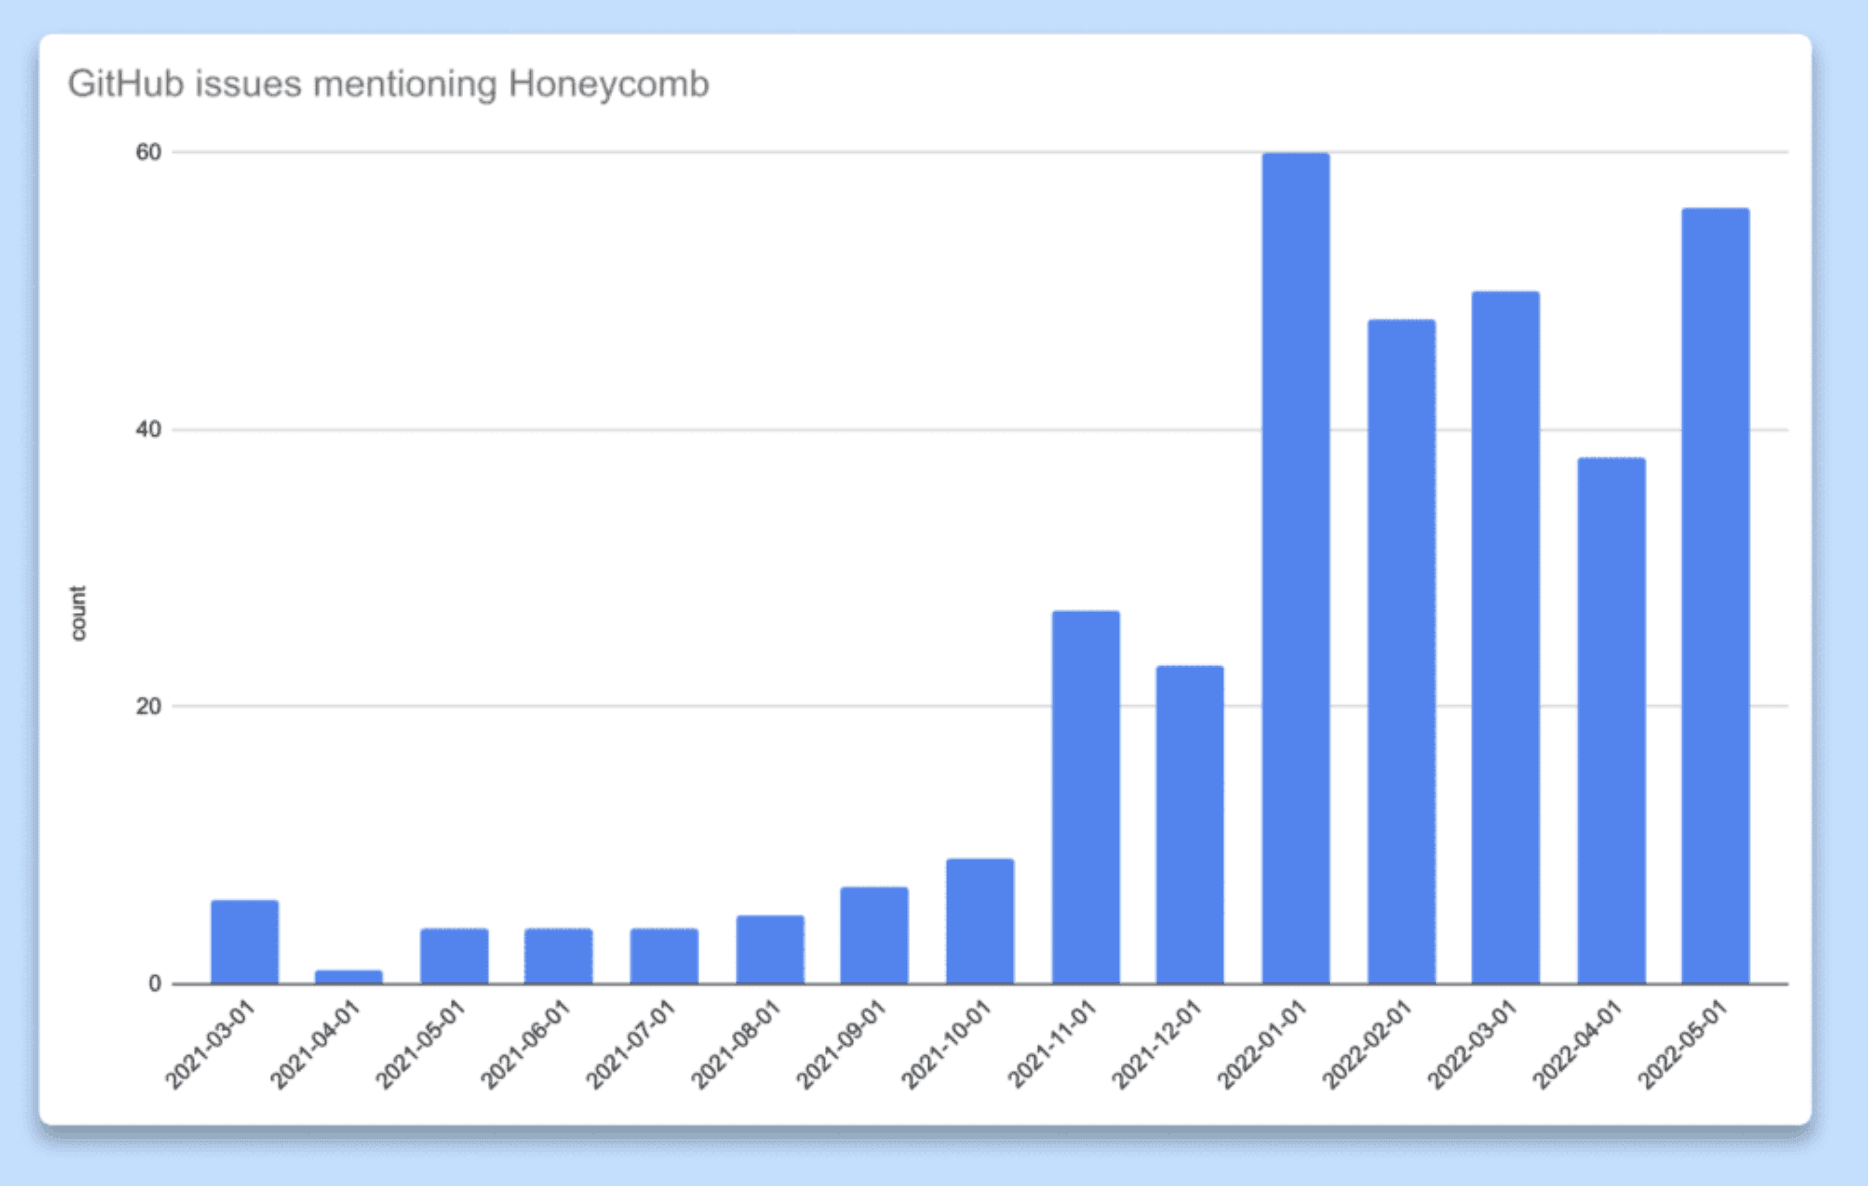
The company counts the number of issues or pull requests where Honeycomb is mentioned or linked to (trace, query result, and so on) as a proxy for adoption. Intercom then determines whether the insights are useful based on how frequently they are shared.
Want your teams buzzing about distributed tracing and observability?
As we’ve seen with the examples outlined here, distributed tracing is foundational to achieving the most complete observability. To dive deeper into distributed tracing and what it can do for you, visit our distributed tracing page. You can also try Honeycomb for yourself with our free tier today.
Want to know more?
Talk to our team to arrange a custom demo or for help finding the right plan.