This post was written by Kesha Mykhailov, Senior Product Engineer at Intercom.
At Intercom, we focus on customer experience above all—our service’s availability and performance is our top priority. That requires a strong culture of observability across our teams and systems.
As a result, we invest a lot in the reliability of our application. But unpredictable failures are inevitable, and when they happen it’s humans that fix them.
We operate a socio-technical system, and its ability to recover when faced with adversity is called resilience. One of the crucial components of resilience is observability, the steps we take to enable humans to “look” inside the systems they run.
This post will explore the road to building a stronger culture of observability, and the lessons we’ve learnt along the way.
What do we mean by observability at Intercom?
At Intercom, we ship to learn. Our production environment is where our code, infrastructure, third-party dependencies, and our customers come together to create an objective reality—it’s the only place to learn and validate the impact of our work. We define observability as a continuous process of humans asking questions about production, and getting answers*.
Let’s break that down a little more:
- Continuous process: Successful observability means that folks observe as frequently as possible.
- Questions about production: We wanted our definition to be wide, generic, and representative of the broad scope of workflows we cater for.
- Answers*: Note the asterisk. No tool will give you answers, only offer leads you can follow to find the real answers. You have to use your own mental models and understanding of the systems you run.
Stage 1: Problem and solution
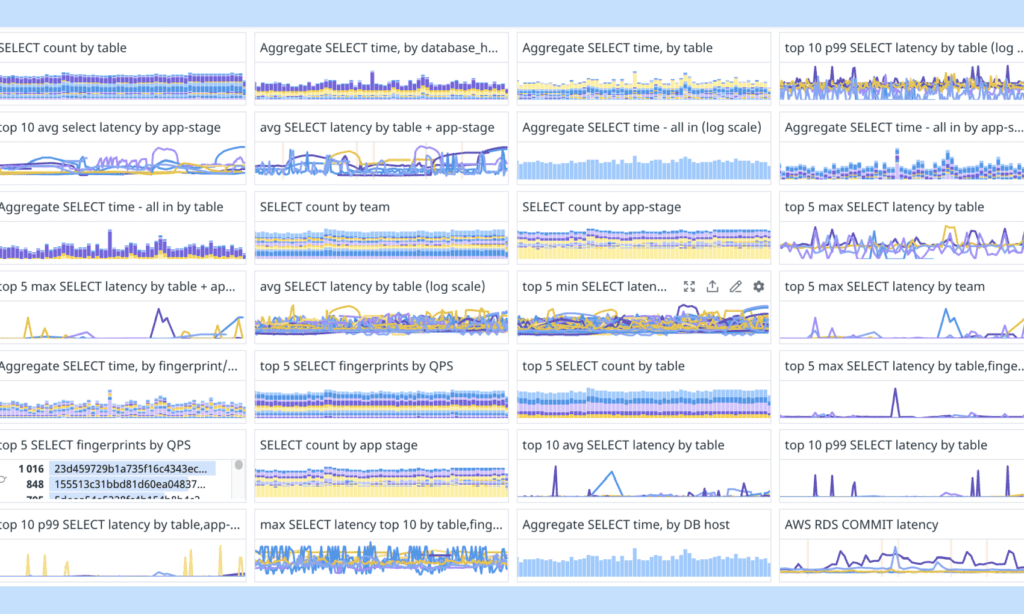
Armed with our own definition of observability, we assessed our existing practices and formulated a problem statement. Until recently, our observability tooling has been primarily based on metrics. A typical workflow involved looking at a dashboard full of charts with metrics sliced and diced by various attribute combinations. Folks would look for correlations, but often leave without fulfilling insights.
“Metrics are easy to add and understand, but they are missing high-cardinality attributes (e.g. Customer ID), making it difficult to complete an investigation.”
Metrics are easy to add and understand, but they are missing high-cardinality attributes (e.g. Customer ID), making it difficult to complete an investigation. Previously, a handful of observability champions would continue the workflow using secondary tools (e.g. logs, exceptions, etc), trying to access the high-cardinality information and build a fuller picture. That skill required constant practice—an unrealistic ask for the majority of product engineers who are busy delivering product.
We identified this lack of consolidated observability experience as a problem to be solved. We wanted it to be easy for anyone to ask an arbitrary question about production and get insights without having to master a set of disconnected, undersetuped, and pricey tools. To mitigate the problem, we decided to double down on tracing telemetry.
Why traces?
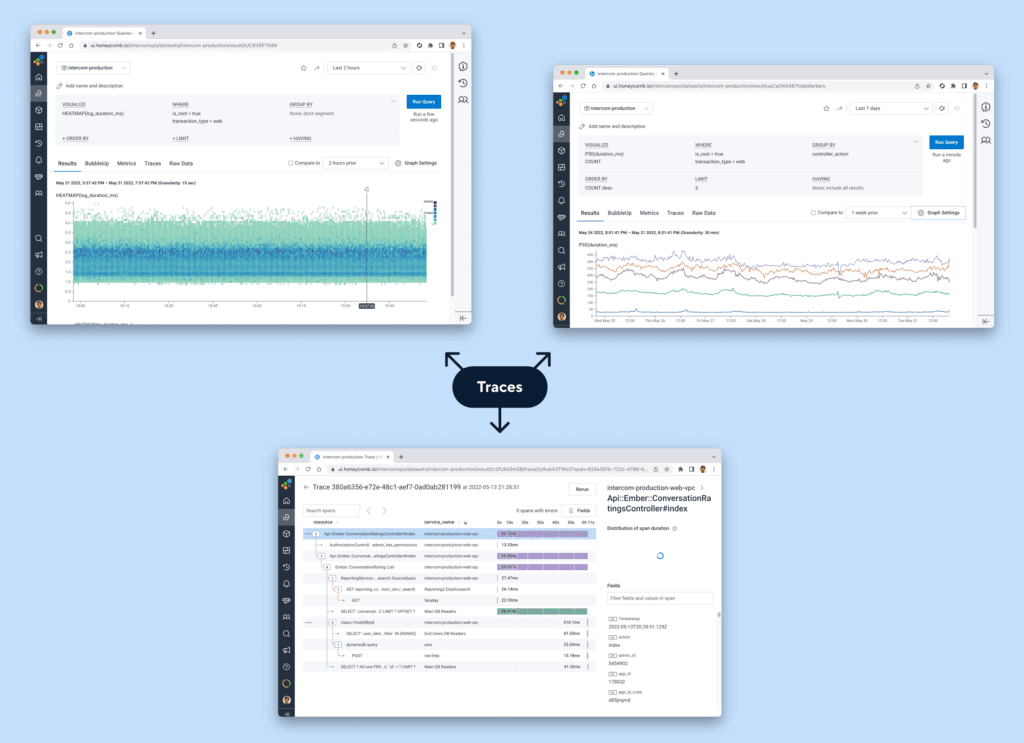
Any observability tool is just a tool with a human behind it – and humans need good visualizations. It doesn’t matter what kind of data powers the visualization, just that the tool allows you to seamlessly switch between different visualizations and get alternative perspectives on the problem.
Traces have a massive advantage over other telemetry data – they encode enough information about transactions to power virtually any visualization. Building observability workflows on top of traces ensures a smooth consolidated experience without the need to switch the underlying data or the tool.
Stage 2: Implementing traces
At Intercom we start small, deciding what success looks like and monitoring progress along the way. Our main objective was to confirm that traces would make observability workflows more efficient. For that, we needed to get traces into the hands of engineers as soon as possible.
“Instead of instrumenting our application with traces from scratch, we used an existing tracing library that happened to be in the dependencies already.”
To save time, we used our existing vendor, Honeycomb, for our proof-of-concept. We’d already built a great relationship with them while using their tool for structured events in the past.
Instead of instrumenting our application with traces from scratch, we used an existing tracing library that happened to be in the dependencies already, and performed a small adjustment to convert trace data into the Honeycomb–native format. We started with a simple deterministic sampling, retaining ~1% of all the transactions we processed.
Enabling teammates to adopt traces
Shifting an organization towards traces is no small feat. Traces are more complex than metrics or logs and have a steep learning curve. Instrumentation, data pipeline, and tooling are all important, but the biggest challenge is enabling your teammates to maximize their use of traces. With our proof-of-concept running in production, we immediately started to focus on building a culture of observability.
“We didn’t focus on engineers only—we spoke with directors, technical program managers, security team members, and customer support representatives to emphasize how traces could help them solve their specific problems.”
Finding allies was key to success. We assembled a group of champions who were already skilled at observability. They helped to confirm our assumptions and spread the word about traces within their teams. But we didn’t focus on engineers only—we spoke with directors, technical program managers, security team members, and customer support representatives to emphasize how traces could help them solve their specific problems.
Tailoring our message helped to lock in support. Introducing new tooling always carries a certain risk. By demonstrating potential and getting people excited, we increased our chances of success.
Stage 3: Deciding on the right vendor
With the enablement program kicked off, we started looking at the modern tracing-centric vendors and formulated a set of criteria to assess potential candidates against.
Workflows: We identified exploratory workflow as the most important—it would enable engineers to arbitrarily slice and dice production data and get insights via visualizations and high-cardinality attributes. A big part of diagnosing an issue is being able to spot it, and that means understanding what “normal” looks like. We wanted to make it easy for engineers to explore production by asking questions as frequently as possible, not just when issues arise.
“We wanted full control over the way data would be sampled and retained.”
Sampling and retention controls: We wanted full control over the way data would be sampled and retained. Deterministic sampling helped us to get up and running quickly, but we wanted to be more selective and retain more of the “interesting” traces (e.g. errors, slow requests) using smart dynamic sampling while staying below the contract limit.
Accurate data visualizations: We wanted to make sure that, whatever sampling technique we used, observability tooling handled it transparently by exposing “true” approximated numbers in the visualizations. Each vendor approached this problem differently—some require sending all data to a global aggregator to infer metrics for key indicators like error rate, volume, etc. This wasn’t an option for us given the massive volume of data generated by our rich instrumentation.
Pricing: We wanted a simple, predictable pricing schema that correlated with the value we’d get from the tool. Charging for the amount of data retained and exposed seemed fair.
Engagement metrics: We wanted the vendor to be a good partner and help us to track the tool’s adoption and effectiveness by exposing key usage metrics and levels of engagement.
There is no perfect vendor, so be ready to make some compromises. In the end, we concluded that Honeycomb not only worked better for the main workflow we had identified, but also ticked the boxes on sampling, pricing, and usage metrics—so we avoided the costly vendor migration.
After a challenging year of work, we had completed the technical part of the observability program. This is what we had achieved:
- Our main monolith application had been auto-instrumented with high-quality, attribute-rich traces.
- Engineers had a small set of convenient methods to add custom instrumentation to their code.
- We had deployed Honeycomb Refinery to sample data dynamically and retain more of the “interesting” traces. We encouraged engineers to configure custom retention rules for more granular control. For the most valuable transactions, and when economically feasible, we offered 100% retention to give folks the data they needed.
Stage 4: Increasing adoption
After committing to Honeycomb and completing the work on the data pipeline, we shifted our focus back to enablement. To build a culture of observability, you have to make it easy for people to get on board. Here are some of the ways we helped teams adopt new observability tooling:
Tracing in development environment
To familiarize engineers with tracing instrumentation and encourage them to add it to their code, we offered optional tracing from the local development environment with the traces exposed in Honeycomb. This helped folks to visualize new custom instrumentation in exactly the same way as they would see it when the code hit production.
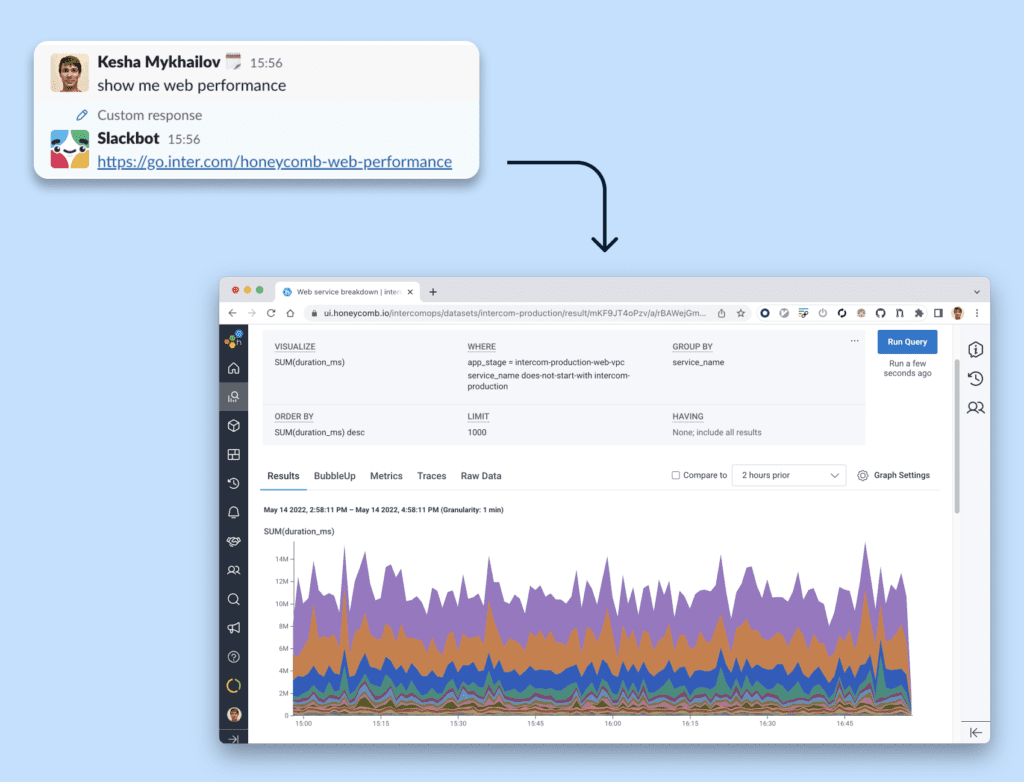
Slackbot query shortcuts
When production is in trouble the last thing you want is to have to scramble for the right query. We added a custom bot reaction to a “show me web performance” message. Following the Slackbot link opens up a web endpoints performance broken down by service.
Stage 5: Reflections and next steps
Measuring adoption
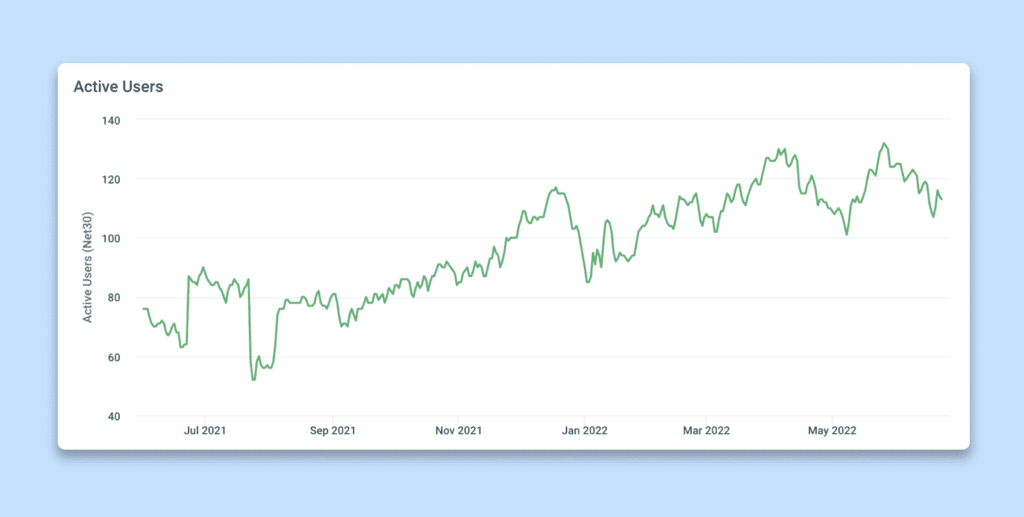
Measuring return-of-investment (ROI) on observability tooling is challenging. Tracking the number of active users is a good indicator of how often engineers engage with the tooling, and we benefited a lot from Honeycomb’s usage metrics.
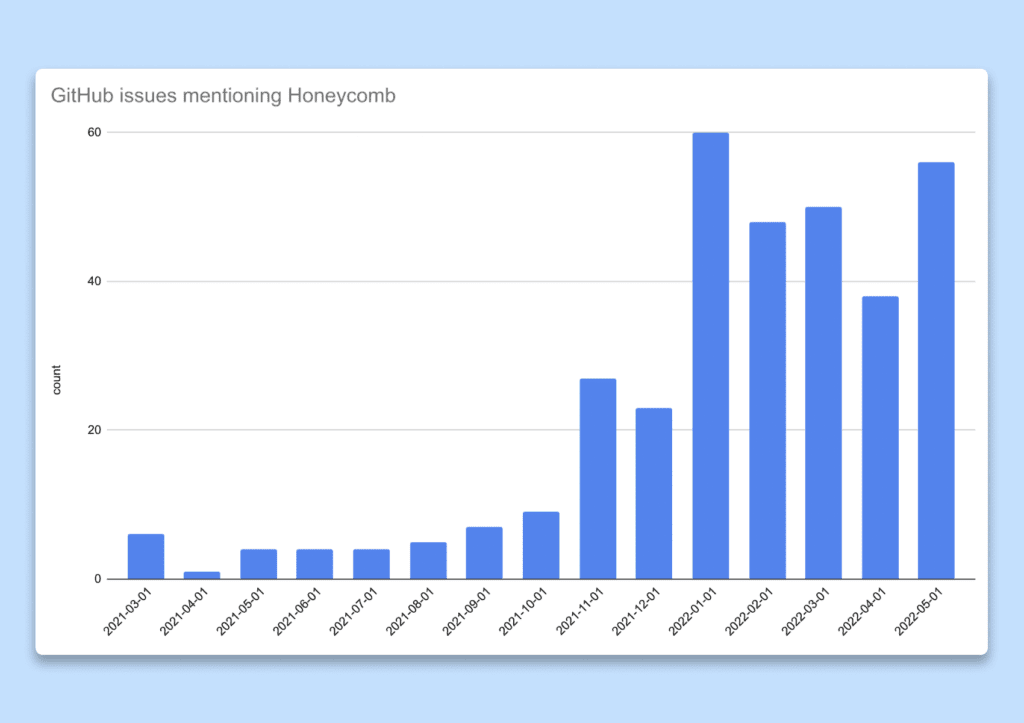
We went further and measured the usefulness of those engagements. We postulated that if insights gained from the observability tooling were valuable, people would share them with their peers. Our engineering workflows heavily depend on GitHub issues so we decided to count the number of issues or pull requests where Honeycomb was mentioned or linked to (trace, query result, etc.) as a proxy for an adoption metric. As we doubled down on enablement towards the end of 2021, we observed an explosion in the number of issues mentioning Honeycomb, proving that we were on the right track.
Unexpected workflows
Building a solid observability foundation enabled workflows we couldn’t have imagined before. Here are some of our favorites:
Informing cost program: Because we trace all the traffic and have spans for SQL queries, Elasticsearch requests, etc., we can investigate spikes in utilization of separate shared parts of our infrastructure (e.g. database cluster) and attribute them to a single customer. Matching this data with the cost of individual infrastructure components, we can put an approximated price tag on every transaction we serve. Observability has unexpectedly become an integral component of our infrastructure cost program.
Improving security audit: Being able to retain 100% of selected transactions has allowed us to preserve all interactions with our production data console, helping security to establish better visibility over access to our customer data.
What’s next for Intercom?
Building a culture of observability will continue to be part of Intercom’s technical program: we’ll focus on improving our onboarding material, further weaving observability via traces into our R&D operations, and exploring front-end instrumentation.
Want to level up your observability like Intercom did? We invite you to sign up for our generous free tier and get started on your journey.