Resolving High CPU Usage in Kubernetes With Honeycomb
At Honeycomb, we’re excited about Kubernetes. In fact, we’re in the early stages of moving some of our services to k8s. Tools like kops have made getting started with k8s easier than ever. But…

By: Travis Redman
At Honeycomb, we’re excited about Kubernetes. In fact, we’re in the early stages of moving some of our services to k8s. Tools like kops have made getting started with k8s easier than ever. But building clusters is only the beginning – before long you might find yourself with a large number of deployments, pods, and services, and new things coming on line every week. Observability is critical to cluster operations. Fortunately, Honeycomb provides multiple Kubernetes integrations to help you get started exploring your cluster’s events and metrics.
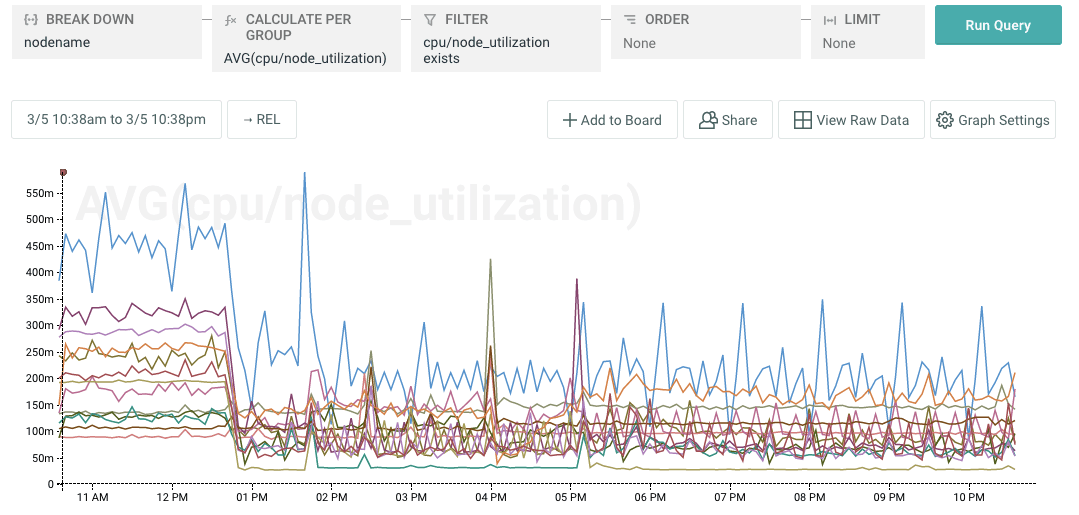
What can we do with Kubernetes data in Honeycomb? Let’s look at a recent event that we experienced at Honeycomb. It started when we noticed node CPU utilization on our new cluster was higher than anticipated.
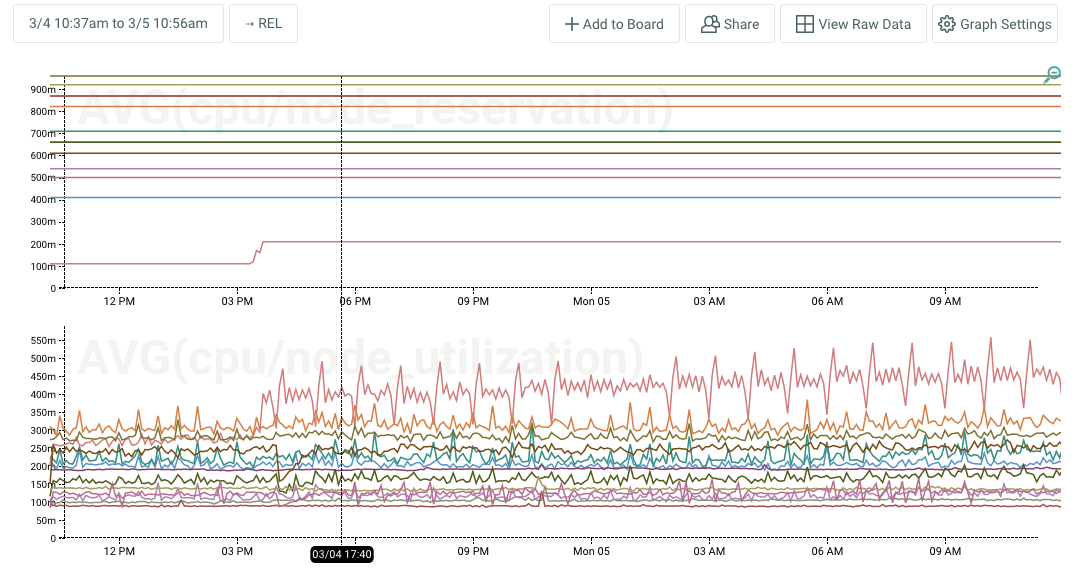
We maintain a team board with a high-level overview of our cluster in Honeycomb. One of the graphs displays CPU utilization and reservation by node. It was the higher than expected values for cpu/node_utilization that seemed odd.
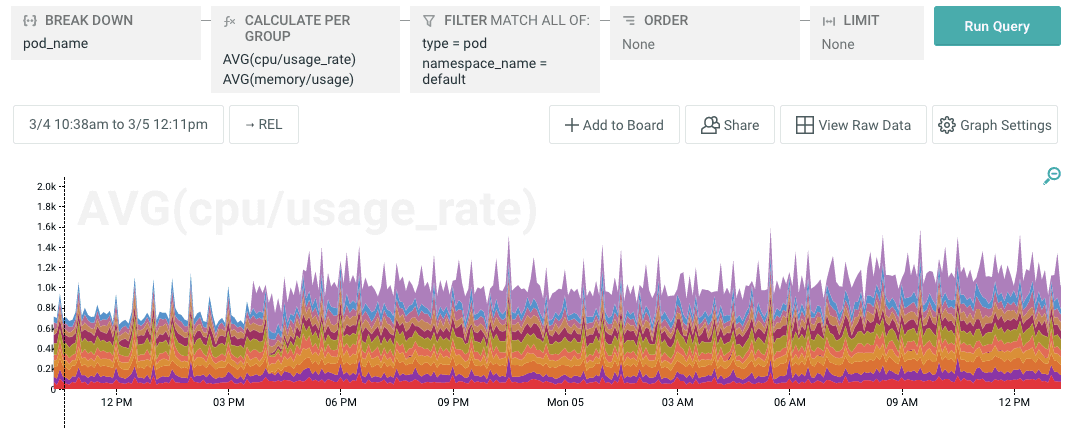
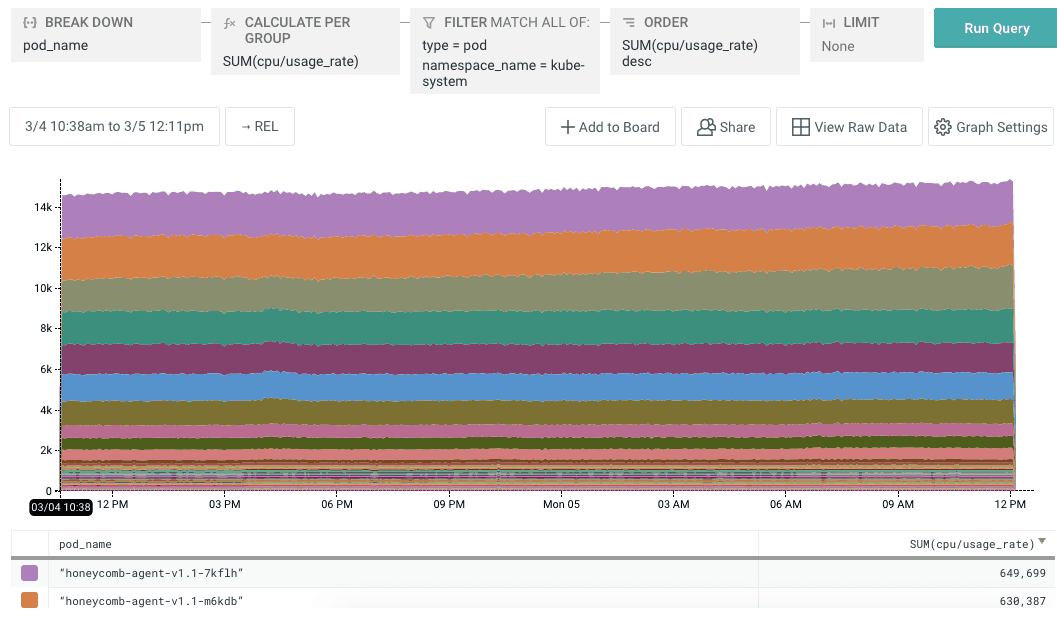
We had deployed a number of pods at this point, and while we had reserved a lot of capacity, actual cpu utilization by these deployed pods was low. A stacked graph of pod cpu utilization showed around 1000 millicores used over all of our application pods.
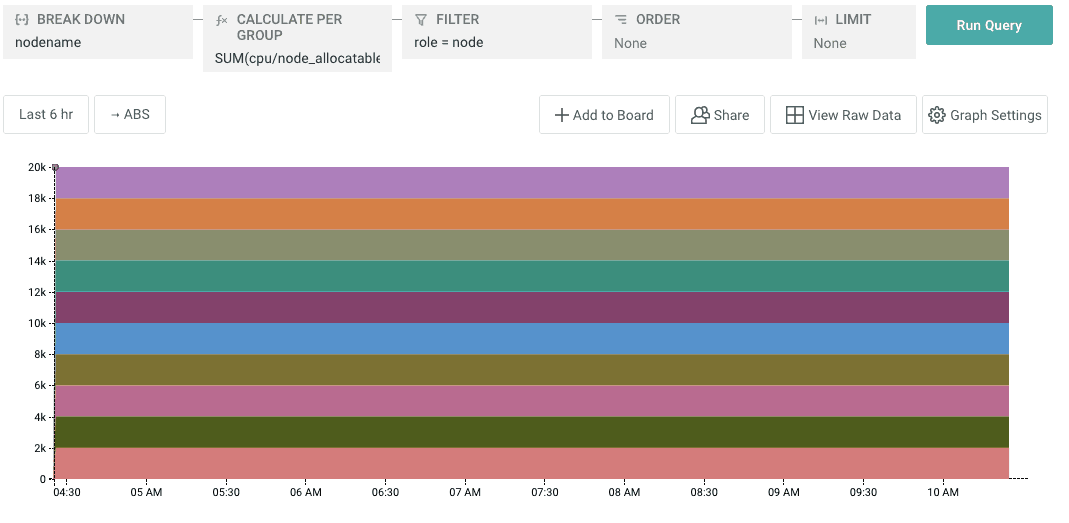
As illustrated in the stacked-graph below, our 10 node cluster has a CPU capacity of 20K millicores and our deployments were consuming nowhere near that! Obviously there is some overhead associated with running core kubernetes services, but we didn’t expect it to explain the difference.
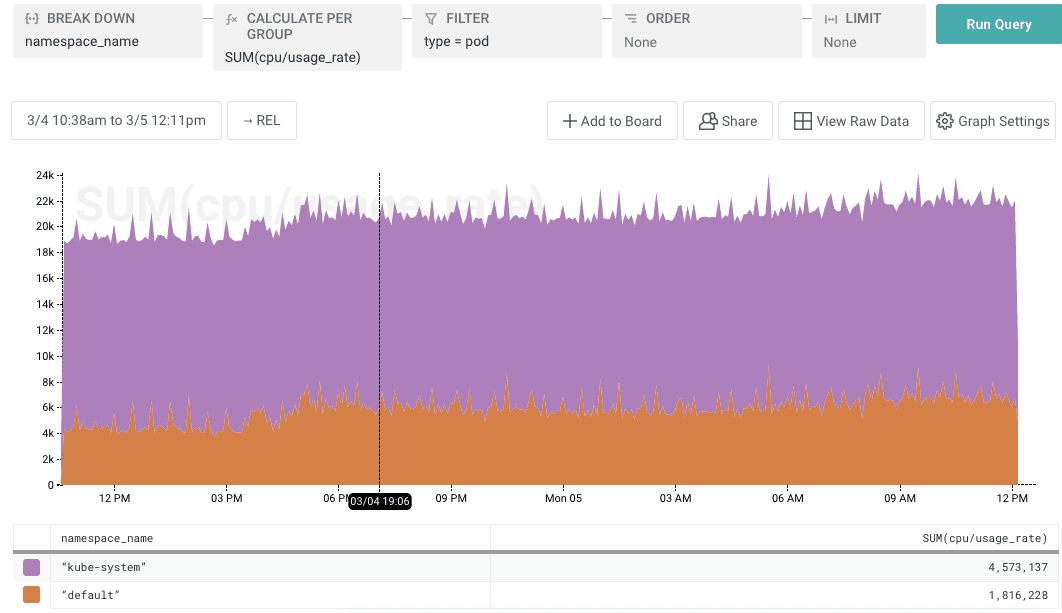
So what was consuming CPU? A breakdown of cpu usage by namespace told us that the cpu utilization was in kube-system. We use SUM instead of AVG here because kube-system has a lot of metrics with very small values for usage_rate that can skew the average. SUM provides a better way to determine what is consuming the most of a finite resource.
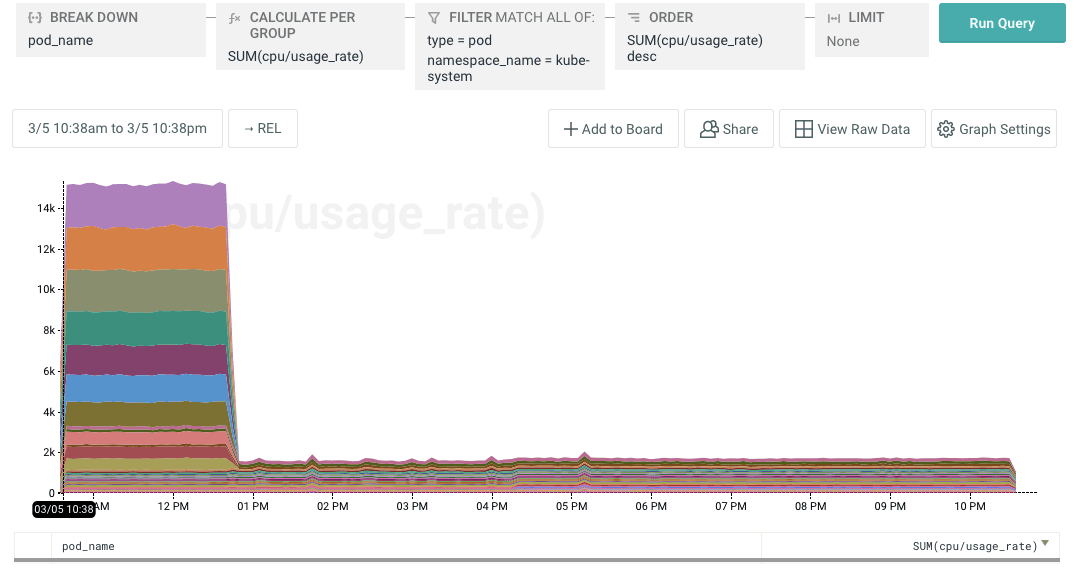
Filtering by namespace and breaking down further by pod names revealed the culprit to be our very own Honeycomb Kubernetes Agent! The Honeycomb Agent runs as a k8s DaemonSet, tailing and parsing container logs, and sending events to Honeycomb.
A misconfiguration in the agent was causing it to consume logs from all pods rather than a specific set of pods we were interested in. As we added pods, cpu usage grew, and because it runs in the kube-system namespace the usage crept up on us. A quick update to the config made a dramatic difference that we were easily able to verify in Honeycomb.

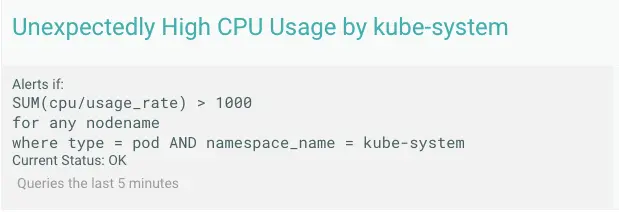
It might be nice to detect a similar situation in the future. To do this, we used a Honeycomb Trigger to look at the total CPU usage by kube-system on a per-node basis. This approach scales with the cluster.
Want to learn more about your Kubernetes cluster? Sign Up for free and take a look at our Kubernetes Integrations!
Want to know more?
Talk to our team to arrange a custom demo or for help finding the right plan.