Get the Big Picture: Learn How to Visually Debug Your Systems with Service Map—Now Available in Sandbox
Honeycomb’s Service Map gives you the unique capability to filter by both services and traces so you can generate maps that isolate very specific areas of your environment. This helps you surface issues quickly and gain a granular understanding of how everything in your system works and evolves over time. And now that a Service Map scenario is available in our Sandbox, you can see it for yourself.

By: Rebecca Carter
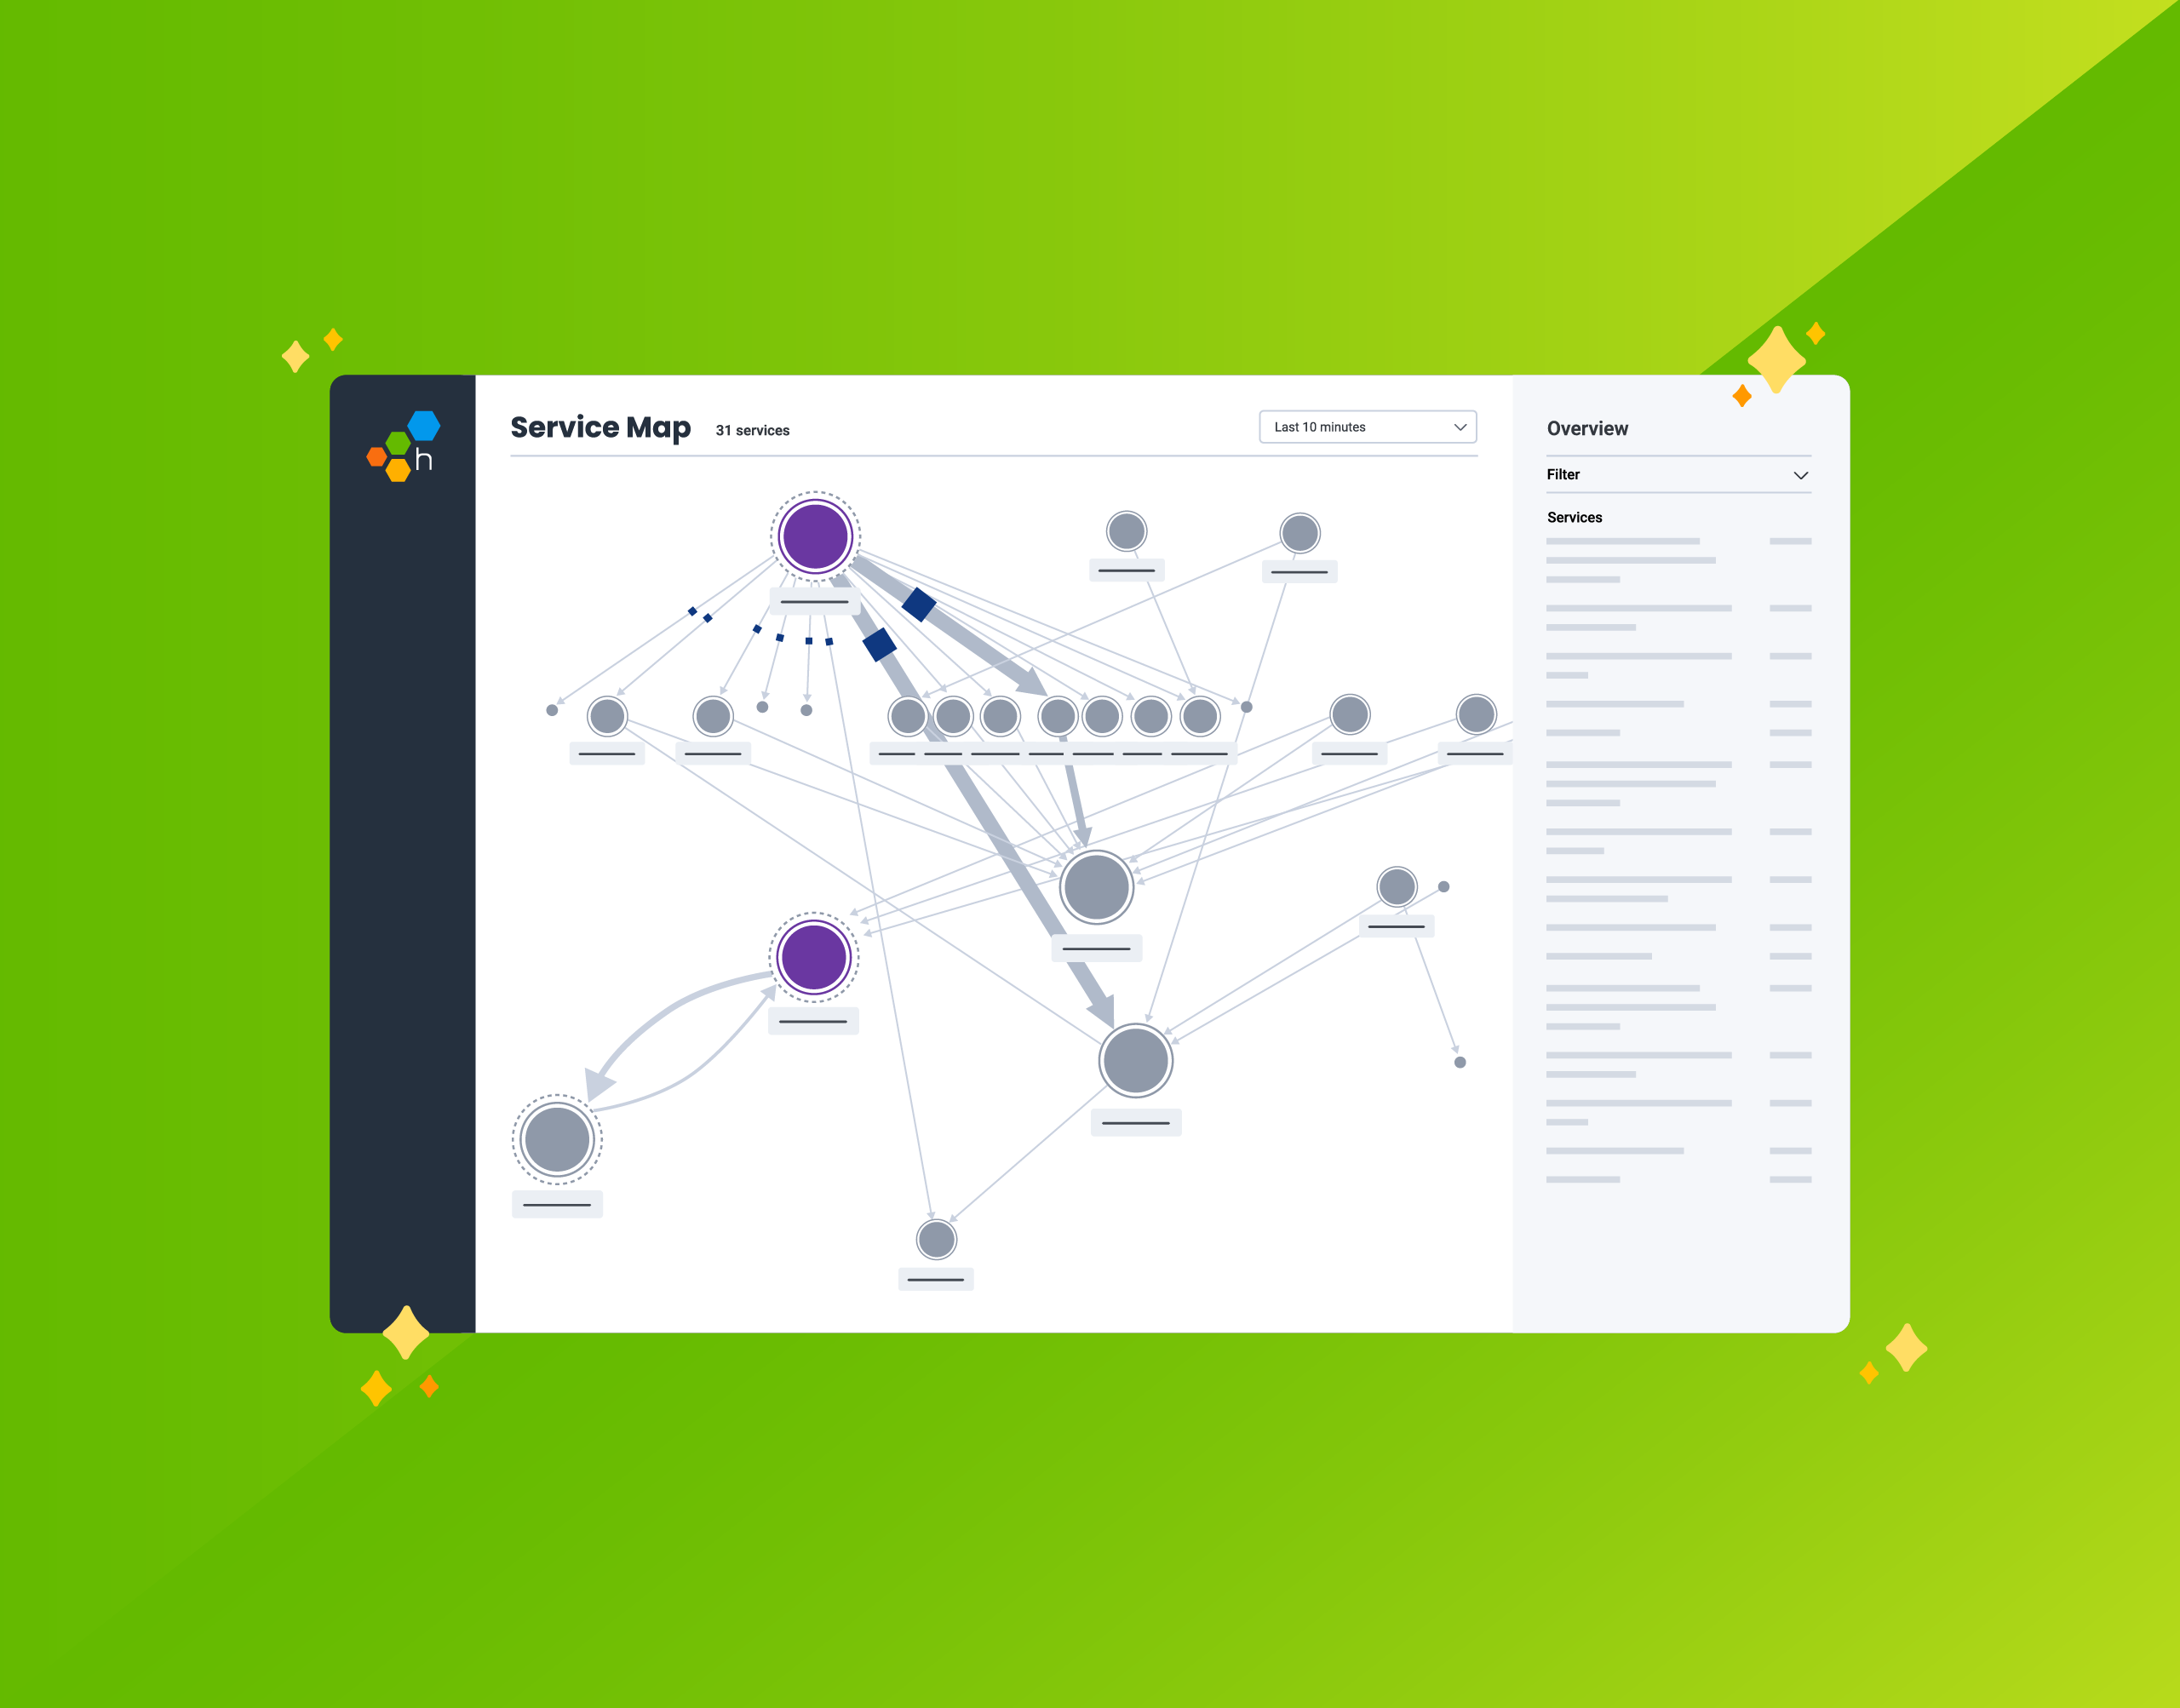
Honeycomb recently announced the launch of Service Map, a new feature that gives users the ability to quickly unravel and make sense of the interconnectivity between services in highly complex and intricate environments.
Chances are you’ve probably used service maps before—or at least have heard of them. So what separates ours from the rest? Honeycomb’s Service Map gives you the unique capability to filter by both services and traces so you can generate maps that isolate very specific areas of your environment. This helps you surface issues quickly and gain a granular understanding of how everything in your system works and evolves over time. No more outdated architecture diagrams, and no more having to bribe the one engineer who has been there since the dawn of time to share their system knowledge. And now that a Service Map scenario is available in our Sandbox, you can see it for yourself.
Welcome to Honeycomb, welcome to Service Map
Service Map exists as a separate scenario from the rest of the Honeycomb walkthrough so you can dive into the feature right away.
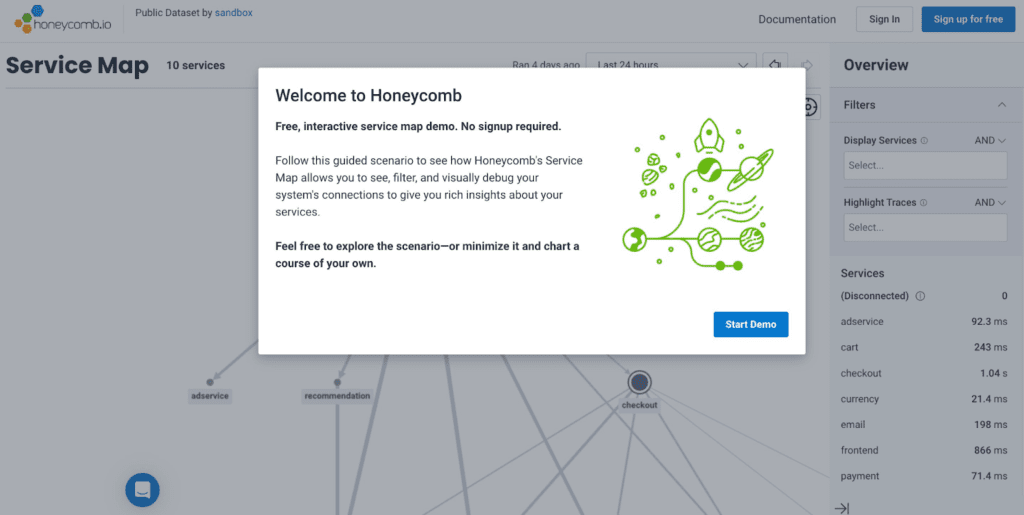
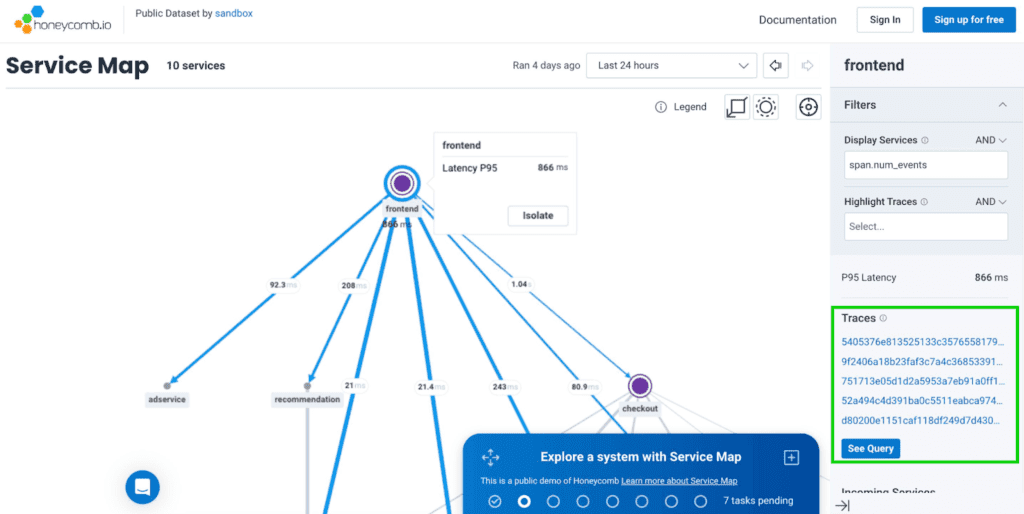
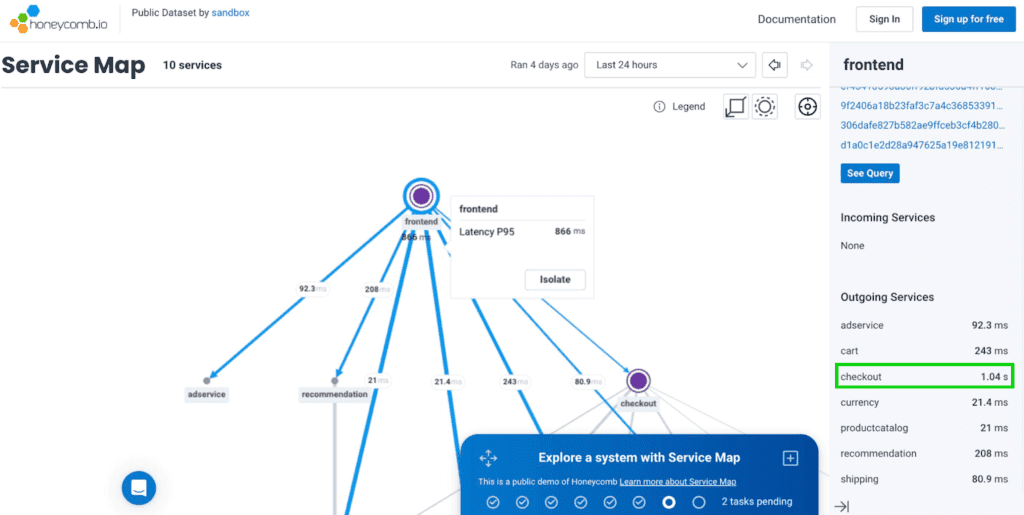
Like our other Sandbox scenario, the Service Map presents you with a real world use case: it’s your first day on the job and you’ve been tasked with learning more about the services you’re responsible for. Your first step is to isolate and inspect that service. As you can see in the screenshot below, Service Map allows you to easily see one particular service and its connections.
The Sandbox is interactive—not just a static walkthrough. You can zoom in on different areas of the map by using your mouse dial. Click on Traces in the sidebar to see the queries (if you feel like getting ahead of yourself).
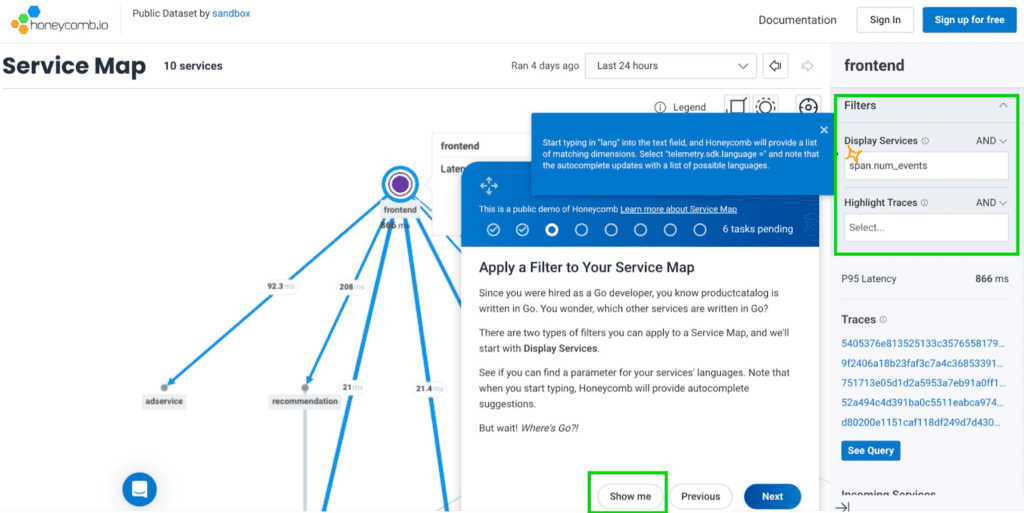
Applying filters
Next, you’ll learn how to apply a filter. This is a crucial feature of Service Map in regards to how it can be used as an advanced debugging tool. Here, you can filter by any number of combinations to investigate and troubleshoot issues connected to services downstream. You can also filter by their direct and indirect dependencies, validate whether or not they are successfully instrumented, and see the status of migrations.
Note: If you get stuck at any time during the scenario, click the “show me” button for a hint on how to proceed.
Using Service Map to investigate issues
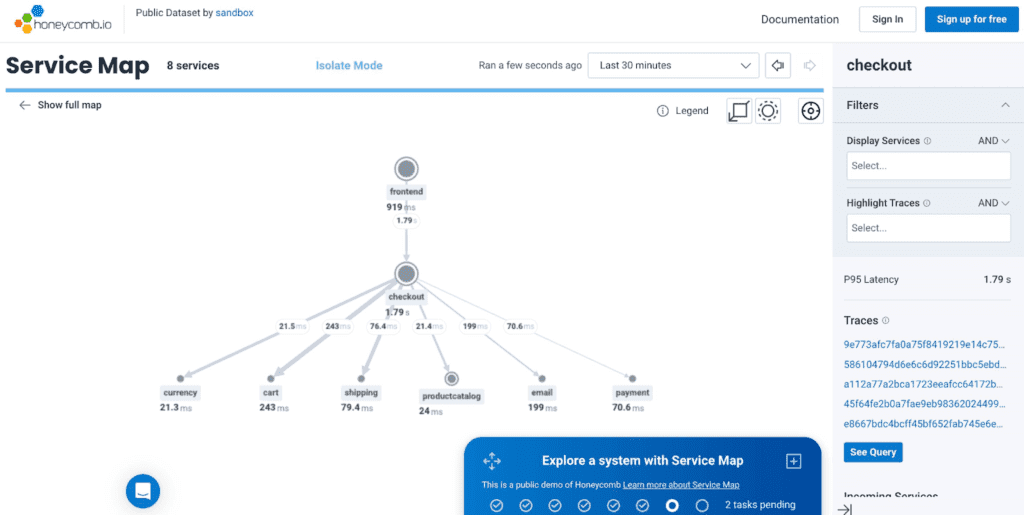
Once you’ve learned how to use filters, the scenario will take you through how to investigate an incident. In this case, it’s a slow request. You’ll see that ‘checkout’ has significant lag time.
You can drill down and isolate that service to see all associated services that are affected. You can also click on the Traces link in the sidebar to get a waterfall view where you can investigate further and spot the bottleneck.
Ready to try it?
This scenario highlights only a few of the cool things you can do with Service Map and how it works in conjunction with Honeycomb’s other powerful tools (like BubbleUp and trace waterfalls, hint hint), but it’s a great introduction that will make you want to try it out with your own data. Try it for yourself.
Want to know more?
Talk to our team to arrange a custom demo or for help finding the right plan.