Calculating Sampling’s Impact on SLOs and More
What do mall food courts and Honeycomb have in common? We both love sampling! Not only do we recommend it to many of our customers, we do it ourselves. But once Refinery (our tail-based sampling proxy) is set up, what comes next?

By: Max Aguirre
What do mall food courts and Honeycomb have in common? We both love sampling! Not only do we recommend it to many of our customers, we do it ourselves. But once Refinery (our tail-based sampling proxy) is set up, what comes next?
Since sampling is inherently lossy, it’s good to be sure the organization’s most important measurements aren’t negatively affected. One option I recommend is to calculate the margin of error impact on your Service Level Objectives (SLOs) and triggers using Heinrich Hartmann’s Sampling Error Calculator.
What’s that about a calculator?
Heinrich Hartmann’s Sampling Error Calculator (source code) works to both estimate and simulate the margin of error introduced by a given sample rate, request rate, and time window. Keep in mind that the calculator gives us an estimation, and as such, the results won’t show the exact impact of sampling on margin of error. It’ll instead provide a general guideline to judge how much trust we can put into SLOs and Triggers.
Obtaining calculator inputs
Below is a service that we use internally to track our batch processing. The threshold is set at 5ms processing time per batch, with the expectation that some will take longer than others.
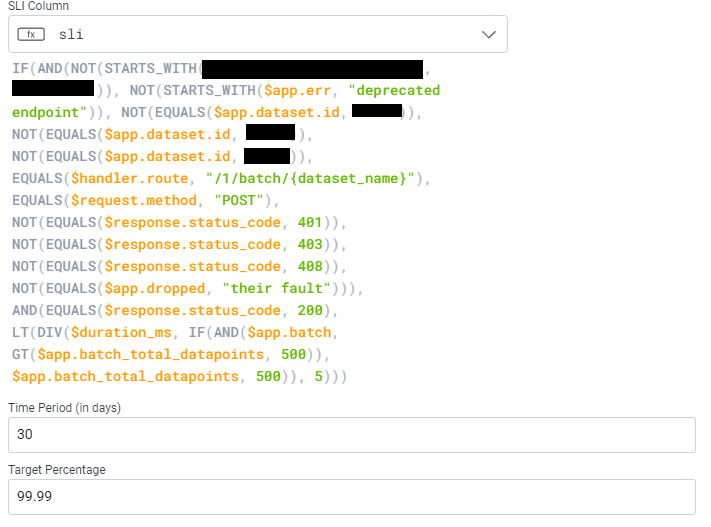
Enter usage mode to access the Sample Rate field added by Refinery. Since SLOs are bound to a specific dataset, we’ll navigate to Team Settings > Usage > Usage Mode for the dataset this SLI belongs to. Once in usage mode, make the following query:
VISUALIZE COUNT, MAX(Sample Rate), AVG(Sample Rate), MIN(Sample Rate) WHERE sli exists GROUP BY sli.
The time window can be adjusted based on your ingest. If you have lower counts (fewer events per second) returned, go ahead and bump it up to a 28 day window.
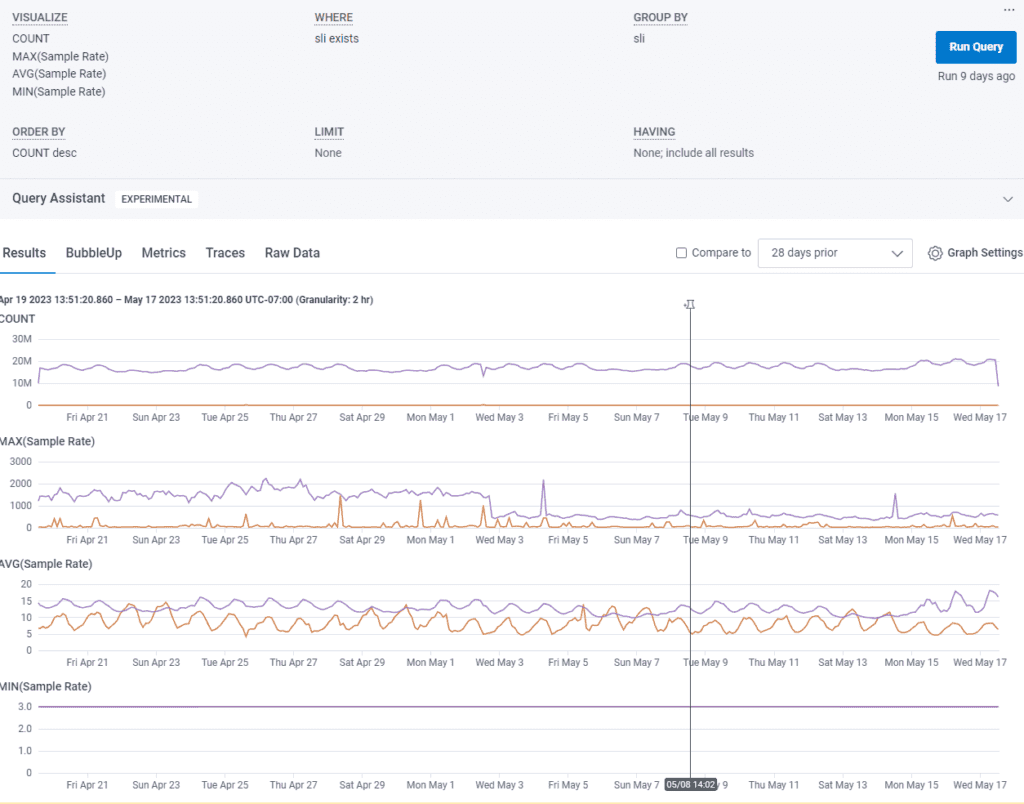

So, what do these results even mean? For the sli column, true means that the results fell within the SLI specification and false means there was a miss. In the image above, the average sample rate for true is ~12.81 or ~7.8% (1/12.81) and for false it’s ~6.05 or ~16.5% (1/6.05). We also need the count for true and false. To do this, hover over the count chart and find the peak values for each. For this example SLO, it’s 21011588 and 2026 events per second respectively.
Calculating the margin of error
Open up the Heinrich Hartmann Sampling Error Calculator and plug these numbers in. We’ll begin with sli = true. Start by entering in the sample rate of 7.8%, the request rate (our count/sec) of 2026, and the time window of 30 days (the SLO’s time period). This gives us a Relative Error Count of 0.07%. Plugging in the numbers for sli = false with the same time window gives us a Relative Error Count of 0.04%
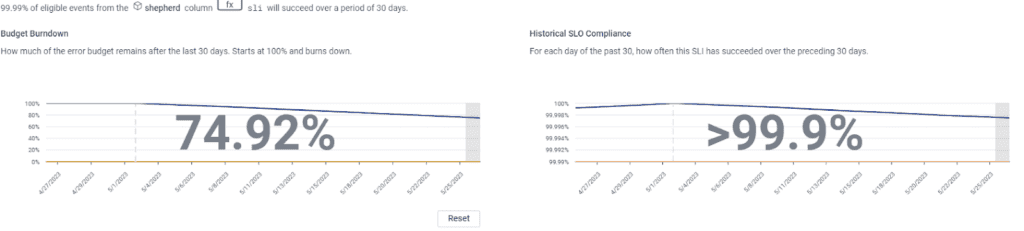
We have some numbers! Cool, but what do they mean? The sli = true calculated Relative Error Count tells us our margin of error for the SLO’s historical compliance and sli = false gives us the margin of error for the SLO’s budget burndown.
This Honeycomb SLO has a burndown margin of error of +/- 0.04% and compliance margin of error of +/- 0.07%. Pretty good numbers! It’s also useful to run this again with the time window matching that of a burn alert to see how the margin of error changes with smaller periods of time.
To go one step further, repeat this calculation against triggers. Use the same method of going into usage mode and calculating based on the trigger’s query outputs the margin of error for alerts. This can help you to decide if an alert will be trusted by those it wakes up in the middle of the night. A 0.5% margin of error? You’ll take that seriously. A 15% margin? You probably won’t.
Room to tune
If your margin of error turns out to be unacceptably high, then it’s time to consider making some changes. Reducing sampling to increase fidelity is likely the path forward, but modifying the SLI formula an SLO is based on—or changing what a trigger targets—are also options.
Before simply slashing the sample rate, consider how the current Refinery rules affect the SLO or trigger in question. Perhaps the deterministic sampler, which uses a fixed sample rate, is used and changing to another method would function better. Or, maybe traces containing a key field are sampled too aggressively and we could add a specific rule.
In the SLO used above, we look at response.status_code = 200. It’s normal to sample 200s fairly aggressively, as successful responses often don’t make for the most interesting traces. However, if we’re too aggressive, we could impact this SLO negatively. Rather than setting a fixed sample rate for all 200s, it might work better to treat those which match handler.route = /1/batch/{dataset_name} differently than others and either keep all or apply a lower sample rate to them with rules-based sampler conditions. Here’s an example that keeps all matching traces:
RulesBasedSampler:
    Rules:
      - Name: keep 200 responses with route match
        SampleRate: 1
        Conditions:
            - Field: response.status_code
              Operator: =
              Value: 200
              Datatype: int
            - Field: handler.route
              Operator: contains
Value: /1/batch/Conclusion
We all want to get the most value out of the least amount of cost and processing overhead. Using sampling is the best approach to maintaining trace integrity and depth while removing some percentage of similar spans. By applying the approach outlined here, you can optimize your event usage.
Please keep in mind that business goals change, instrumentation changes, and as such, sampling rules and SLIs will need adjustment. Whenever you add a new SLI or refine an existing SLI, take a minute to ensure your data is sufficient to support the SLI at the desired target.
Want to read more about sampling? We have a few articles for you:
- Achieving Great Dynamic Sampling with Refinery
- Don’t Let Observability Inflate Your Cloud Costs
Want to know more?
Talk to our team to arrange a custom demo or for help finding the right plan.