Uniting Tracing and Logs With OpenTelemetry Span Events
The current landscape of what our customers are dealing with in monitoring and observability can be a bit of a mess. For one thing, there are varying expectations and implementations when it comes to…

By: Nathan LeClaire
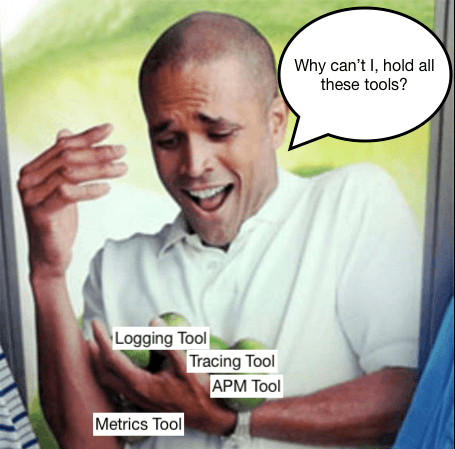
The current landscape of what our customers are dealing with in monitoring and observability can be a bit of a mess. For one thing, there are varying expectations and implementations when it comes to observability data. For another, most customers have to lean on a hodgepodge of tools that might blend open source and proprietary, require extensive onboarding as team members have to learn which tools are used for what, and have a steep learning curve in general.
In the case of the first problem, luckily, OpenTelemetry has become a place of convergence and commonality to unify the ecosystem. However, customers still find themselves facing the second problem—they have a set of workflows straddling different tools with each having its own learning curve, user mechanics, and operational requirements. Is there something we can do to unify some of these so that, for example, we can look at logging-shaped information and tracing-shaped information in the same place?
Absolutely. That’s possible with Honeycomb today, and in this article, I’m going to show you how and why you might want to move forward with it.
Spans, Events, Logs, Span Logs, and Span Events
Before we dive in, a word on jargon—in Honeycomb, the atomic unit of data is referred to as an event, representing a single operation such as an HTTP request that was served. In the olden days of Honeycomb, we recommended that you roll up a variety of information about one operation into a single, arbitrarily wide event containing a bunch of properties explaining what happened. This would be in contrast to the way you probably log—spitting out new lines around every corner of your app, which may not have explicit structure to them at all.
As Honeycomb evolved and added tracing support, it became clear that you actually wanted several wide events per trace—a lot of operations might happen that merited their own spans (such as database or outbound HTTP calls to other services). Events and spans are synonymous in Honeycomb, and a trace is a collection of [spans|events]. Meanwhile, the earliest tracing systems such as Zipkin supported a notion of Span Logs, which, as the name implies, are little structured logs associated with a span whose duration is not important, but might still be worth having. An example might be an exception thrown by a program —we probably don’t care how long it took to throw the exception (probably not very long), but we definitely want to note that it happened in a trace, and take in as many details as possible about it.
Try OpenTelemetry with Honeycomb
Get started for free.
How OpenTelemetry Streamlines the Logging Process: An Example
Logging comes in all shapes and sizes, from unstructured nonsense to structured application logs containing rich information about an app. OpenTelemetry has a long-term goal of supporting logs also as distinct signals from Spans, but there is also a need to strongly associate a span with a log, much like Zipkin did with Span Logs.
As OpenTelemetry evolved, it adopted the previous Span Logs concept and called it, in true Murphy’s Law fashion, Span Events. A Span Event is a distinct concept from a span or an event, but like a span, it happens to be the case that all Span Events are also Honeycomb events. Honeycomb understands which events in particular are Span Events if some of their metadata has been set appropriately and can render them in the trace view as well as query them.
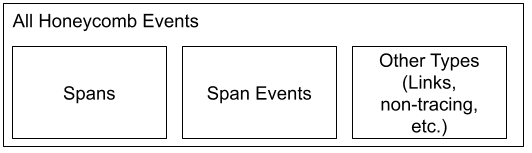
Here’s a quick recap and and visualization of OpenTelemetry terminology
- Event: The core unit of Honeycomb’s data ingest.
- Span: The core unit of distributed traces. One span is equivalent to one event.
- Trace: A collection of spans that represents one workflow; e.g., a served request or background job run.
- Log: An arbitrary output from the program to the console.
- Span Event: A “log” that happens as part of a span. An operation that is too fast for its own span, but too unique to roll up into its parent span.
OpenTelemetry Span Events: Where are they useful?
Span Events can often help to fill any log-shaped hole in your heart you still have remaining once adopting Honeycomb. A great example where they are added during auto-instrumentation is in the OpenTelemetry Java Instrumentation—if that agent sees an exception happen while it’s tracing your code, it will attach the exception details automatically onto the relevant span as a Span Event. This is very useful contextual information when looking at a trace to understand why a problem is happening, and it can be sliced and diced to high heaven in the Honeycomb Query Builder like any structured event you send us.
They could also be useful to bridge the gap between what your team is used to seeing in their logs and what they will begin seeing once they adopt Honeycomb. For instance, let’s say you have a chunk in your code that looks like this and you’ve just begun adding tracing instrumentation:
ret, err := makeSyscall(ctx, args...)
if err != nil {
// ... handle error
}
logger.WithFields(logger.Fields{
"user_id": userID,
"syscall_return_val": ret,
"args": args,
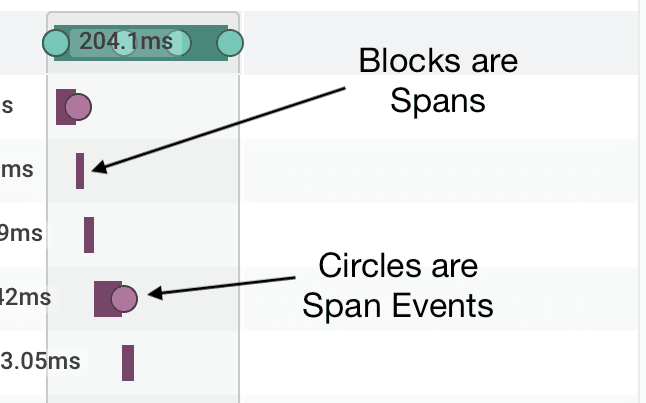
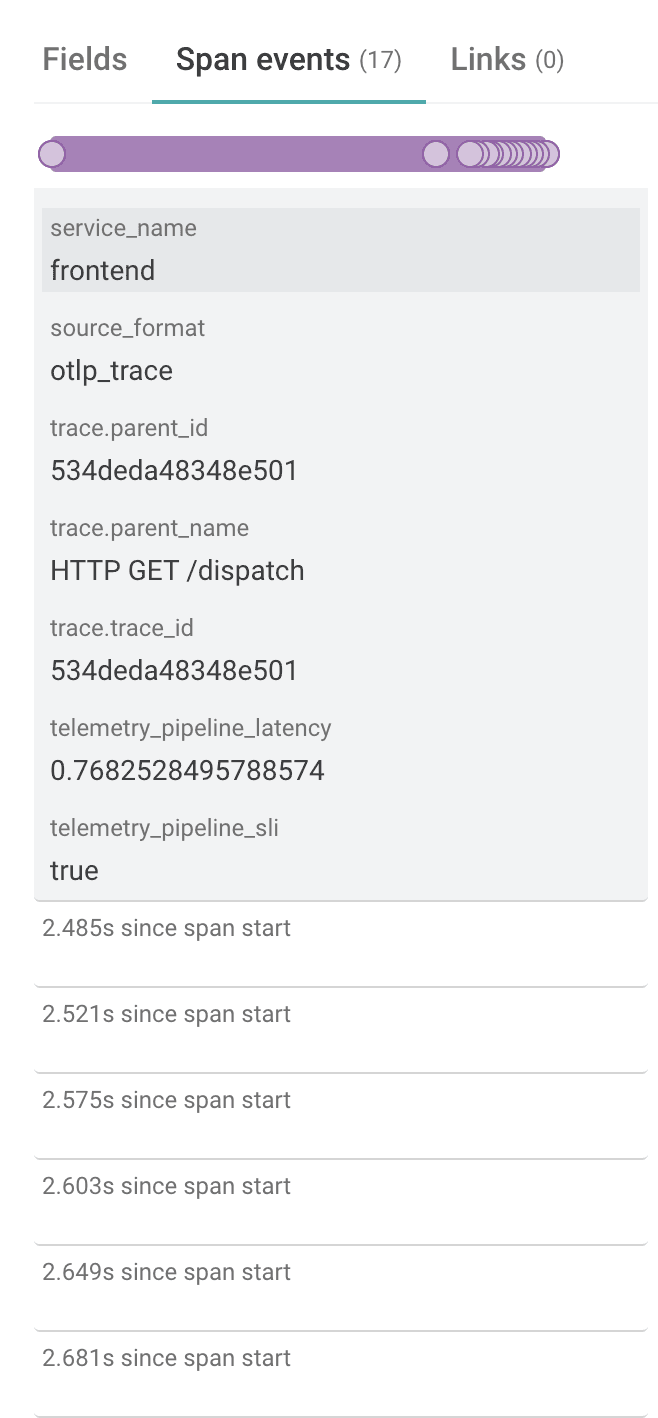
}).Info("Finished system operation")If we’re looking for sensible span boundaries, a syscall might be a little too fast to split out into its own span, so generating a span for each call might blow out our trace view and reduce its utility. With Span Events, on the other hand, like you see in the screenshot above, they will simply show up as little dots on the span and be accessible in the sidebar when we click on it.
So we might want to add a Span Event to include the information we are logging into the trace! First, we’ll grab the active span, then we’ll call AddEvent to add a Span Event on it:
ret, err := makeSyscall(ctx, args...)
if err != nil {
    // ... handle error
}

span := trace.SpanFromContext(ctx)
span.AddEvent("Finished system operation",
  trace.WithAttributes([]label.KeyValue{
    label.String("user_id", userID),
    label.String("syscall_return_val", ret),
    label.String("args", args),
})This takes us one step closer to unifying our traces and logs for good, and we’ll have a lot more flexibility in Honeycomb than we get with logging tools—not only can we query insanely fast, but Honeycomb is wildly permissive with what details we can add onto events. Want to stick a whole response body or stack trace in there? Go for it. You do, of course, want to have an eye toward what will be most practical to query (e.g., well groupable–stack traces might vary even though they’re spiritually the same), but the levels of freedom are unprecedented.
How about with Beelines?
Any integration with enough control over the data sent to Honeycomb can generate Span Events, and Beelines—which are the Honeycomb proprietary tracing libraries that were implemented before OpenTelemetry came to town—are no exception. Any event with meta.annotation_type and trace.parent_id (or equivalent) fields set correctly will be understood by Honeycomb to be a Span Event and rendered appropriately.
Let’s take a look at an example using the Python Beeline. I find Span Events have a lot of utility in “tight loop” type of operations that have iterative steps that occur in quick succession (making tracking their timing information by creating a new span a bit clunky) but where teams might still need insight into each step. Let’s say you’re looping over a list in Python and doing some work for each element. You might generate Span Events for each chunk like this, and each one would be stuck onto the parent span instead of generating its own span.
for chunk in workpile:
    results = chunk.do_work()
    beeline.finish_span(beeline.start_span(context={
        "meta.annotation_type": "span_event",
        "name": "chunk_of_work",
        "msg": "Finished work on chunk",
        "chunk_id": chunk_id,
        "results.code": results["code"],
}))Note that we are “finishing” the span as soon as we start it here. Normally, you would preserve the returned span object to pass along to finish_span later after some timed operation took place. In the case of Span Events, however, we don’t care about how long the operation we’re reporting on took. In fact, we probably know it won’t take very long, so we roll it into its parent span.
When we go to look at our traces to understand what’s going on in our system, the Span Events will be available for our perusal in the right hand sidebar.
Unify Traces and Logs with Span Events
Span Events represent a lot of potential for unifying logging and tracing information, and they’re quite new, so it’s an exciting time to be part of their adoption. Perhaps, for instance, you could add wrappers to your log library so that every log message is automatically added to the active span, and then you would have all the contextual info that your logs provide in Honeycomb out-of-the-box on all of your spans.
The fun really starts when you take advantage of Honeycomb’s sophisticated query engine to analyze those Span Events at a high level. Unlike logging tools, Honeycomb rarely makes you painfully wait for your results to return or write custom indices. Instead, everything is indexed by default for a great experience and can help bring your team one step closer to the dream of ending tool fatigue forever.
Give Span Events a whirl today! Or, if you haven’t sent any data along to Honeycomb yet, give us a whirl in our non-gated Play Sandbox. Hope I see you around soon 🙂
Want to know more?
Talk to our team to arrange a custom demo or for help finding the right plan.