Honeycomb was built for the AI era. Learn how to futureproof your software for what comes next.
Discover why Honeycomb is the better choice for your engineers, your customers, and your bottom line.
Start your journey with the definitive guide to observability. Download our complimentary ebook.
Bring observability to every software engineer.
Learn about our company, mission and values.
Come for the impact, stay for the culture.
See Honeycomb's latest press releases, media, and more
Learn more about becoming a Honeycomb partner.
Already a Honeycomb customer?
Liz Fong-Jones
At Honeycomb, we believe in ensuring an awesome developer experience for our own engineering teams; it’s the only way that we can compete with companies that have way more engineers than we do. We’ve historically tried to keep our build times under 15 minutes, taking percussive action when build times got over 15 minutes.
Grady Salzman
As a software engineer, I’m always evaluating tools and technologies that can optimize my workflow. Developer productivity isn’t just about writing more code—it’s about reducing friction, whether that’s context-switching, making repetitive edits, or understanding unfamiliar parts of a codebase. That’s where Copilot comes in: making tasks that once felt monotonous or time-consuming into faster, more intuitive processes.
Alex Boten
The Collector is one of many tools that the OpenTelemetry project provides end users to use in their observability journey. It is a powerful mechanism that can help you collect telemetry in your infrastructure and it is a key component of a telemetry pipeline. The Collector helps you better understand what your systems are doing—but who watches the Collector?
Martin Thwaites
The OpenTelemetry Collector is an exceptional solution for proxying and enhancing telemetry, but it’s also great for generating telemetry from machines too. In this post, we’ll go through a basic, opinionated setup of using the OpenTelemetry Collector to extract metrics and logs from a Windows server.
Rox Williams
Logs are more than just records. With proper log monitoring, they become the honey that sweetens observability. Observability is your ability to understand and optimize your system’s behavior. Turning raw logs into actionable insights requires the right tools, practices, and insights. This blog post is a guide on log monitoring key concepts and best practices for sweetening your observability.
Ken Rimple
In this article, I’ll clear up the confusion around Cross-Origin Resource Sharing (CORS), specifically discussing preflight requests, which are the bane of engineers everywhere.
Another one in the history books: 2024 is (almost!) over. The OpenObservability Talks podcast, hosted by Dotan Horovits, recently featured a lively discussion with Charity Majors, Co-founder and CTO of Honeycomb, to reflect on the trends, achievements, and future of observability.
Ruthie Irvin
All the conditions necessary to alter the career paths of brand new software engineers coalesced—extreme layoffs and hiring freezes in tech danced with the irreversible introduction of ChatGPT and GitHub Copilot. Recession and AI-assisted programming signaled the potential end of a dream to bootcamp-educated juniors.
Jamie Danielson
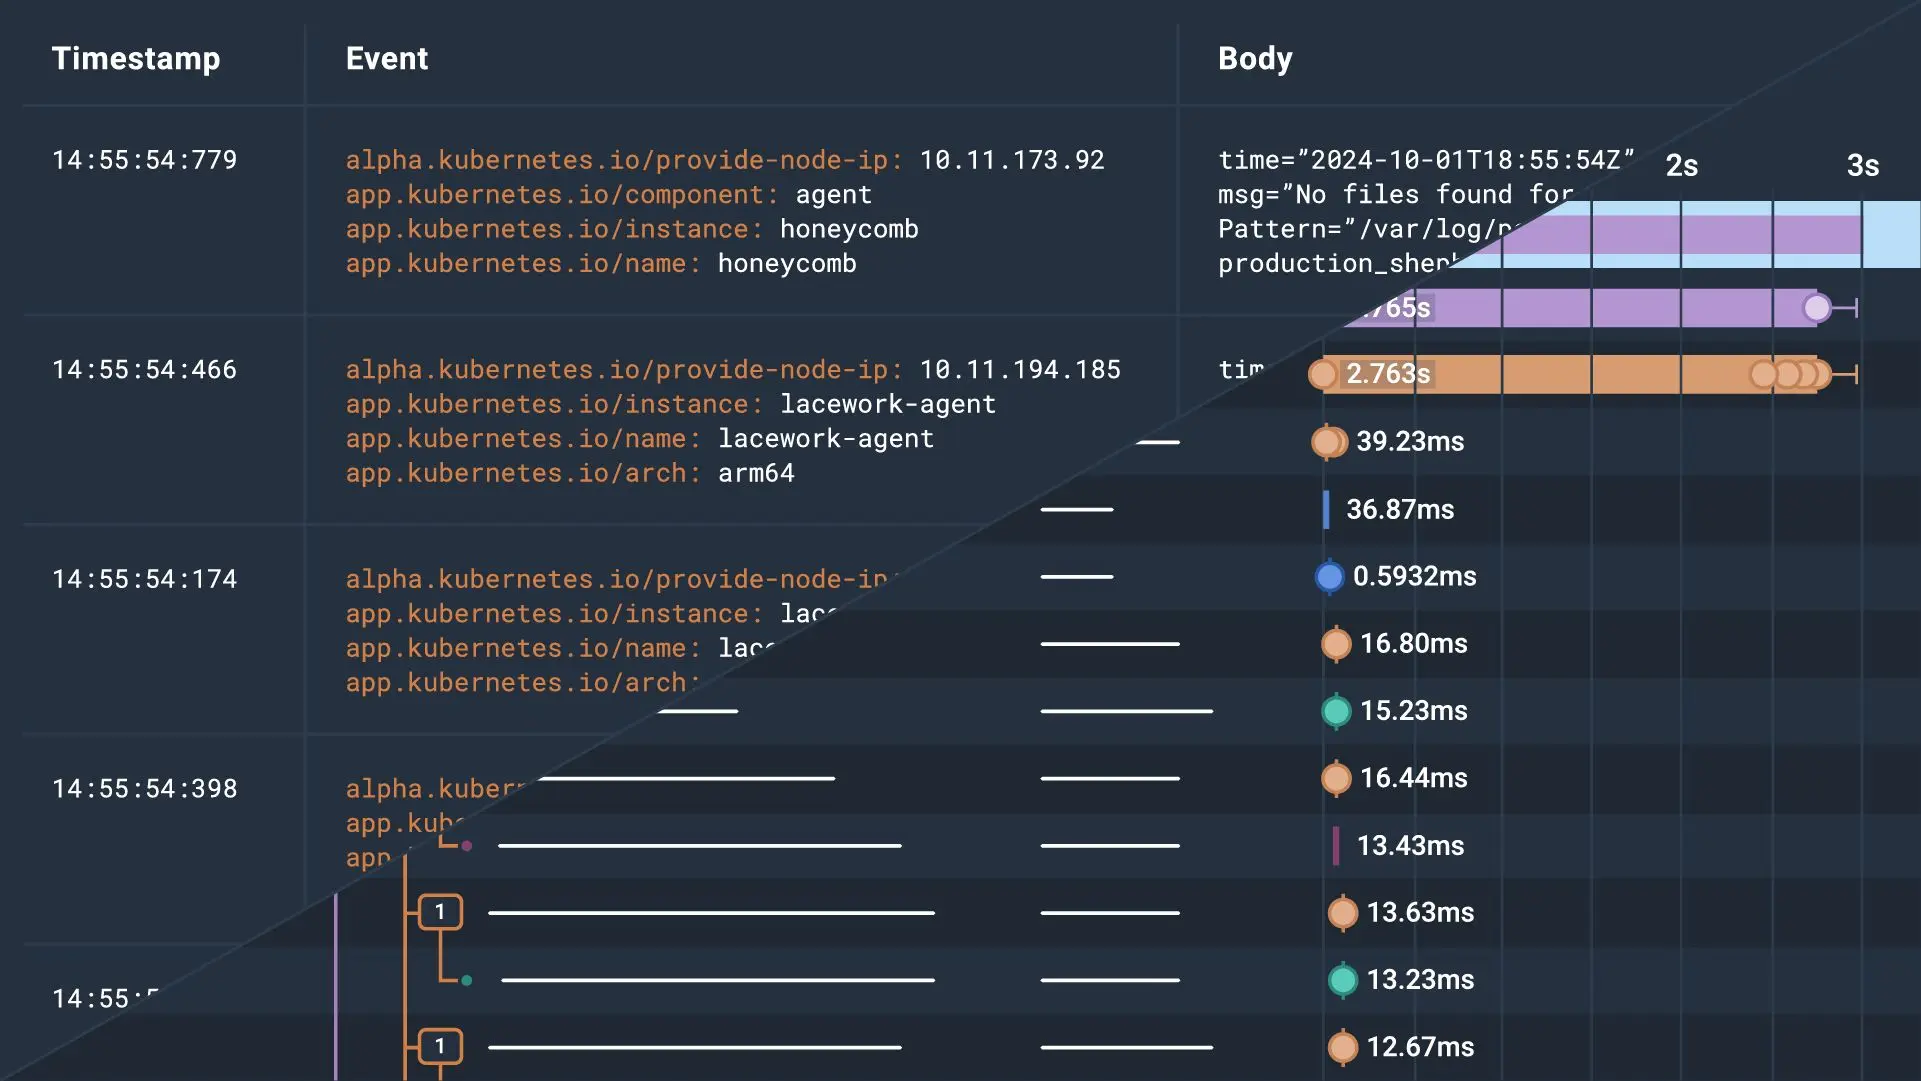
Have you ever had an alert go off that you immediately ignore? It’s a nuisance alert—not actionable—but you keep it around just in case. Or maybe you’ve looked at a trace waterfall and wondered what exactly happened during a gap that just doesn’t drill down deep enough to explain what’s going on. Do you know the feeling where you have just enough information to monitor what’s going on in your systems, but not quite enough to put your mind at ease?
Charity Majors
Honeycomb engineers were amongst the earliest adopters of this technology. Not in the widely parodied top-down, VP-mandated, “go be AI leaders nao plz” kind of way, but in a bottoms-up, experimental kind of way, driven by curiosity and fascination.
Yingrong Zhao
Refinery is a powerful tail-based sampler—but with great power comes great challenges. We heard your feedback and are excited to announce the release of Refinery 2.9, a rather large update that is packed with goodies to make your life easier when running Refinery in your network.
David Chang
Develocity, formerly known as Gradle Enterprise, is a powerful tool that speeds up local and CI build time, helps troubleshoot your builds, and analyzes your data. At Pinterest, we have a dedicated team, Mobile Builds, and we ensure that developers can build fast and often. This enables developers to be more productive by getting faster feedback on their code.
Get it delivered straight to your inbox.
By subscribing to our newsletter, you agree to Honeycomb’s Terms of Service and Privacy Notice.
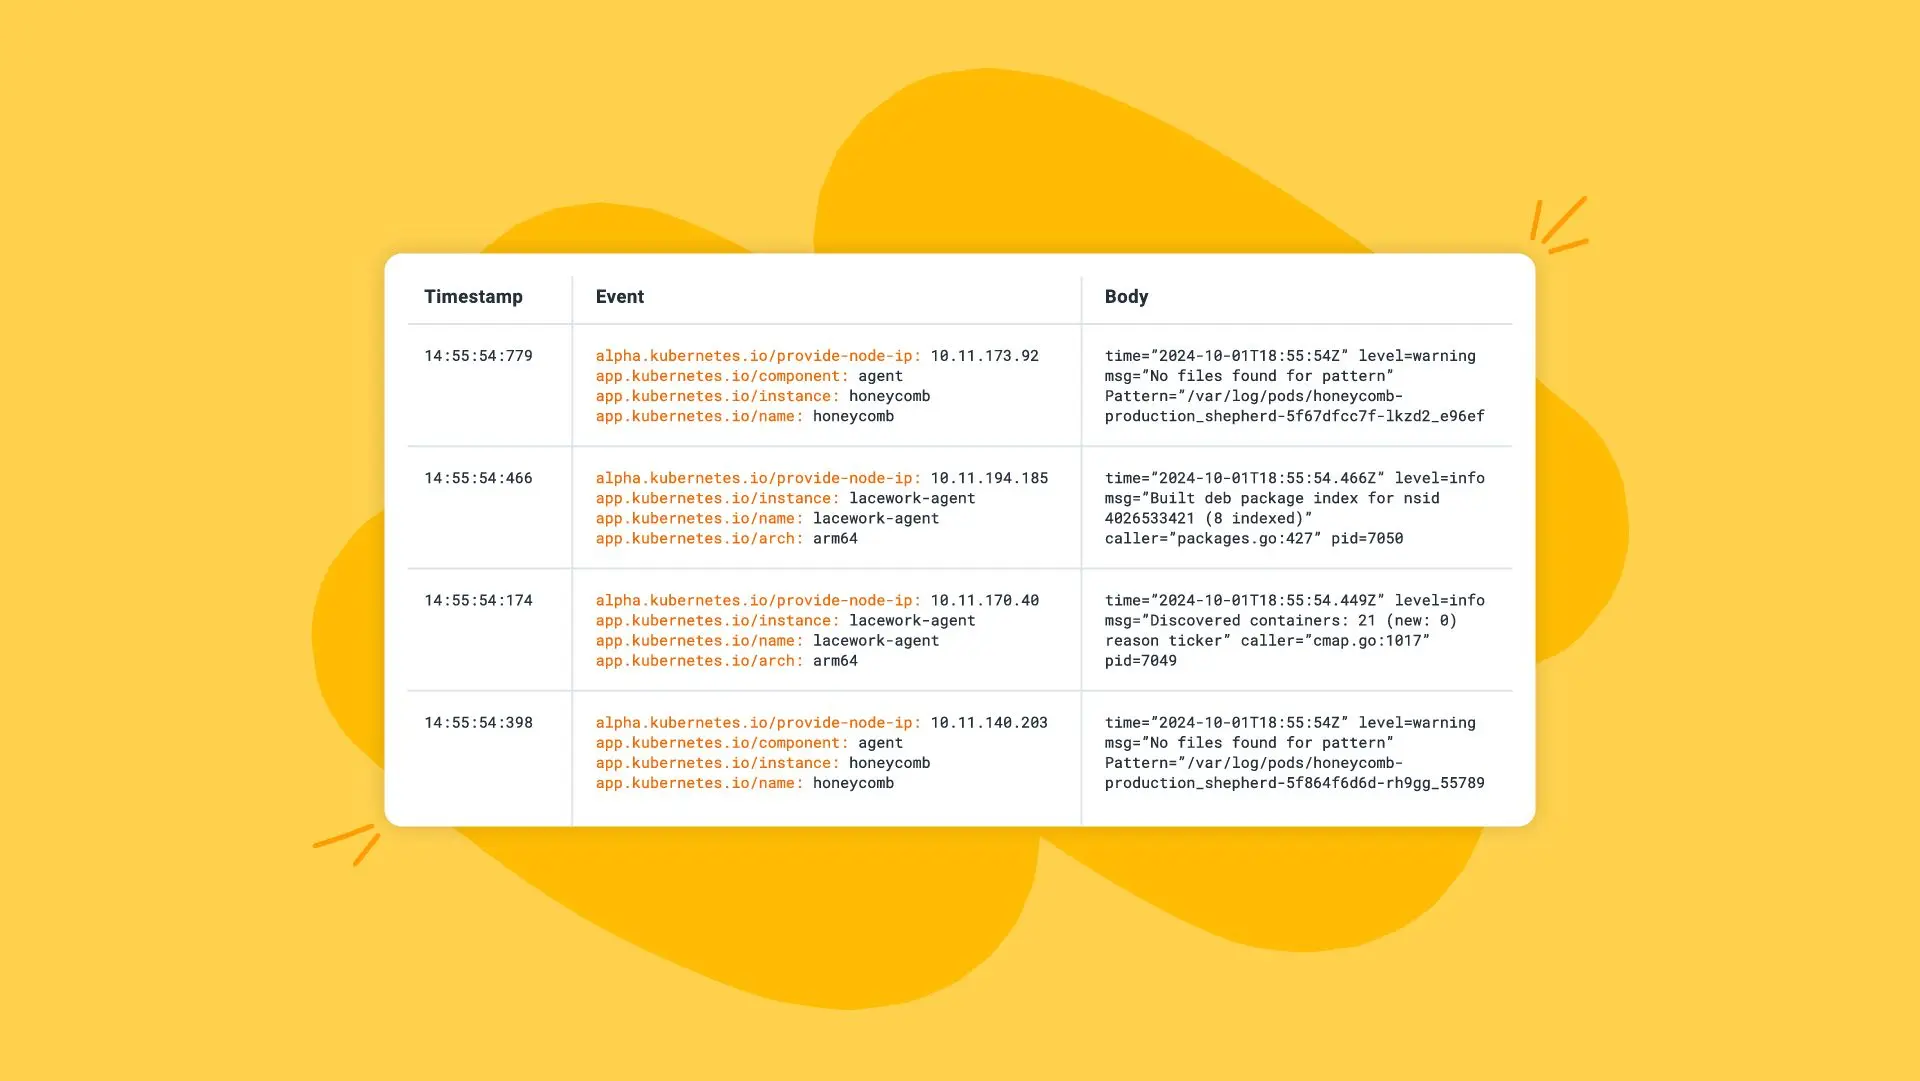
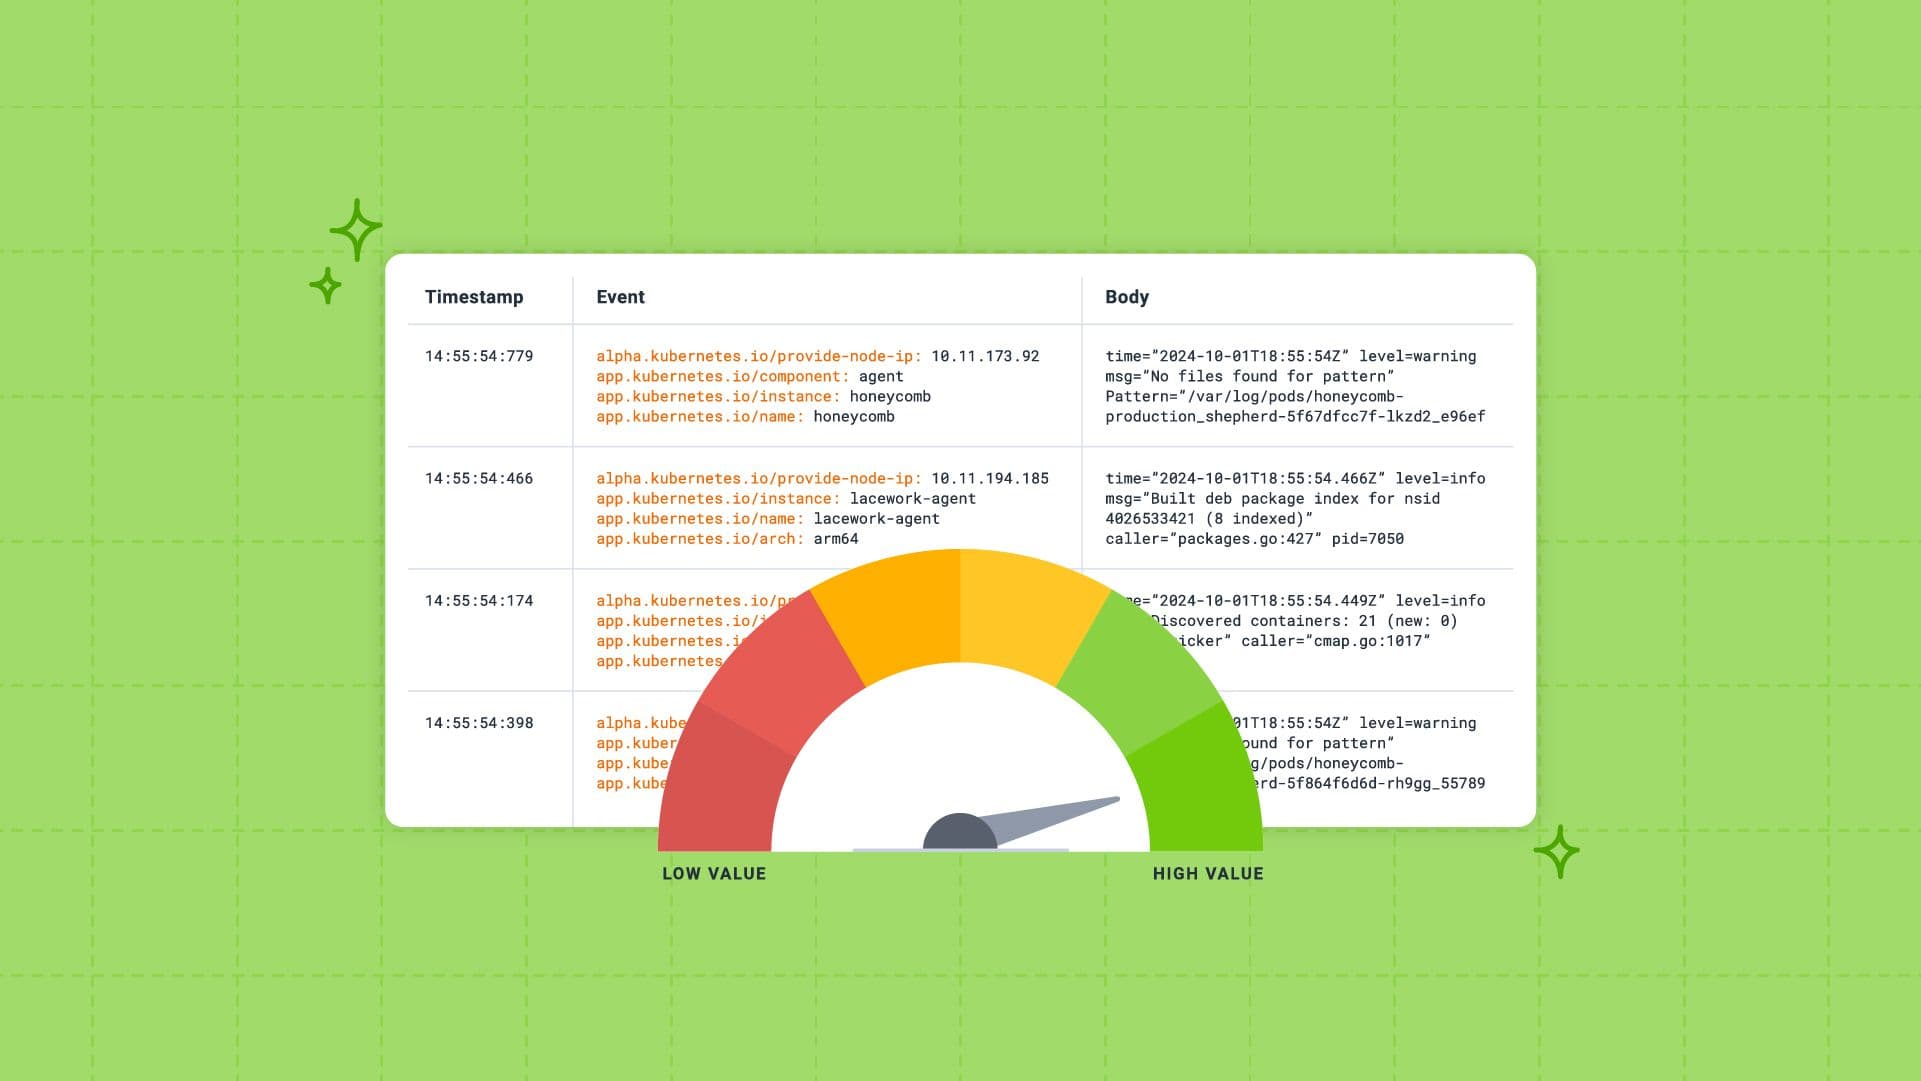
We’re always interested in improving the signal-to-noise ratio of our internal telemetry at Honeycomb. In an effort to reduce the amount of noise in our logs, we looked at reducing and deduplicating the logs emitted by our infrastructure and applications.
So, how do we get JSON logs into a backend analysis system like Honeycomb that primarily accepts OTLP data? In this post, we’ll cover how to use the filelog receiver component in the OpenTelemetry Collector to parse JSON log lines from logs files, as there are a few ways to achieve this.
With more and often smaller processes, cloud-native architectures have driven the need for better insights into our software—a way to look into how these processes fit together. To accomplish this insight, we use an approach that goes beyond traditional monitoring and provides deep insights into system behavior. This approach is cloud observability.
We’ve been talking about observability 2.0 a lot lately; what it means for telemetry and instrumentation, its practices and sociotechnical implications, and the dramatically different shape of its cost model. With all of these details swimming about, I’m afraid we’re already starting to lose sight of what matters. The distinction between observability 1.0 and observability 2.0 is not a laundry list, it’s not marketing speak, and it’s not that complicated or hard to understand. The distinction is a technical one, and it’s actually quite simple.
In the software space, we spend a lot of time defining the terminology that describes our roles, implementations, and ways of working. These terms help us share fundamental concepts that improve our software and let us better manage our software solutions. To optimize your software solutions and help you implement system observability, this blog post will share the key differences between two important terms: traces and logs.
Fred Hebert
About a year ago, Honeycomb kicked off an internal experiment to structure how we do incident response. We looked at the usual severity-based approach (usually using a SEV scale), but decided to adopt an approach based on types, aiming to better play the role of quick definitions for multiple departments put together. This post is a short report on our experience doing it.
Quinn Leong
Earlier this year, we introduced relational fields. Relational fields enable you to query spans based on their relationship to one other within a trace, rather than only in isolation. We’ve now expanded this feature…
Jessica Kerr (Jessitron)
Observability means you know what’s happening in your software systems, because they tell you. They tell you with telemetry: data emitted just for the people developing and operating the software. You already have telemetry–every log is a data point about something that happened. Structured logs or trace spans are even better, containing many pieces of data correlated in the same record. But you want to start from what you have, then improve it as you improve the software.