Search Results


Infinite Retention with OpenTelemetry and Honeycomb
Honeycomb is massively powerful at delivering detailed answers from the last several weeks of system telemetry within seconds. It keeps you in the flow state needed to work through complex system failures while asking question after question to get closer to the answer. The biggest trade-off is the 60 day retention limit.

It’s Time to Version Observability: Introducing Observability 2.0
In 2016, we at Honeycomb first borrowed the term “observability” from the wikipedia entry for control systems observability, where it is a measure of your ability to understand internal system states just by observing its outputs. We then spent a couple of years trying to work out how that definition might apply to software systems. Many twitter threads, podcasts, blog posts, and lengthy laundry lists of technical criteria emerged from that work, including a whole ass book.
OpenTelemetry Best Practices #3: Data Prep and Cleansing
Having telemetry is all well and good—amazing, in fact. It’s easy to do: add some OpenTelemetry auto-instrumentation libraries to your stack and they’ll fill your disks with data pretty quickly. However, having good telemetry data—data that’s curated into being useful—is something that is both cost-effective and represents good value.
The Cost Crisis in Observability Tooling
The cost of services is on everybody’s mind right now, with interest rates rising, economic growth slowing, and organizational budgets increasingly feeling the pinch. But I hear a special edge in people’s voices when it comes to their observability bill, and I don’t think it’s just about the cost of goods sold. I think it’s because people are beginning to correctly intuit that the value they get out of their tooling has become radically decoupled from the price they are paying.

Effective Trace Instrumentation with Semantic Conventions
There’s plenty of literature on the mechanics of instrumenting code with OpenTelemetry and delivering it to Honeycomb. However, I’ve not found many guides on the craft of instrumenting code in order to have a good observability experience in your system. A lot of focus is placed on automatic instrumentation—which is great, particularly if you’re new to observability or retrofitting—but it misses the power of good instrumentation at the application level.
Deploying the OpenTelemetry Collector to Kubernetes with Helm
The OpenTelemetry Collector is a useful application to have in your stack. However, deploying it has always felt a little time consuming: working out how to host the config, building the deployments, etc. The good news is the OpenTelemetry team also produces Helm charts for the Collector, and I’ve started leveraging them. There are a few things to think about when using them though, so I thought I’d go through them here.

Honeycomb, Meet Terraform
The best mechanism to combat proliferation of uncontrolled resources is to use Infrastructure as Code (IaC) to create a common set of things that everyone can get comfortable using and referencing. This doesn’t block the ability to create ad hoc resources when desired—it’s about setting baselines that are available when people want answers to questions they’ve asked in the past.
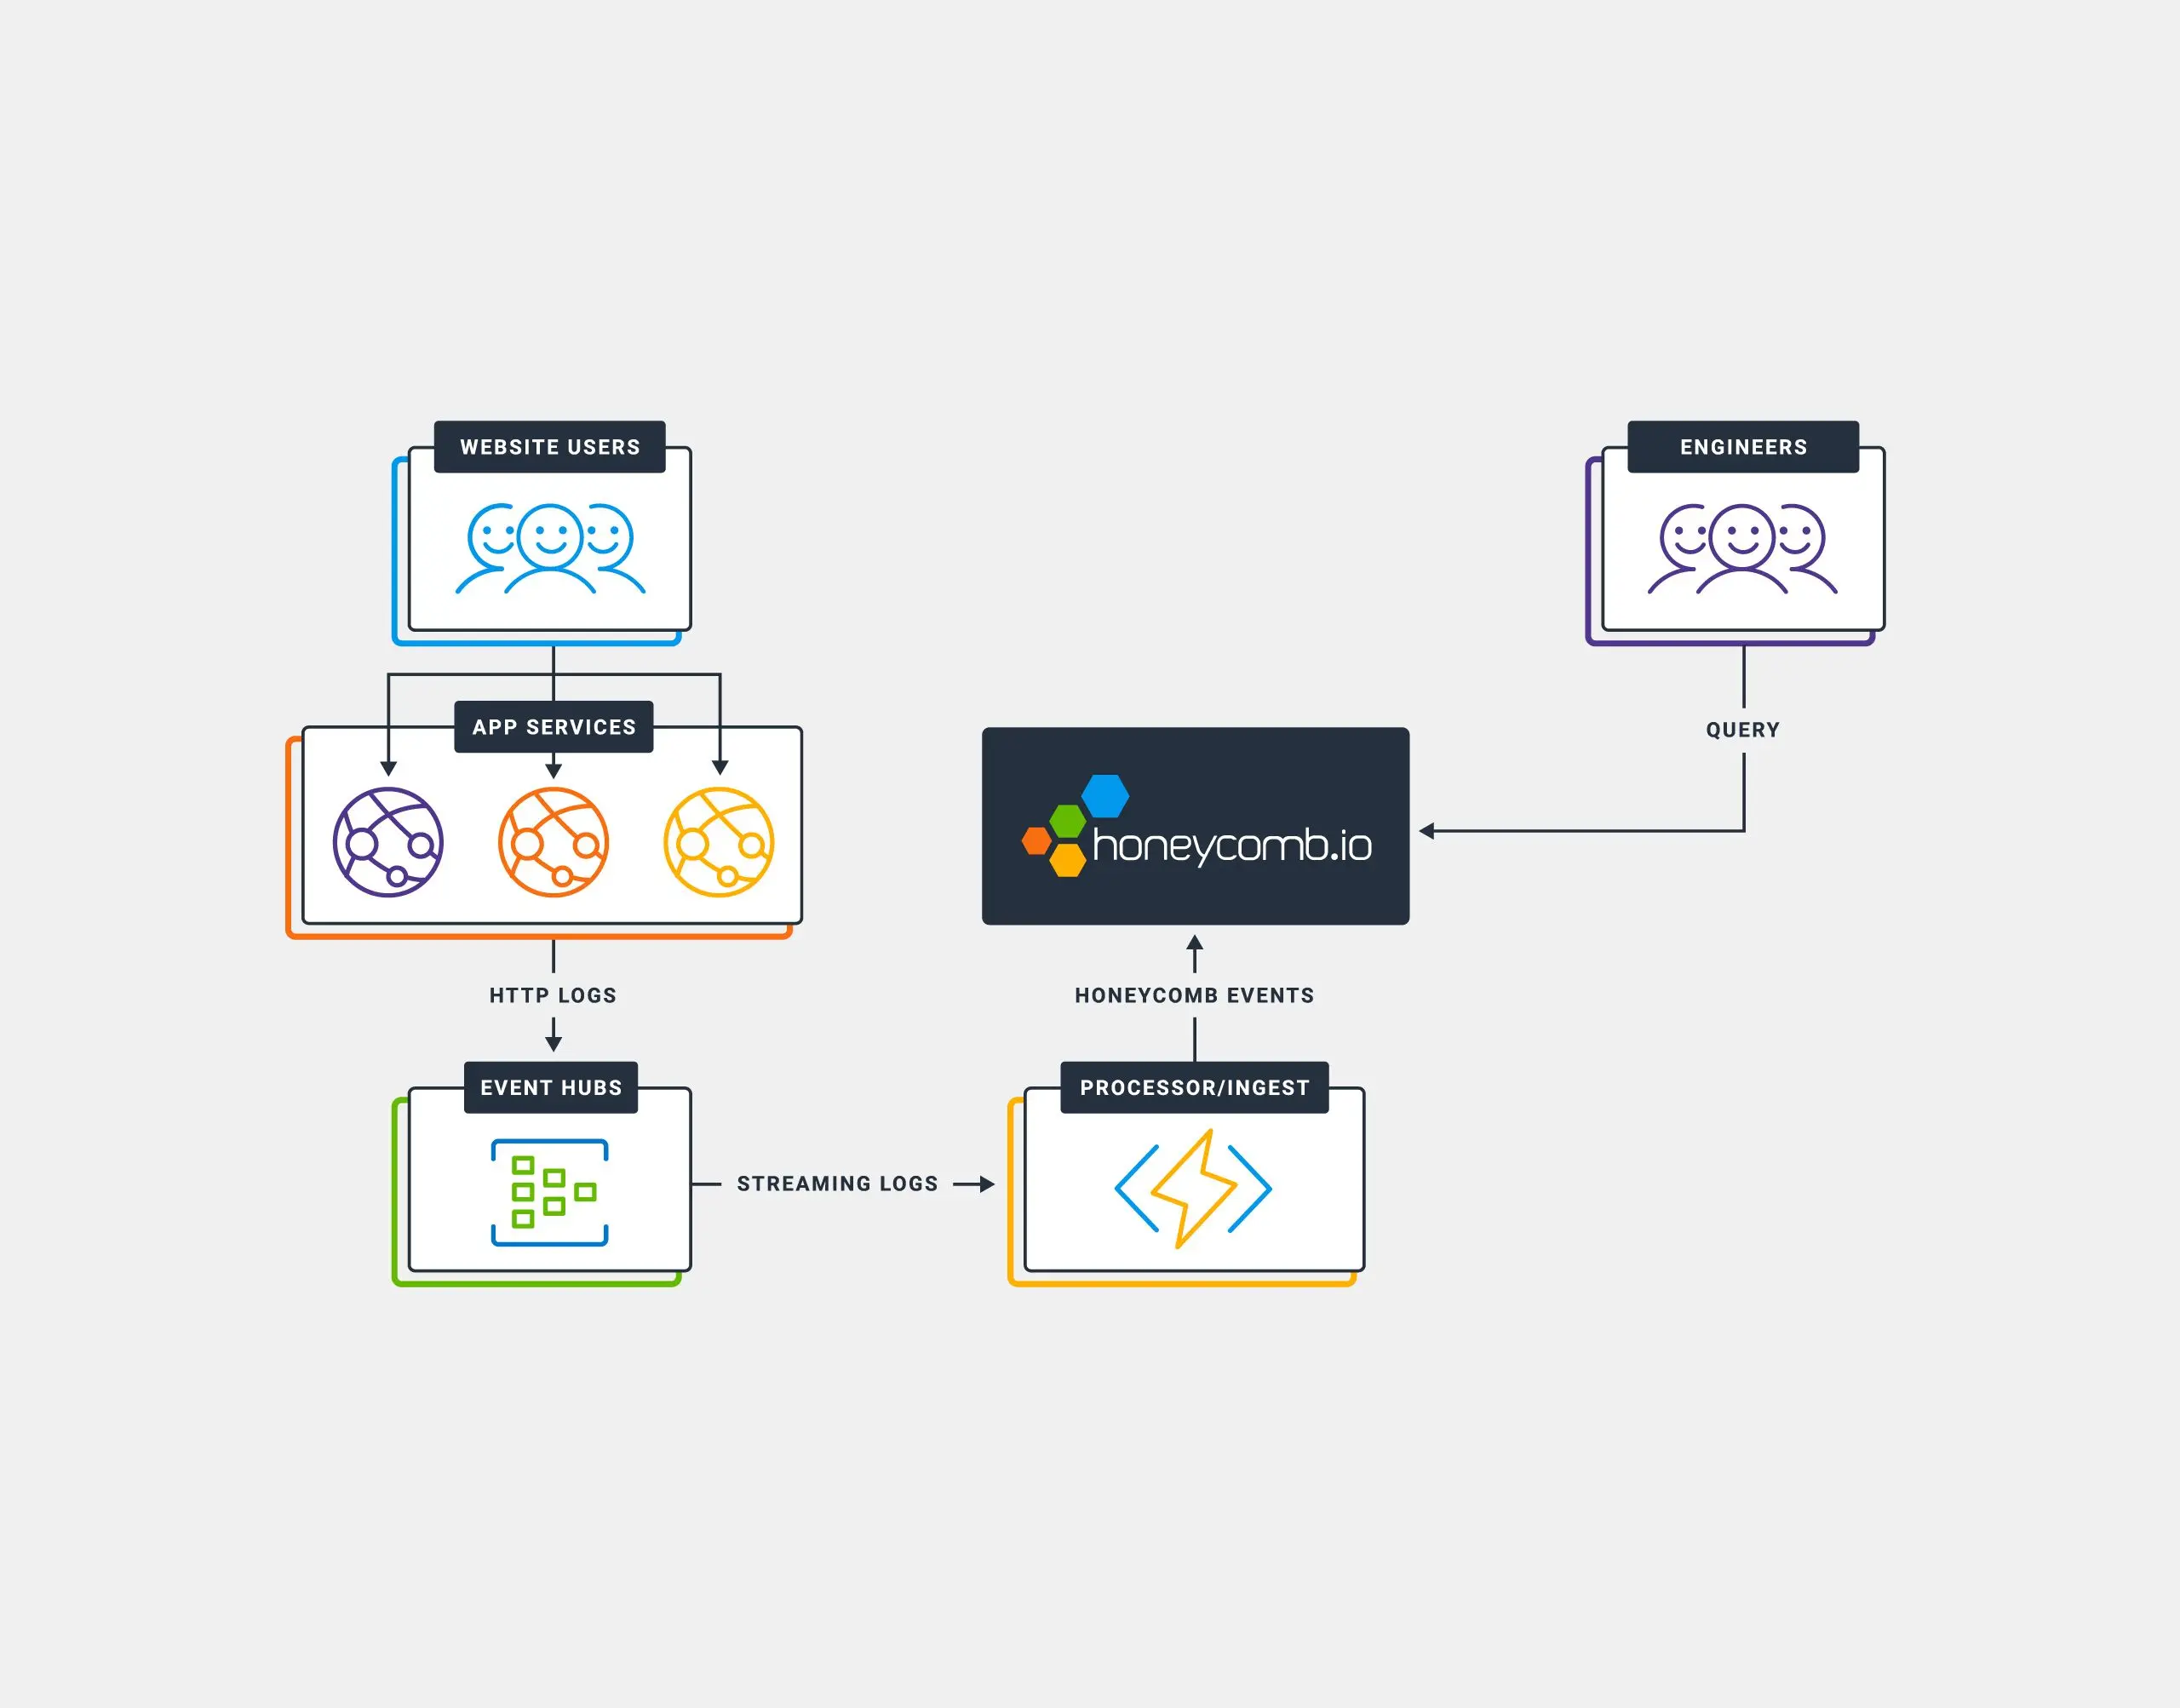
Ingesting HTTP Access Logs from AppService
Debugging application performance in Azure AppService is something that’s quite difficult using Azure’s built-in services (like Application Insights). Among some of the issues are visualizations, and the time it takes to be able to query data. In this post, we’ll walk through the steps to ingest HTTP Access Logs from Azure AppService into Honeycomb to provide for near real-time analysis Access Logs.


Ready to get started?

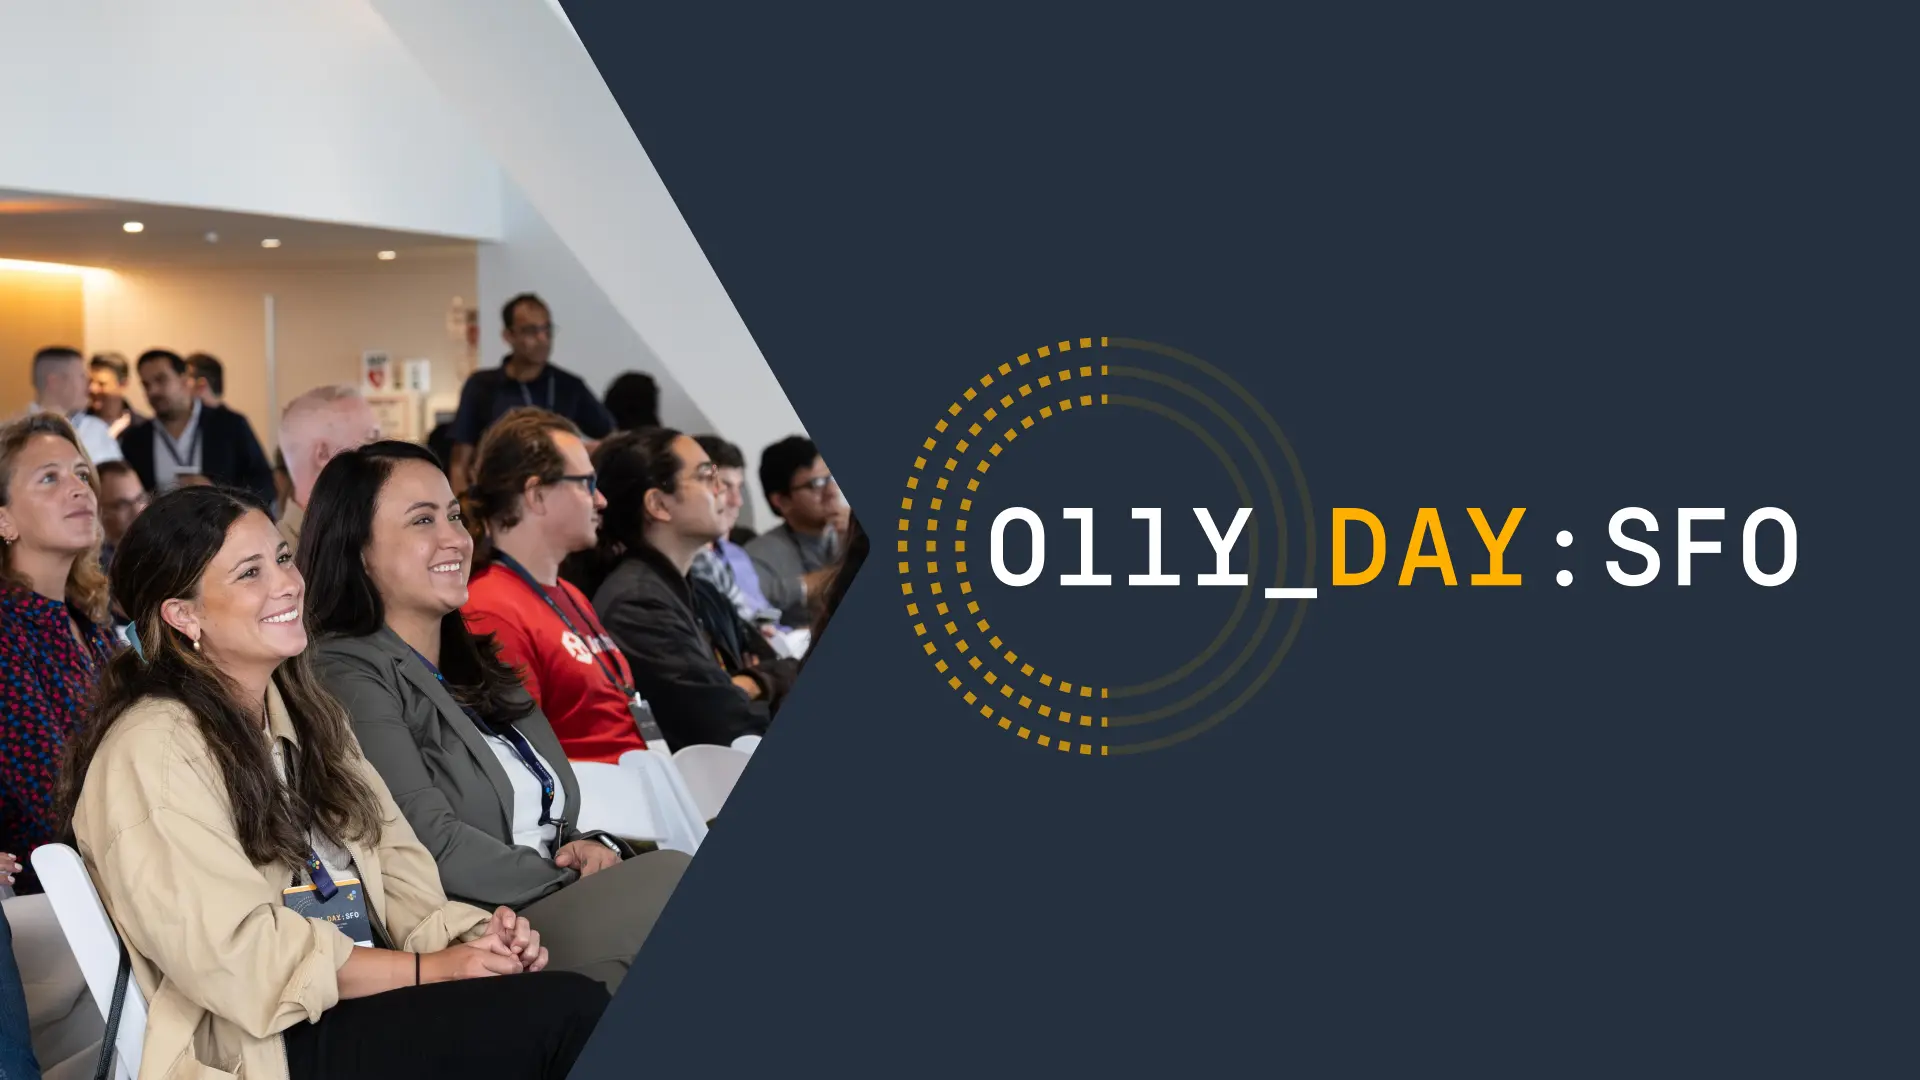
Observability Day San Francisco: The Future of AI and Observability Is Bright
AI and observability are no longer separate conversations—they’re deeply intertwined. Across keynotes, panels, and demos, speakers at Honeycomb's Observability Day San Francisco unpacked what that means for engineering teams today: faster insights, smarter tools, and new challenges to solve.

7 Alternatives to New Relic
New Relic is a well-known application performance monitoring (APM) solution that helps engineers visualize, monitor, and troubleshoot their systems. As businesses evolve, engineers must deliver new capabilities at greater scale and speed, often while managing an increasing number of services and systems. This naturally raises the question: what tools can help?

OpenTelemetry Is Not “Three Pillars”
OpenTelemetry is a big, big project. It’s so big, in fact, that it can be hard to know what part you’re talking about when you’re talking about it! One particular critique I’ve seen going around recently, though, is about how OpenTelemetry is just ‘three pillars’ all over again. Reader, this could not be further from the truth, and I want to spend some time on why.

Frontend Debugging Is Bad and it Should Feel Bad
There’s a sentence that strikes fear into the heart of every frontend developer I’ve ever met: Users are reporting issues, and we don’t know how to replicate them. What do you do when that happens? Do you cry? Do you mark the issue as wontfix and move on? Personally, I took the road less traveled: gave up frontend engineering and moved into product management (this is not actually accurate but it’s a good joke and it feels truthy).