Honeycomb was built for the AI era. Learn how to futureproof your software for what comes next.
Discover why Honeycomb is the better choice for your engineers, your customers, and your bottom line.
Start your journey with the definitive guide to observability. Download our complimentary ebook.
Bring observability to every software engineer.
Learn about our company, mission and values.
Come for the impact, stay for the culture.
See Honeycomb's latest press releases, media, and more
Learn more about becoming a Honeycomb partner.
Already a Honeycomb customer?
Nick Travaglini
As discussed in the first article in this series, a Center of Production Excellence (CoPE) is a more or less formal, provisional subsystem within an organization. Its purpose is to act from within to change that organization so that it’s more capable of achieving production excellence. The series has, to date, focused mainly on how best to construct such a subsystem and what activities it should pursue. In this concluding post, however, I want to return to the point of a CoPE, discuss signs of success, and evaluate the impacts it’s having.
Liz Fong-Jones
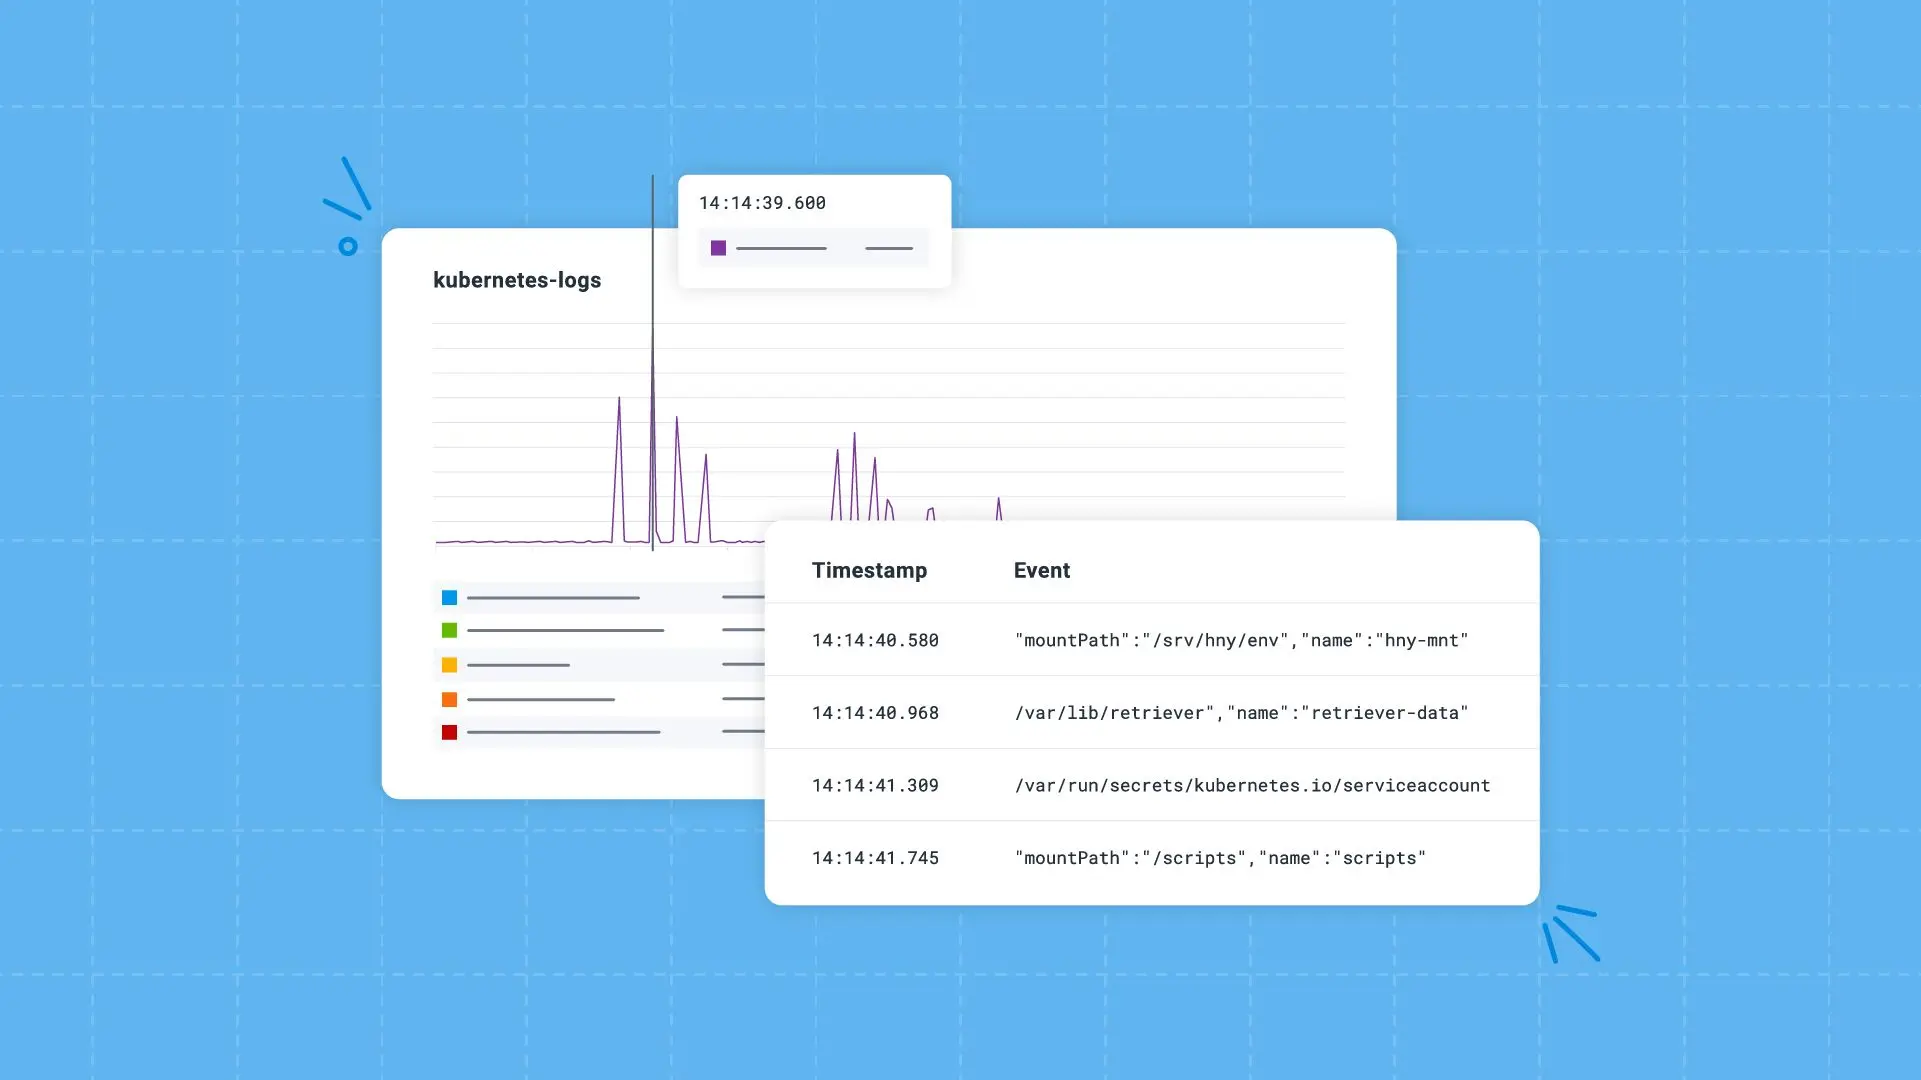
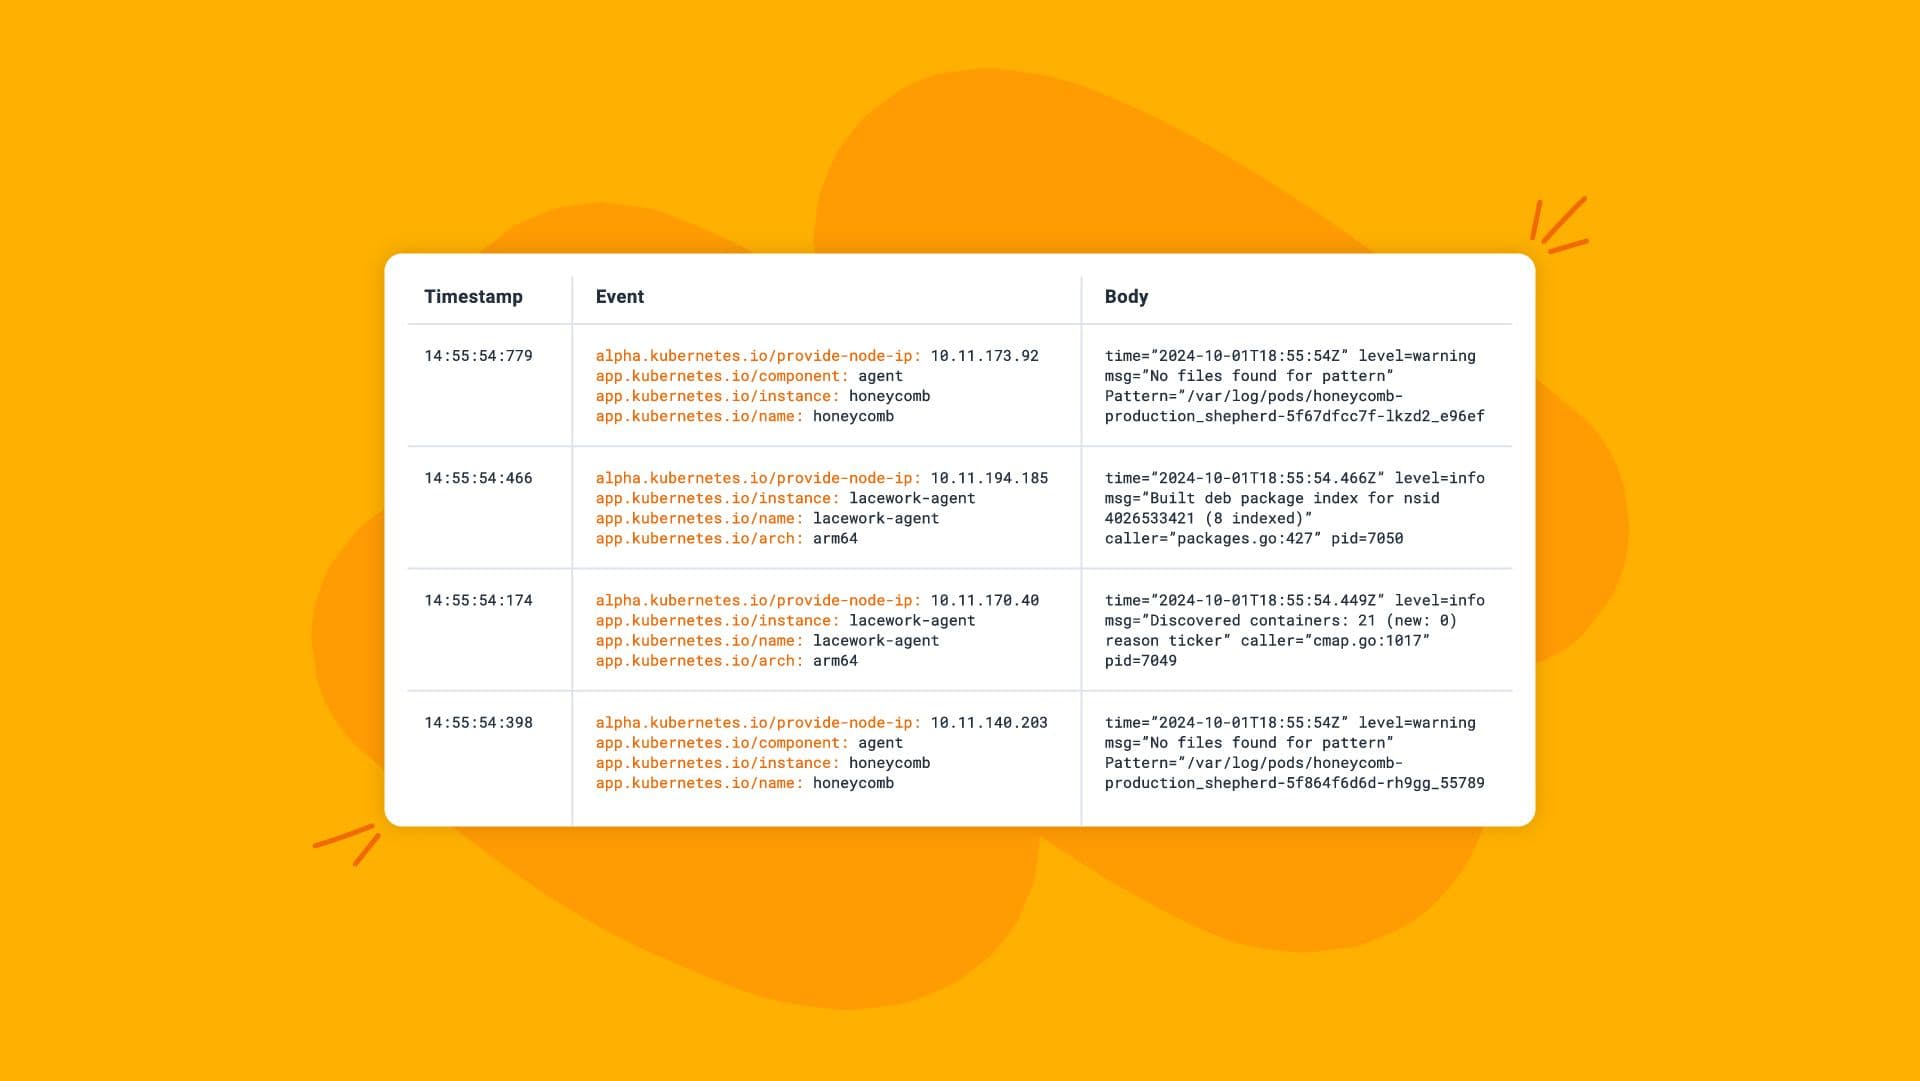
Let’s be real, we’ve never been huge fans of conventional unstructured logs at Honeycomb. From the very start, we’ve emitted from our own codestructured wide events and distributed traces with well-formed schemas. Fortunately (because it avoids reinventing the wheel) and unfortunately (because it doesn’t adhere to our standards for observability) for us, not all the software we run is written by us. And Kubernetes is a prime example of such a load-bearing part of our infrastructure.
Mei Luo
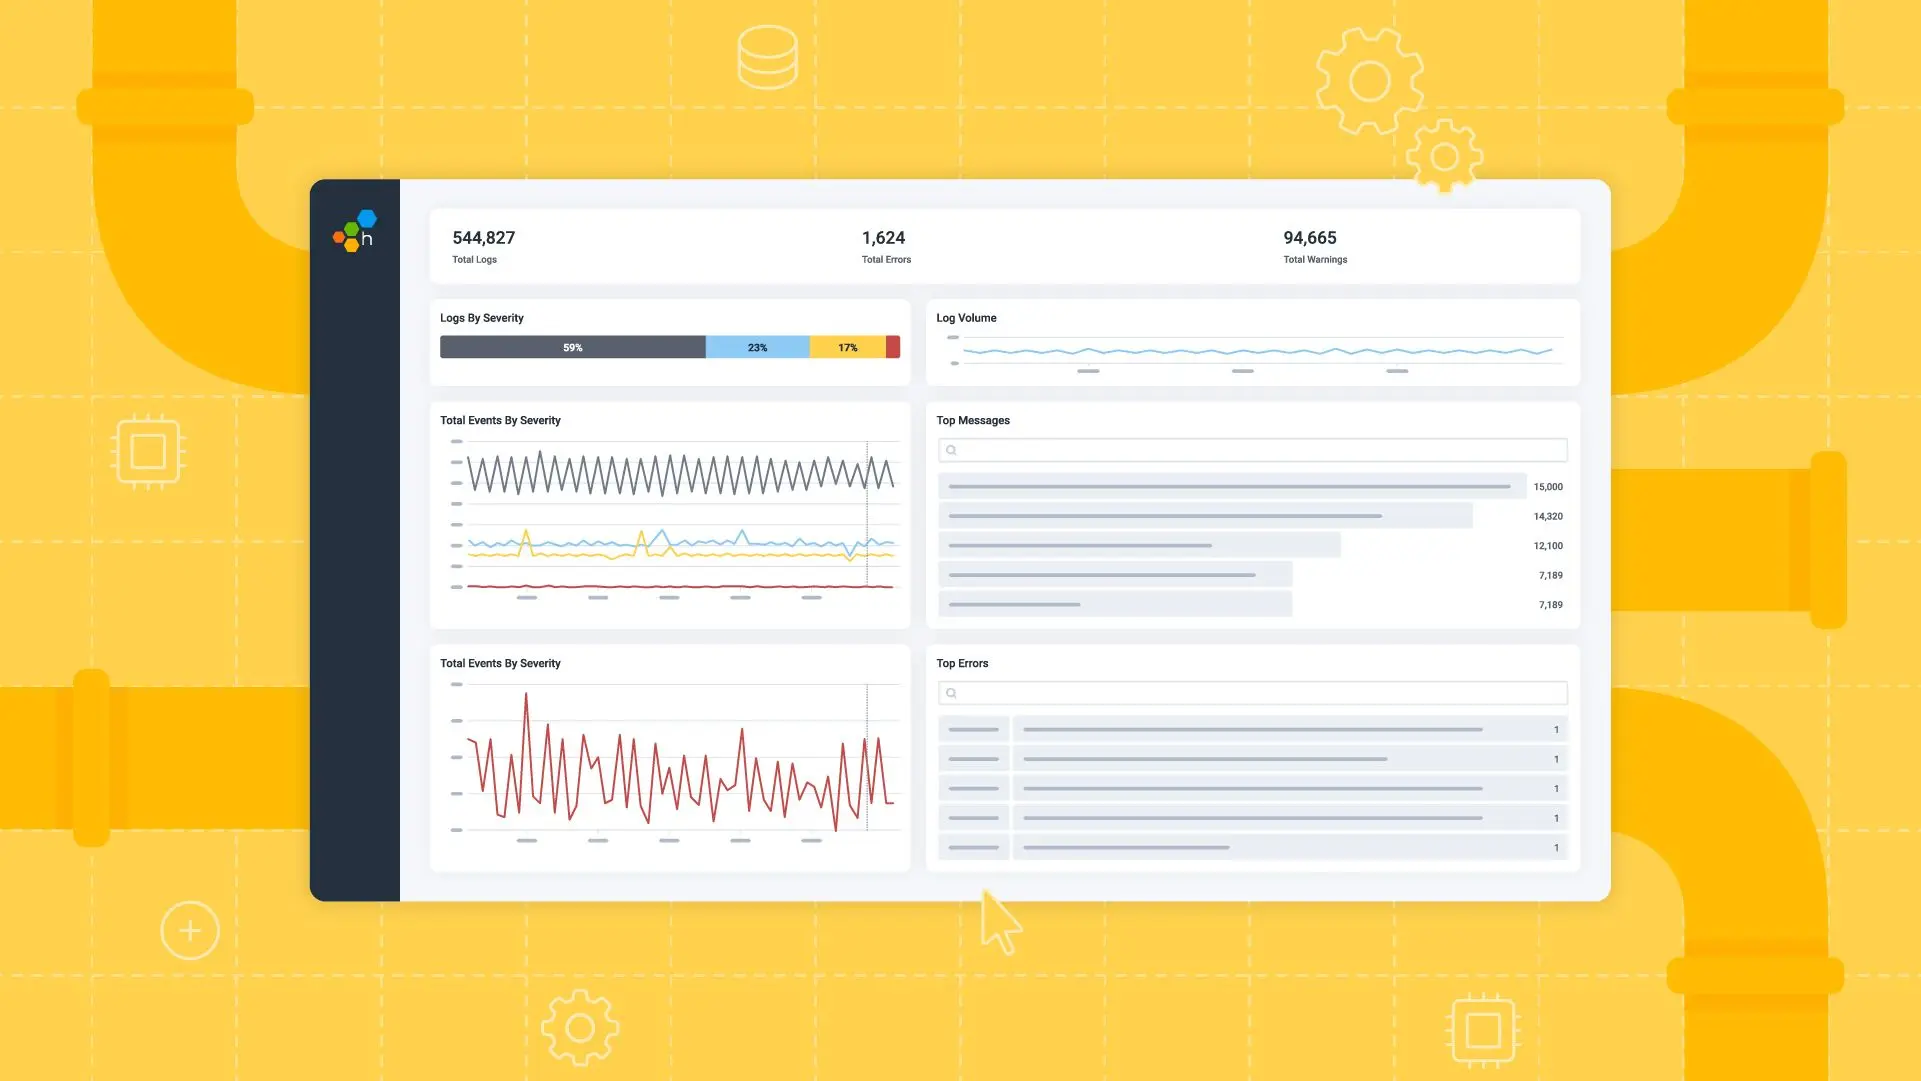
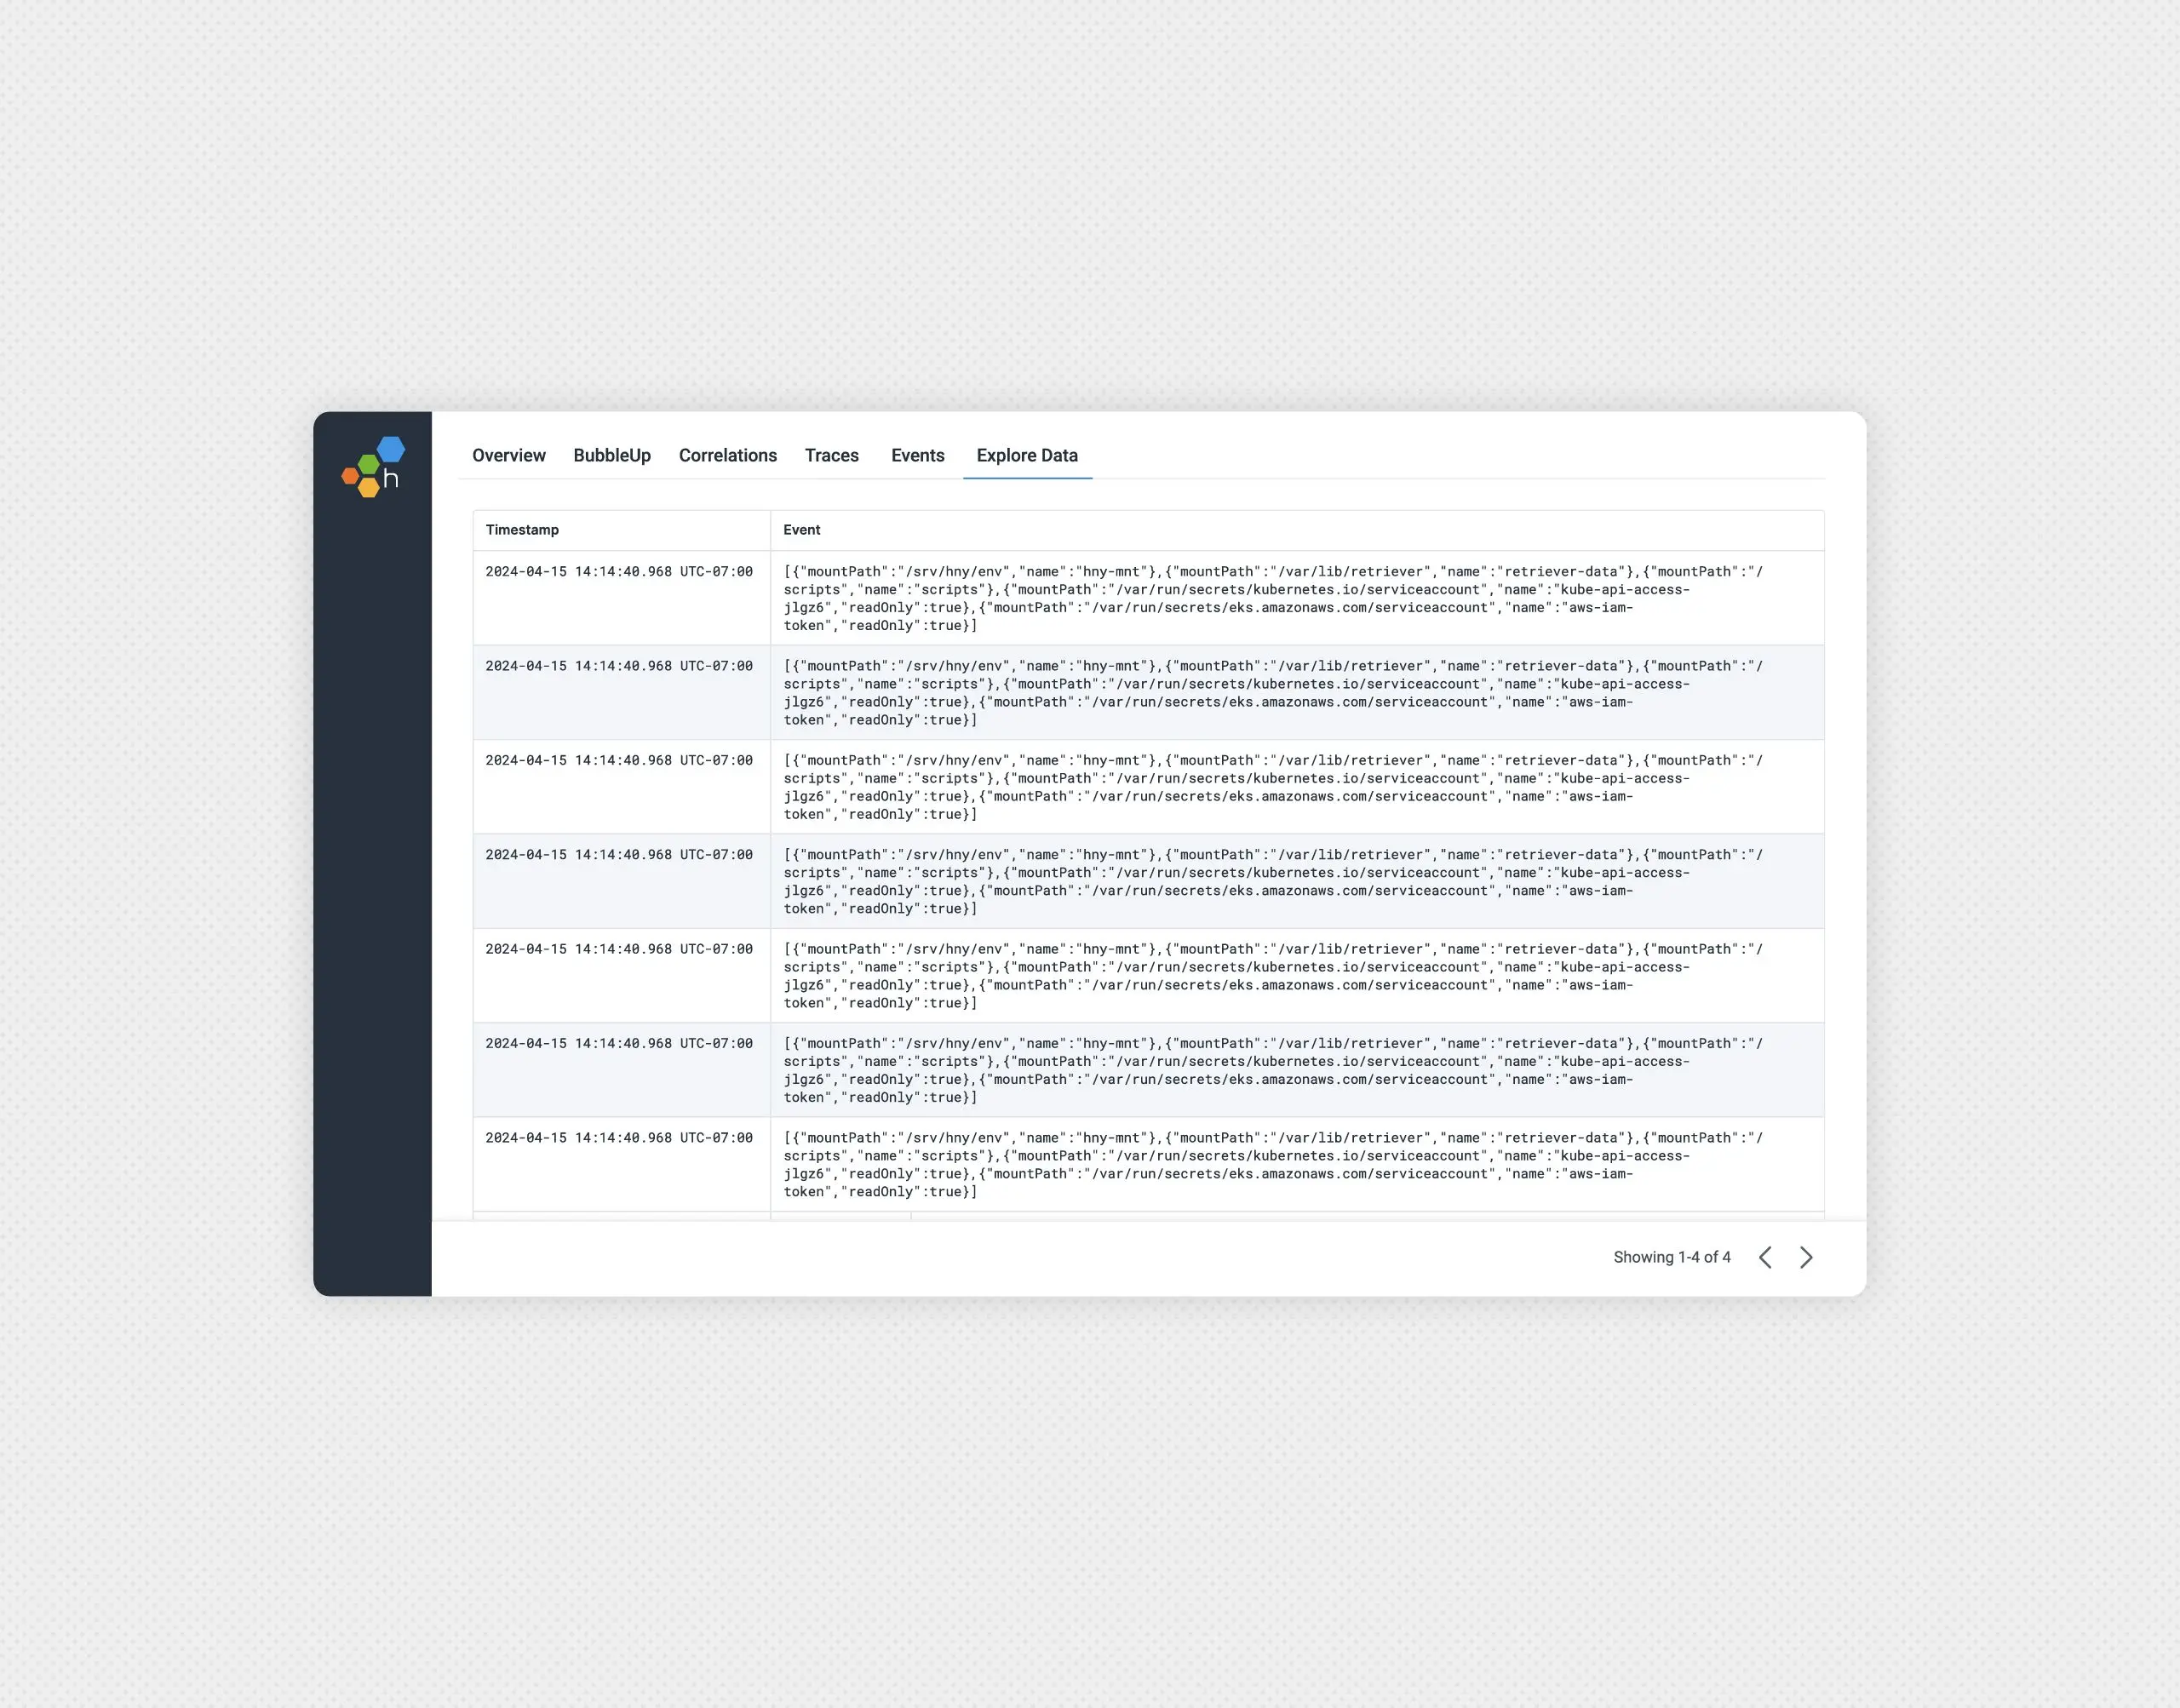
At Honeycomb, we know how important it is for organizations to have a unified observability platform. This is why we’re launching Honeycomb Telemetry Pipeline and Honeycomb for Log Analytics: to enable engineering teams to send and analyze data—including logs—into a single, unified platform.
Elsie Phillips
Over the past six weeks, we introduced a series of impactful updates aimed at making your observability workflows faster, more unified, and more collaborative. Here’s a snapshot of what we worked on.
Frontend development has evolved rapidly over the past decade, but one challenge remains constant: understanding what’s happening in real-time across diverse browsers, environments, and user interactions. This is where observability steps in—but how does it apply to the frontend world where user experience can break in countless, unexpected ways?
Fahim Zaman
Real user monitoring (RUM) began as a straightforward approach to tracking basic web performance metrics. Focused on things like page load times and response rates, RUM relied on server-side logging and simple browser timings. While these tools captured Core Web Vitals (CWVs), they offered limited insights into how users actually interacted with pages, focused mainly on server-side performance.
Jessica Kerr (Jessitron)
Oh no, I’m getting out-of-memory errors! How much memory is my app using? To find out, we go look for a metric that tells us how much memory is available, and we graph it around the time that our errors occurred.
Winston Hearn
Recently, we announced the launch of Honeycomb for Frontend Observability, our new solution that helps frontend developers move from traditional monitoring to observability. What this means in practice is that frontend developers are no longer limited to a metrics view of their app that can only be disaggregated in a few dimensions. Now, they can enjoy the full power of observability, where their app collects a broad set of data as traces to enable much richer analysis of the state of a web service.
Kent Quirk
Refinery is Honeycomb’s sampling proxy, which our largest customers use to improve the value they get from their telemetry. It has a variety of interesting samplers to choose from. One category of these is called dynamic sampling. It’s basically a technique for adjusting sample rates to account for the volume of incoming data—but doing so in a way that rare events get more priority than common events.
Fred Hebert
We’ve posted before about how engineers on call at Honeycomb aren’t expected to do project work, and that whenever they’re not dealing with interruptions, they’re free to work on whatever will make the on-call experience better.
Tyler Helmuth
As our software complexity increases, so does our telemetry—and as our telemetry increases, it needs more and more tweaking en route to its final destination. You’ve likely needed to change an attribute, parse a log body, or touch up a metric before it landed in your backend of choice.
Observability has traditionally been backend-focused, but the frontend is just as hard—if not harder—to debug and has simply outgrown current monitoring tools. Engineers working with the frontend need the ability to see every user interaction with their system—and all the rich context around it. They need observability for the frontend. Today, we’re proud to announce that Honeycomb for Frontend Observability is now generally available.
Get it delivered straight to your inbox.
By subscribing to our newsletter, you agree to Honeycomb’s Terms of Service and Privacy Notice.
In this post, I’m going to walk through how you can use Honeycomb for Frontend Observability to debug INP, which was just promoted to a stable Core Web Vital in March. The Honeycomb-specific steps in this post are applicable to debugging CLS and LCP as well, and Honeycomb’s instrumentation package captures attribution data for all three metrics.
Rox Williams
The best DevOps and SRE teams have shifted their approach to monitoring and logging their systems. These teams debug problems cohesively and rationally, regardless of the system’s complexity. Gone are the days of having a slew of logs that fail to explain the cause of alerts, system failures, and other unknowns.
Building a center of production excellence (CoPE) starts with indexing on production. Here’s why. Odds are that a software engineer today is really focused on one place: pre-prod. Short for “pre-production,” this is slang for an environment where software code operates in a prototype phase of its development lifecycle. Common sense would have one believe that this is a safe space, a workbench of sorts, where problems can be found and remediated. Then, once engineers are reasonably certain everything’s working properly, they advance it to a matching environment called production, where the code behaves like it did in pre-prod and it merely needs to be managed by an operations team. That story is a comforting lie.
At this point, it’s almost passé to write a blog post comparing events to the three pillars. Nobody really wants to give up their position. Regardless, I’m going to talk about how great events are and use some analogies to try to get that across. Maybe these will help folks learn to really appreciate them and to depreciate a certain understanding of the three pillars. Or maybe not.
Austin Parker
One of the things about OpenTelemetry that’s easy to miss if you’re not spending the whole day in the ins and outs of the project is just how much stuff it can do—but that’s what I’m here for! Today, I want to go through the project and give you a guide to the various parts of OpenTelemetry, how mature they are, and what you can expect over the next six months or so. I ranked these elements by relative maturity across the entire project. As such, the stuff marked ‘very ready’ is the most stable, while the stuff marked ‘an adventure’ is less stable. Let’s dive in!
Charity Majors
In 2016, we at Honeycomb first borrowed the term “observability” from the wikipedia entry for control systems observability, where it is a measure of your ability to understand internal system states just by observing its outputs. We then spent a couple of years trying to work out how that definition might apply to software systems. Many twitter threads, podcasts, blog posts, and lengthy laundry lists of technical criteria emerged from that work, including a whole ass book.
Whether you’re using logs to debug issues, keeping an eye on system performance, or protecting your infrastructure, good log management hygiene can make a huge difference. In this article, we’ll teach you the basics of log management, why it’s so important, and how you can contribute to important business goals.
Brian Chang
Engineering has come a long way since the days of delivering discrete, point-in-time products that were often packaged on a CD and shipped to customers. The days of physical media and long development cycles are long gone. The advent of cloud computing and the rise of Software-as-a-Service (SaaS) transformed the landscape, creating a new model of continuous development and service delivery. This shift has not only revolutionized how software is developed, but has also redefined the engineer’s role.