Honeycomb was built for the AI era. Learn how to futureproof your software for what comes next.
Discover why Honeycomb is the better choice for your engineers, your customers, and your bottom line.
Start your journey with the definitive guide to observability. Download our complimentary ebook.
Bring observability to every software engineer.
Learn about our company, mission and values.
Come for the impact, stay for the culture.
See Honeycomb's latest press releases, media, and more
Learn more about becoming a Honeycomb partner.
Already a Honeycomb customer?
Charity Majors
Your data doesn’t become linearly more powerful as you add more context, it becomes exponentially, combinatorially more powerful with each added attribute.
Kale Bogdanovs
This guide gives you a more rigorous framework for evaluating observability tools in an era where your AI assistant depends on them as much as your engineers do. The criteria that matter most are not the ones that show up first in a sales cycle.
Jessica Kerr (Jessitron)
The best dashboard is one created just for your application, or your service, or your team. You can get that in minutes with the Honeycomb MCP.
Rox Williams
Charity took the time to answer a few additional audience questions we didn’t get to. Dive in below!
When we left Facebook, we were determined to build a tool that would help solve the hardest problems in software. Not by copying everyone else’s architectural hand-me-downs and making incremental improvements, but by borrowing from powerful BI and product tools, and reasoning from first principles about what software engineers need to understand their code in production.
Alex Vondrak
In my previous post, we explored why Honeycomb is implemented as a distributed column store. Just as interesting to consider, though, is why Honeycomb is not implemented in other ways. So in this post, we’re going to dive into the topic of time series databases (TSDBs) and why Honeycomb couldn’t be limited to a TSDB implementation.
In Charity's recent webinar with James Governor of RedMonk, she shared that most companies now spend somewhere between 20 and 25% of their entire infrastructure budget on their observability tools.
Emil Protalinski
Software systems are increasingly complex. Applications can no longer simply be understood by examining their source code or relying on traditional monitoring methods. The interplay of distributed architectures, microservices, cloud-native environments, and massive data flows requires an increasingly critical approach: observability.
Ken Rimple
AI and observability are no longer separate conversations—they’re deeply intertwined. Across keynotes, panels, and demos, speakers at Honeycomb's Observability Day San Francisco unpacked what that means for engineering teams today: faster insights, smarter tools, and new challenges to solve.
Observability tools like Honeycomb are built for engineers, not PM teams… but that doesn’t mean there’s no benefit to having your PMs in Honeycomb. Whether it’s debugging a weird customer issue or tracking how a feature is used in the wild, observability gives PMs something traditional product tools can’t: real-time answers with full context, down to a single user.
New Relic is a well-known application performance monitoring (APM) solution that helps engineers visualize, monitor, and troubleshoot their systems. As businesses evolve, engineers must deliver new capabilities at greater scale and speed, often while managing an increasing number of services and systems. This naturally raises the question: what tools can help?
Jason Harley
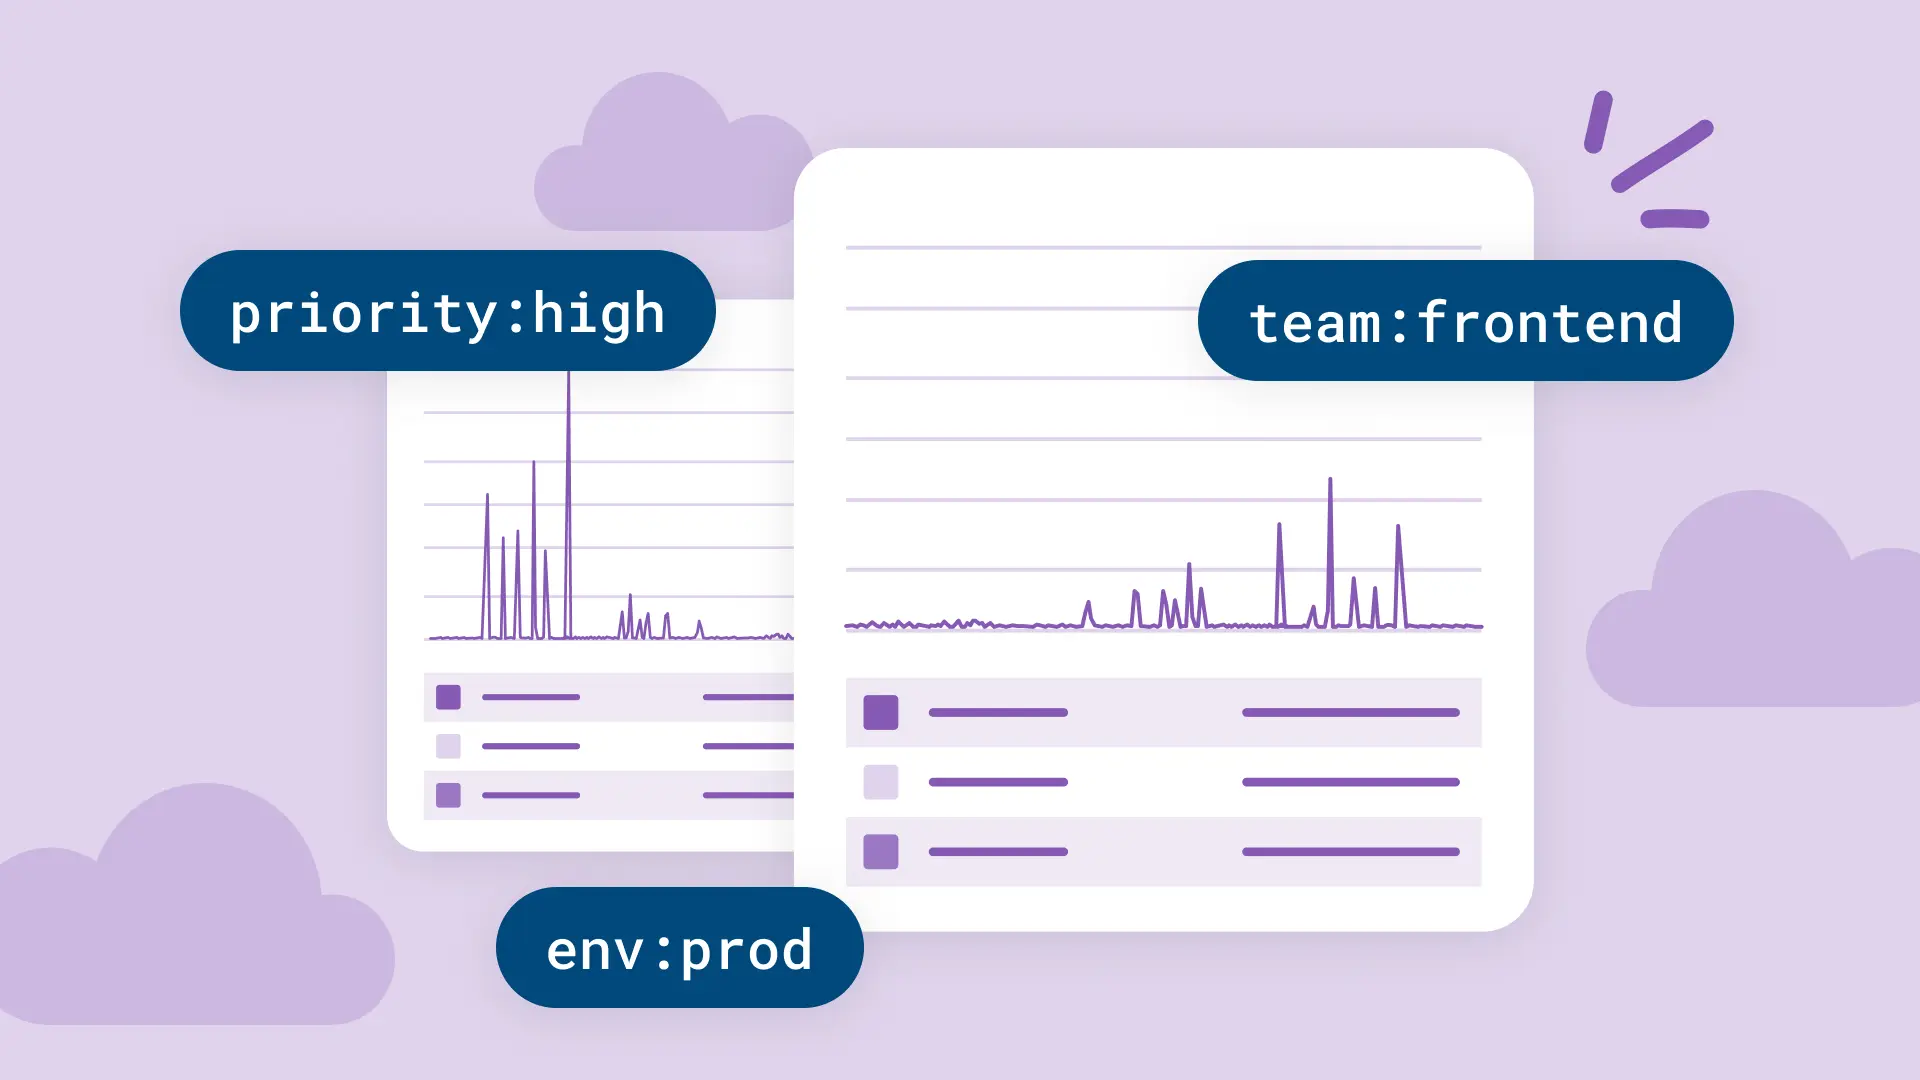
We're thrilled to announce that Honeycomb Tags are now generally available across SLOs, triggers, and boards! Over 100 customers are already actively tagging their observability resources in Honeycomb today.
Get it delivered straight to your inbox.
By subscribing to our newsletter, you agree to Honeycomb’s Terms of Service and Privacy Notice.
Julie Neumann
Irving Popovetsky
Colin Burke
Austin Parker
In a really broad sense, the history of observability tools over the past couple of decades have been about a pretty simple concept: how do we make terabytes of heterogeneous telemetry data comprehensible to human beings?
We recently had the privilege of hosting several industry experts and technology executives across platform strategy, SRE, and engineering enablement for breakfast at our Observability Day in London.
Martin Thwaites
Elsie Phillips
You shipped your latest release. You tested it on emulators, QA devices, and the latest OS versions. But now it’s live and running on thousands or millions of real devices, across a jungle of screen sizes, hardware specs, OS versions, and network conditions. A user reports a crash on an old Samsung device over 3G. Someone else complains the app feels “sluggish” after updating. You dig through logs. Rebuild test cases. Ping the backend team. Try to reproduce. Yet, still no answers.
Martin Holman
The HTTP Content-Security-Policy response header is used to control how the browser is allowed to load various content types. It is used to control which URLs, fonts, images, scripts, and more can be loaded…