Honeycomb was built for the AI era. Learn how to futureproof your software for what comes next.
Discover why Honeycomb is the better choice for your engineers, your customers, and your bottom line.
Start your journey with the definitive guide to observability. Download our complimentary ebook.
Bring observability to every software engineer.
Learn about our company, mission and values.
Come for the impact, stay for the culture.
See Honeycomb's latest press releases, media, and more
Learn more about becoming a Honeycomb partner.
Already a Honeycomb customer?
Nick Travaglini
Here at Honeycomb, we emphasize that organizations are sociotechnical systems. At a high level, that means that “wet-brained” people and the stuff they do is irreducible to “dry-brained” computations. That cashes out as the inability to ultimately remove or replace people in organizations with computers, in spite of what artificial general intelligence (AGI) ideologues would have you believe. The best that such artifacts can do is “relieve labor-intensive toil,” as my colleagues Charity and Phillip put it.
Martin Thwaites
With more and more people adopting OpenTelemetry and specifically using the tracing signal, I’ve seen an uptick in people wanting to add the entire request and response body as an attribute. This isn’t ideal, as it wasn’t when people were logging the body as text logs. In this blog post, I’ll explain why this is a bad idea, what are the pitfalls, and more importantly, what you should do instead.
Rox Williams
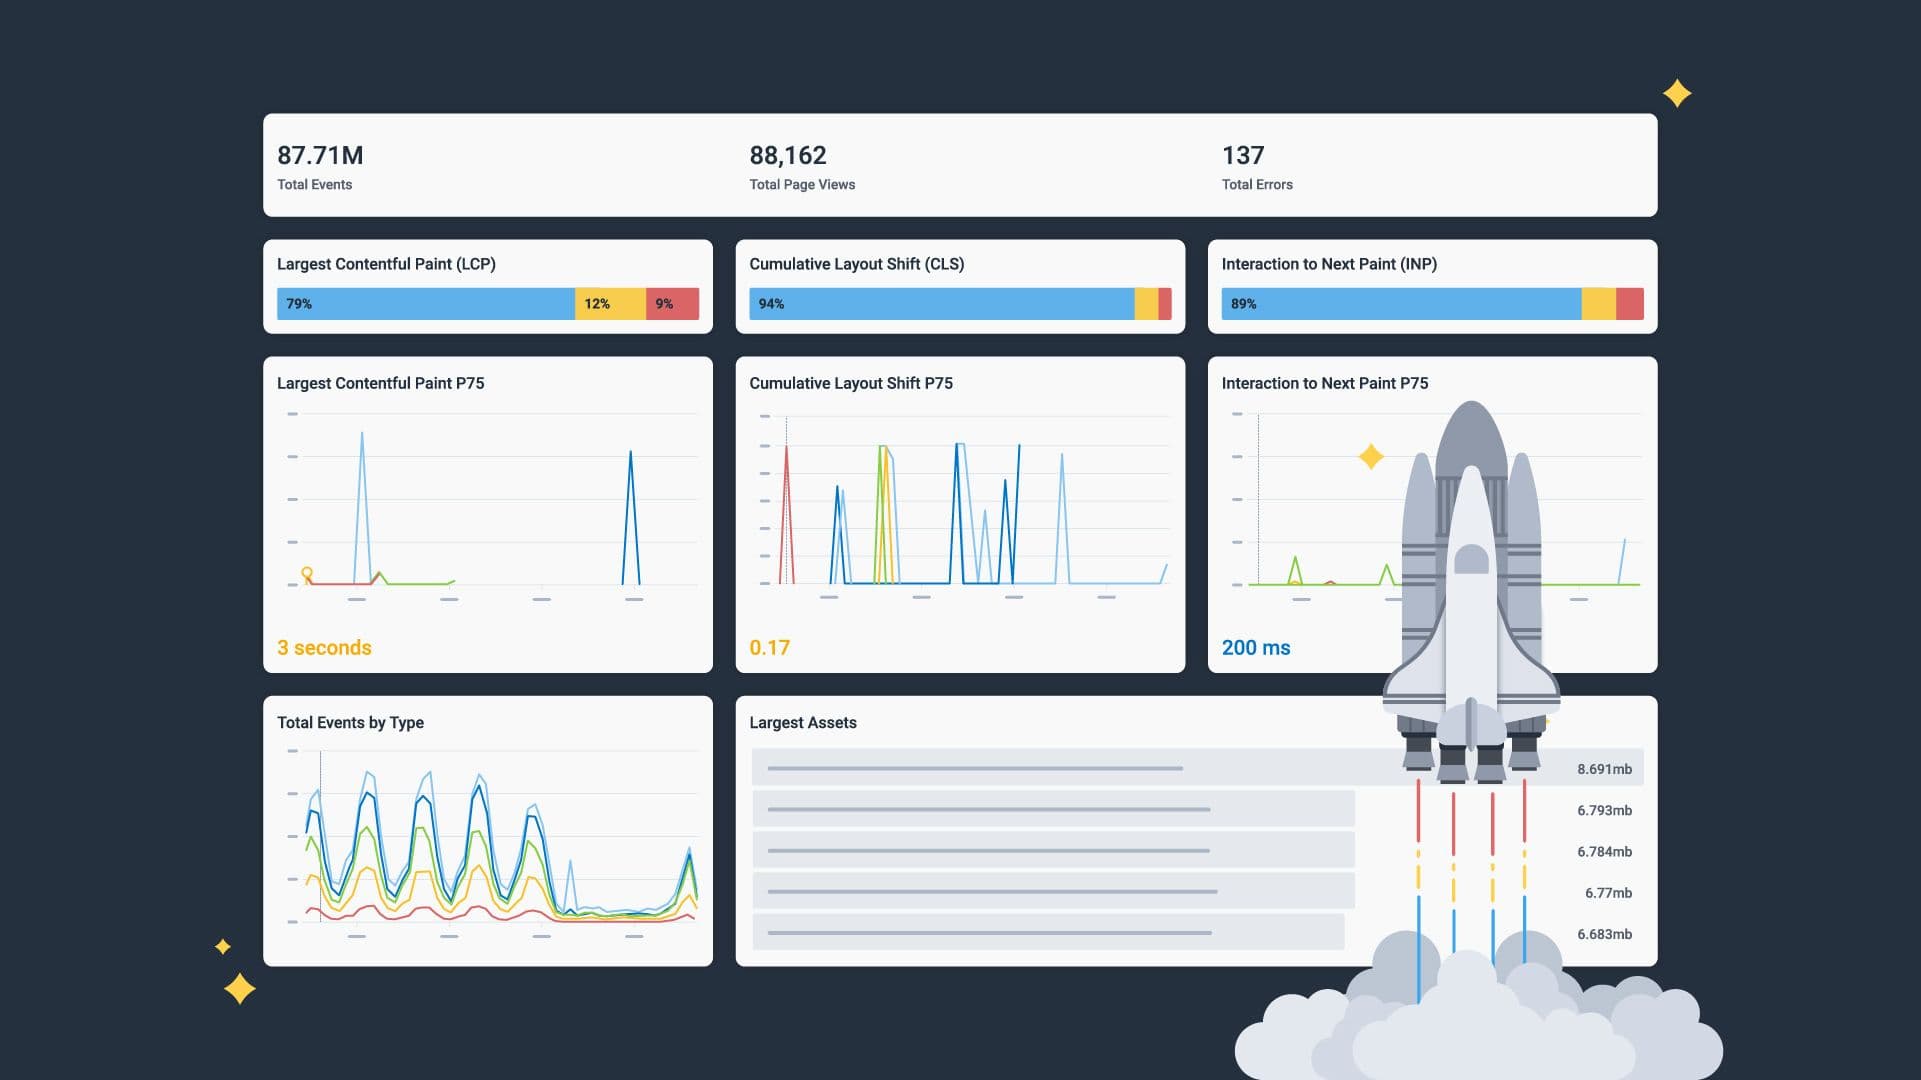
In this blog, we’ll share the fundamentals of frontend monitoring, including what you need to know about performance measurement and strategies for staying ahead of monitoring challenges to deliver high-performing, user-centric applications.
Erwin van der Koogh
One of the hardest parts of my job is to get people to appreciate just how much of a difference Honeycomb/observability 2.0 is compared to their current way of working. It’s not just a small step up or a linear improvement. Rather, it’s an entire step change in the way that you write, deploy, and operate software for your customers.
Fred Hebert
Back in Alerts Are Fundamentally Messy, I made the point that the events we monitor are often fuzzy and uncertain. To make a distinction between what is valid or invalid as an event, context is needed, and since context doesn’t tend to exist within a metric, humans go around and validate alerts to add this context. As such, humans are part of the alerting loop, and alerts can be framed as devices used to redirect our attention.
Hannah Henderson
There are a limited number of investments that a team can make in any given year and it can be daunting to choose the “right” ones. To simplify our options, I keep coming back to “the future” and “the floor.”
Charity Majors
Ever since January of 2022, we have had an employee representative seated on our board of directors. Paul Osman was the first employee to hold the position; when he left the company, Alyson van Hardenburg took over and filled out the rest of his time; we then nominated her to serve another year in that seat.
Ken Rimple
In this article, I’ll lay out approaches for wiring Honeycomb to client-side only React so you can ingest your telemetry into Honeycomb and take advantage of the Web Launchpad. This telemetry sends semantically-named attributes, and can be used with any OTLP destination.
Tyler Helmuth
We recently released Refinery 2.9, which came with great performance improvements. Reading through the release notes, I felt the need to write a piece on this improvement, as it’s quite important but easy to overlook: collect loop taking too long. This is the story of how we used distributed tracing to find the slowdown in this loop.
Lex Neva
I’ve read a steadily increasing stream of articles about using AI in SRE, and I have yet to find one that inspires my trust. Each article makes impressive claims about the capabilities of AI and the way it can be applied to SRE tasks, but the vast majority are light on details.
Winston Hearn
In speaking with frontend engineers this past year, I realized that understanding the power of wide events is a big mental shift. We’re used to having metrics—think the P70 of your Core Web Vitals, or the average Time To First Byte (TTFB). These are high-level numbers that give us some insight into the average user experience on your apps—but wide events help us do so much more than metrics can ever dream of.
Liz Fong-Jones
At Honeycomb, we believe in ensuring an awesome developer experience for our own engineering teams; it’s the only way that we can compete with companies that have way more engineers than we do. We’ve historically tried to keep our build times under 15 minutes, taking percussive action when build times got over 15 minutes.
Get it delivered straight to your inbox.
By subscribing to our newsletter, you agree to Honeycomb’s Terms of Service and Privacy Notice.
Grady Salzman
As a software engineer, I’m always evaluating tools and technologies that can optimize my workflow. Developer productivity isn’t just about writing more code—it’s about reducing friction, whether that’s context-switching, making repetitive edits, or understanding unfamiliar parts of a codebase. That’s where Copilot comes in: making tasks that once felt monotonous or time-consuming into faster, more intuitive processes.
Alex Boten
The Collector is one of many tools that the OpenTelemetry project provides end users to use in their observability journey. It is a powerful mechanism that can help you collect telemetry in your infrastructure and it is a key component of a telemetry pipeline. The Collector helps you better understand what your systems are doing—but who watches the Collector?
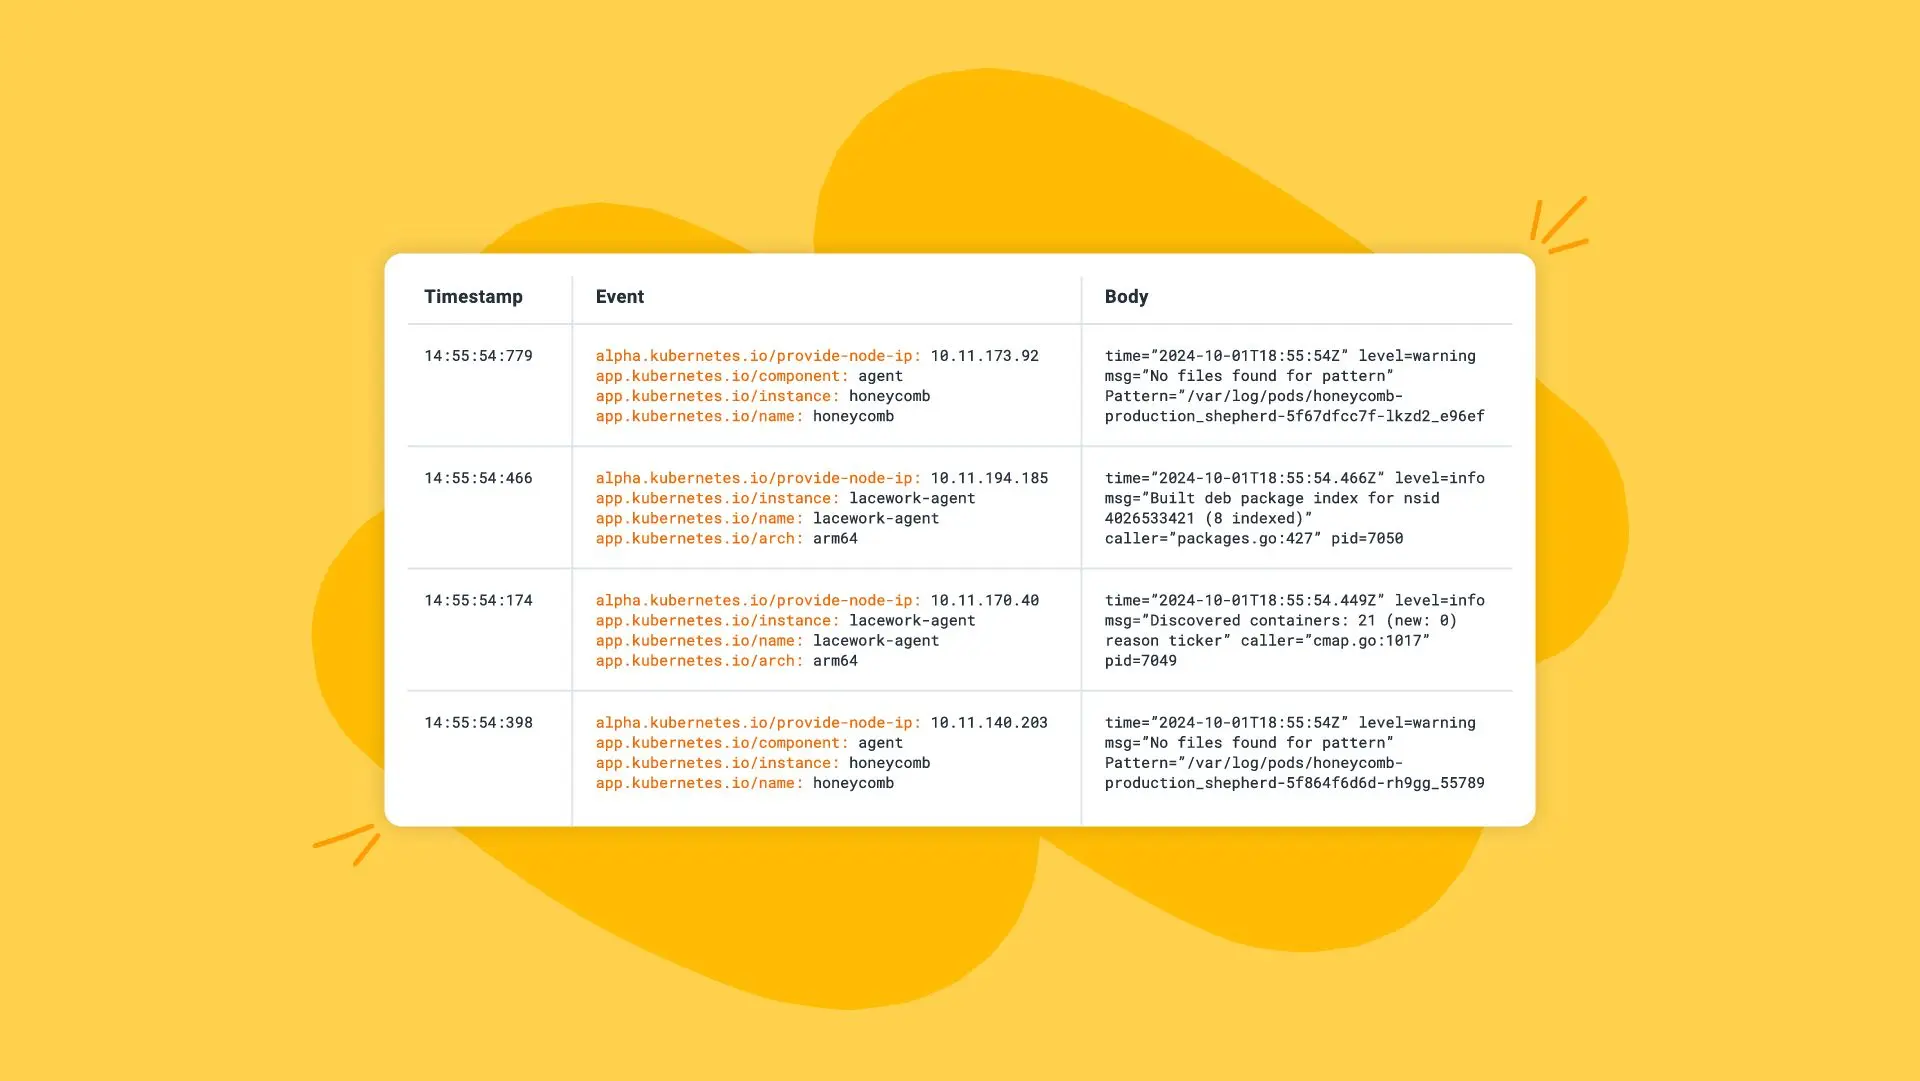
The OpenTelemetry Collector is an exceptional solution for proxying and enhancing telemetry, but it’s also great for generating telemetry from machines too. In this post, we’ll go through a basic, opinionated setup of using the OpenTelemetry Collector to extract metrics and logs from a Windows server.
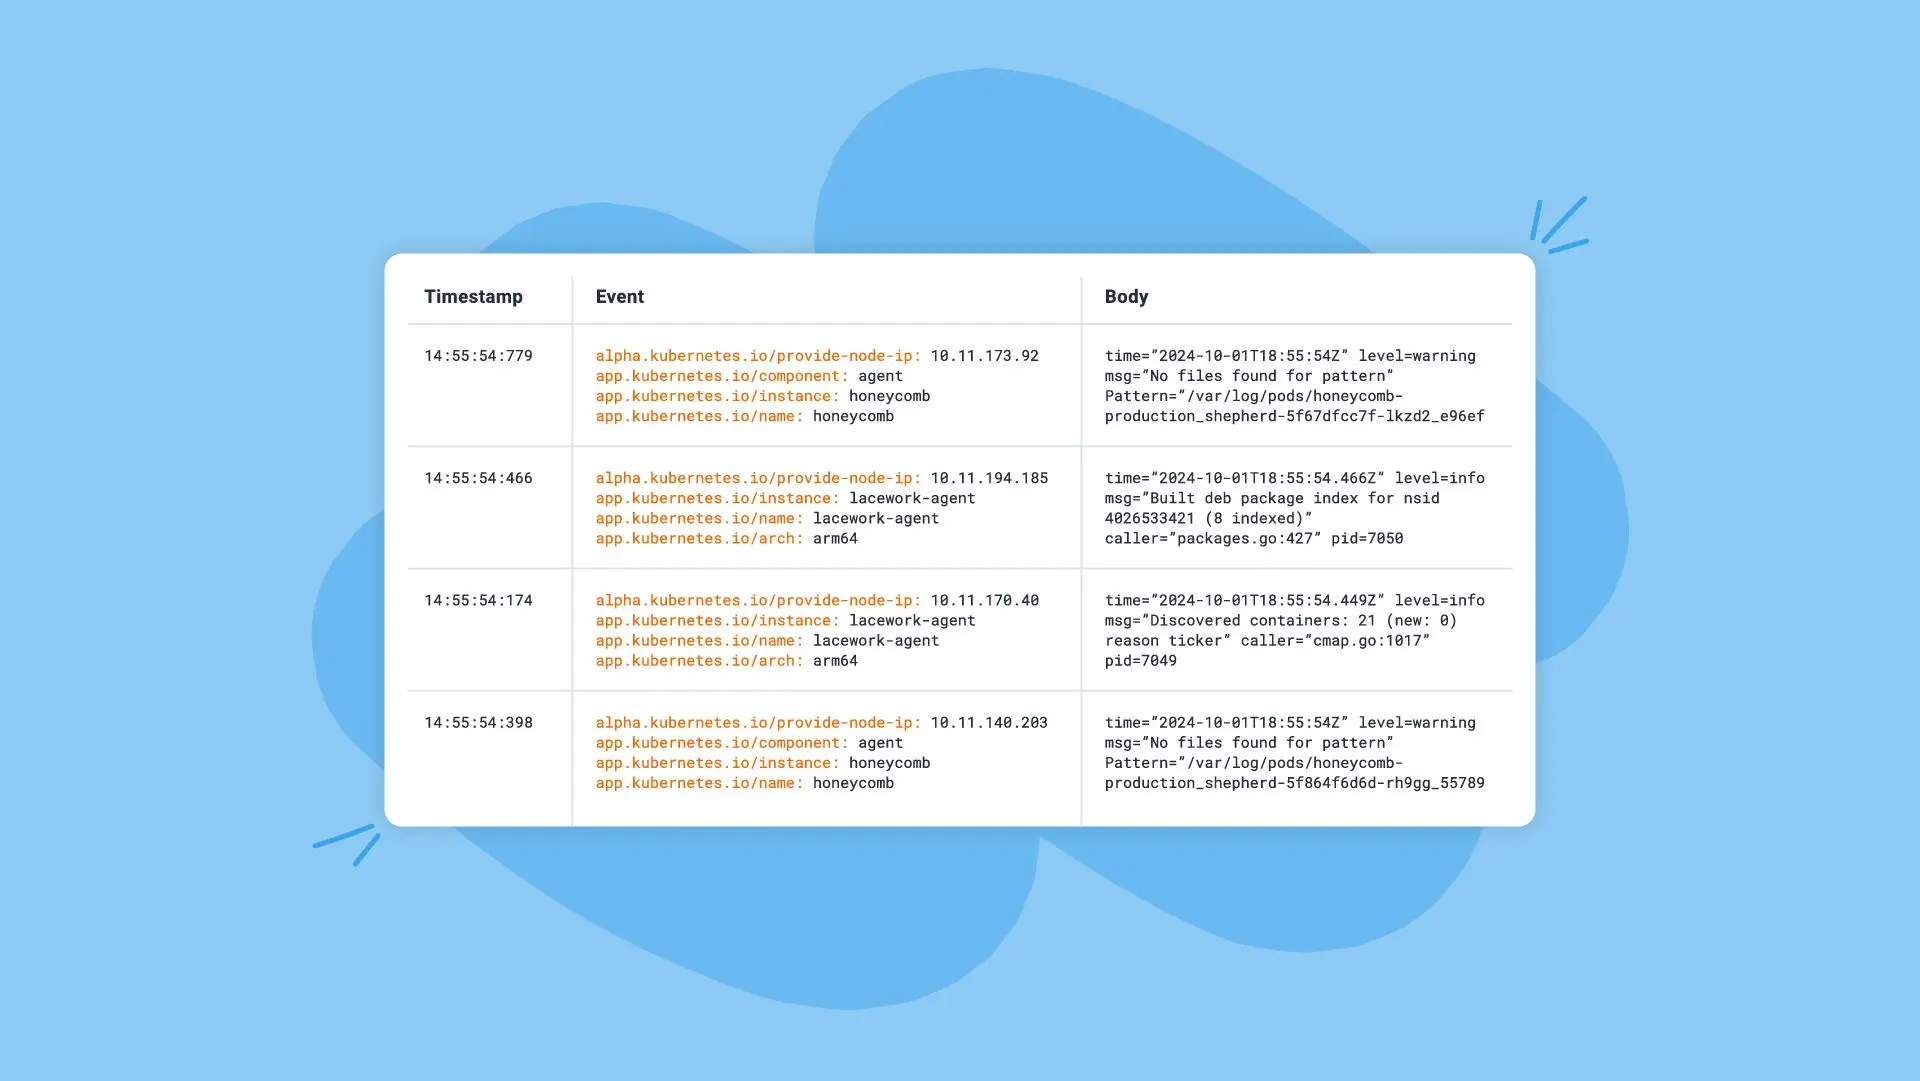
Logs are more than just records. With proper log monitoring, they become the honey that sweetens observability. Observability is your ability to understand and optimize your system’s behavior. Turning raw logs into actionable insights requires the right tools, practices, and insights. This blog post is a guide on log monitoring key concepts and best practices for sweetening your observability.
In this article, I’ll clear up the confusion around Cross-Origin Resource Sharing (CORS), specifically discussing preflight requests, which are the bane of engineers everywhere.
Another one in the history books: 2024 is (almost!) over. The OpenObservability Talks podcast, hosted by Dotan Horovits, recently featured a lively discussion with Charity Majors, Co-founder and CTO of Honeycomb, to reflect on the trends, achievements, and future of observability.
Ruthie Irvin
All the conditions necessary to alter the career paths of brand new software engineers coalesced—extreme layoffs and hiring freezes in tech danced with the irreversible introduction of ChatGPT and GitHub Copilot. Recession and AI-assisted programming signaled the potential end of a dream to bootcamp-educated juniors.
Jamie Danielson
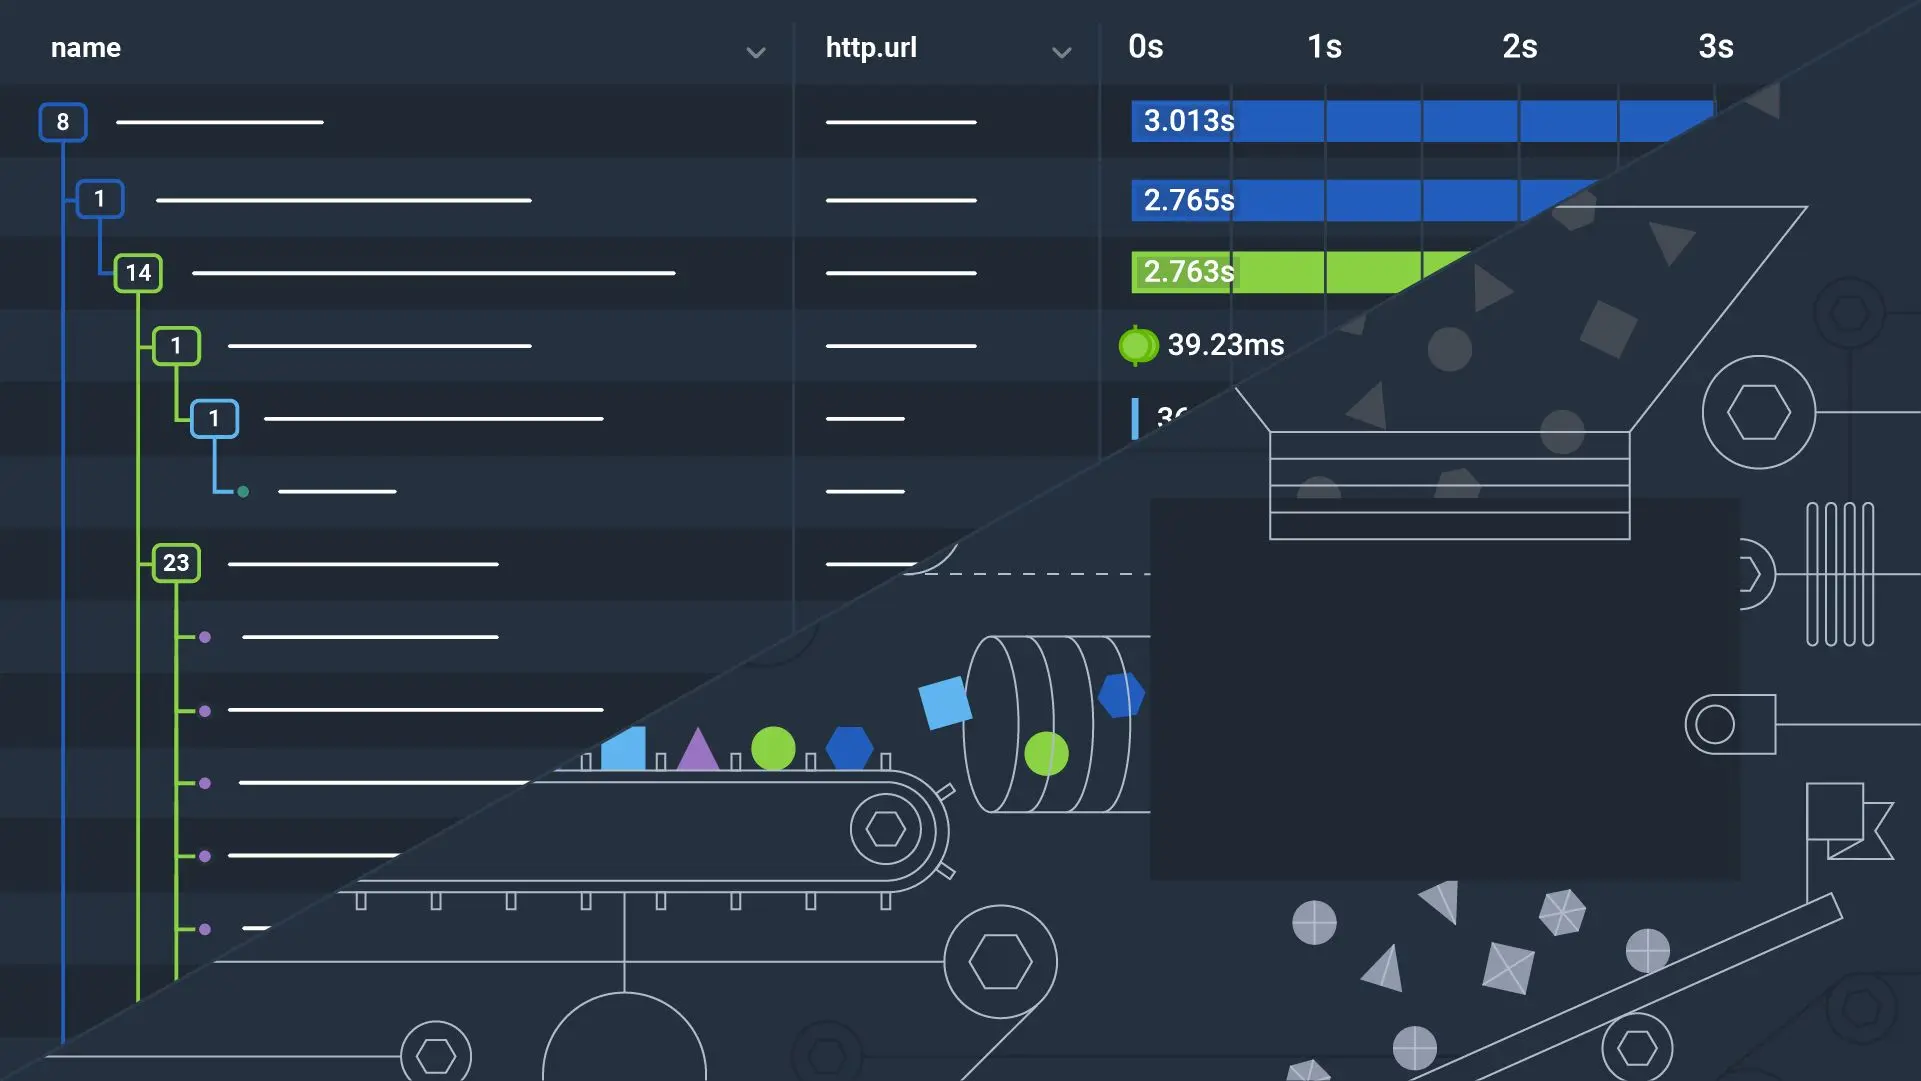
Have you ever had an alert go off that you immediately ignore? It’s a nuisance alert—not actionable—but you keep it around just in case. Or maybe you’ve looked at a trace waterfall and wondered what exactly happened during a gap that just doesn’t drill down deep enough to explain what’s going on. Do you know the feeling where you have just enough information to monitor what’s going on in your systems, but not quite enough to put your mind at ease?