Honeycomb was built for the AI era. Learn how to futureproof your software for what comes next.
Discover why Honeycomb is the better choice for your engineers, your customers, and your bottom line.
Start your journey with the definitive guide to observability. Download our complimentary ebook.
Bring observability to every software engineer.
Learn about our company, mission and values.
Come for the impact, stay for the culture.
See Honeycomb's latest press releases, media, and more
Learn more about becoming a Honeycomb partner.
Already a Honeycomb customer?
Charity Majors
Honeycomb engineers were amongst the earliest adopters of this technology. Not in the widely parodied top-down, VP-mandated, “go be AI leaders nao plz” kind of way, but in a bottoms-up, experimental kind of way, driven by curiosity and fascination.
Yingrong Zhao
Refinery is a powerful tail-based sampler—but with great power comes great challenges. We heard your feedback and are excited to announce the release of Refinery 2.9, a rather large update that is packed with goodies to make your life easier when running Refinery in your network.
David Chang
Develocity, formerly known as Gradle Enterprise, is a powerful tool that speeds up local and CI build time, helps troubleshoot your builds, and analyzes your data. At Pinterest, we have a dedicated team, Mobile Builds, and we ensure that developers can build fast and often. This enables developers to be more productive by getting faster feedback on their code.
Alex Boten
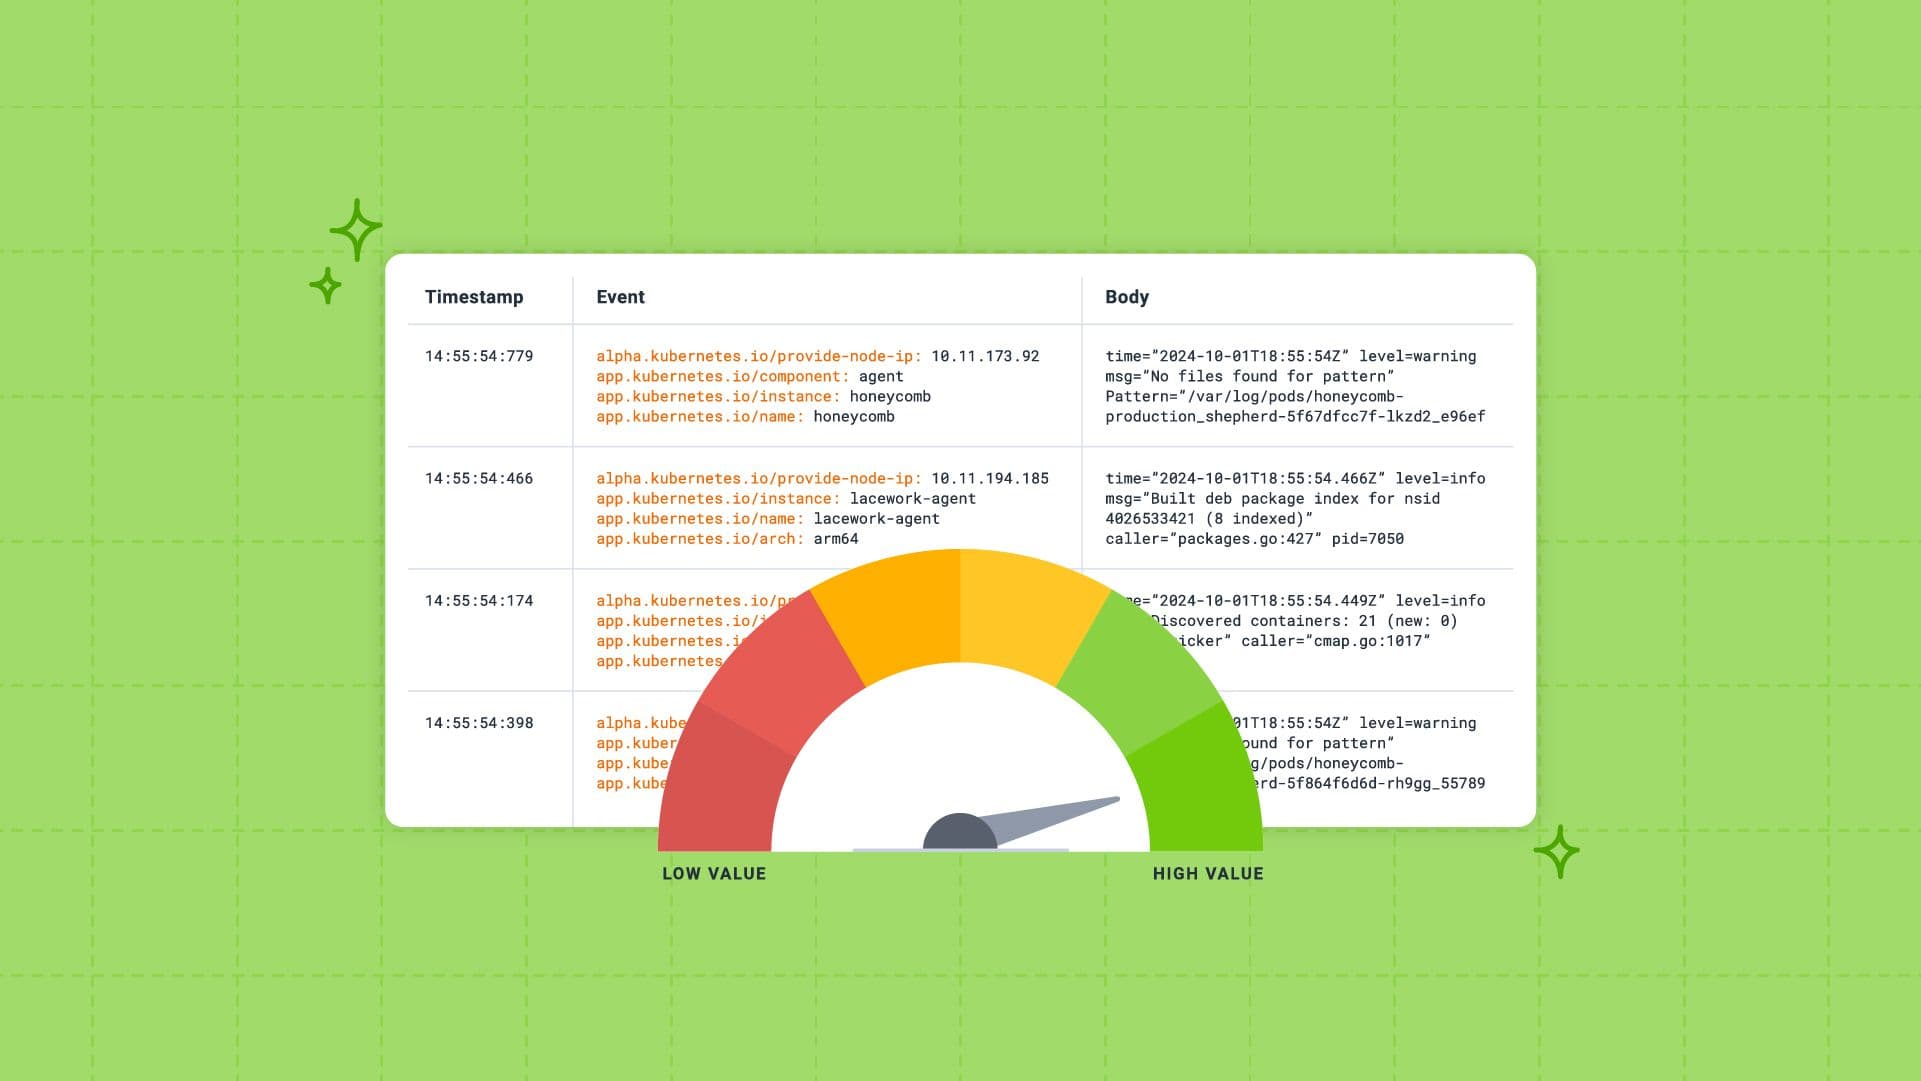
We’re always interested in improving the signal-to-noise ratio of our internal telemetry at Honeycomb. In an effort to reduce the amount of noise in our logs, we looked at reducing and deduplicating the logs emitted by our infrastructure and applications.
Martin Thwaites
So, how do we get JSON logs into a backend analysis system like Honeycomb that primarily accepts OTLP data? In this post, we’ll cover how to use the filelog receiver component in the OpenTelemetry Collector to parse JSON log lines from logs files, as there are a few ways to achieve this.
Rox Williams
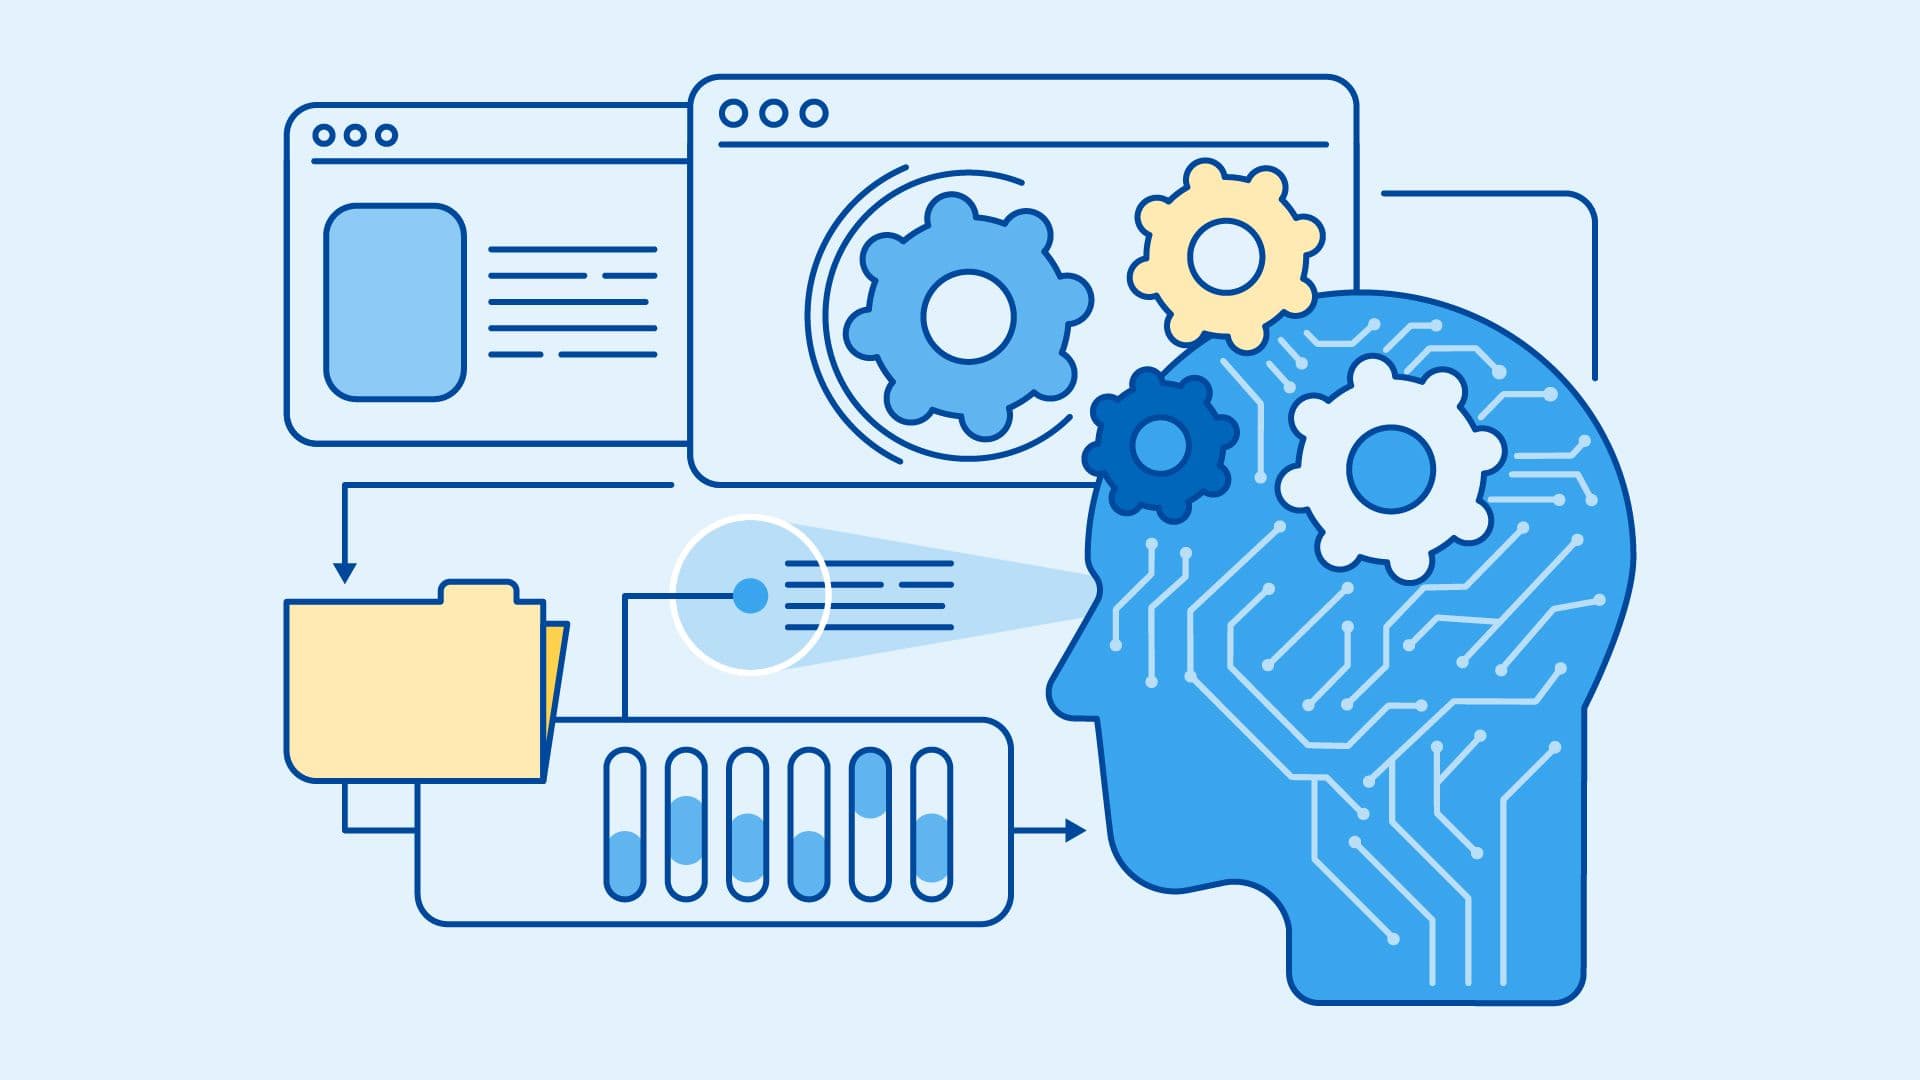
With more and often smaller processes, cloud-native architectures have driven the need for better insights into our software—a way to look into how these processes fit together. To accomplish this insight, we use an approach that goes beyond traditional monitoring and provides deep insights into system behavior. This approach is cloud observability.
We’ve been talking about observability 2.0 a lot lately; what it means for telemetry and instrumentation, its practices and sociotechnical implications, and the dramatically different shape of its cost model. With all of these details swimming about, I’m afraid we’re already starting to lose sight of what matters. The distinction between observability 1.0 and observability 2.0 is not a laundry list, it’s not marketing speak, and it’s not that complicated or hard to understand. The distinction is a technical one, and it’s actually quite simple.
In the software space, we spend a lot of time defining the terminology that describes our roles, implementations, and ways of working. These terms help us share fundamental concepts that improve our software and let us better manage our software solutions. To optimize your software solutions and help you implement system observability, this blog post will share the key differences between two important terms: traces and logs.
Fred Hebert
About a year ago, Honeycomb kicked off an internal experiment to structure how we do incident response. We looked at the usual severity-based approach (usually using a SEV scale), but decided to adopt an approach based on types, aiming to better play the role of quick definitions for multiple departments put together. This post is a short report on our experience doing it.
Quinn Leong
Earlier this year, we introduced relational fields. Relational fields enable you to query spans based on their relationship to one other within a trace, rather than only in isolation. We’ve now expanded this feature…
Jessica Kerr (Jessitron)
Observability means you know what’s happening in your software systems, because they tell you. They tell you with telemetry: data emitted just for the people developing and operating the software. You already have telemetry–every log is a data point about something that happened. Structured logs or trace spans are even better, containing many pieces of data correlated in the same record. But you want to start from what you have, then improve it as you improve the software.
Nick Travaglini
As discussed in the first article in this series, a Center of Production Excellence (CoPE) is a more or less formal, provisional subsystem within an organization. Its purpose is to act from within to change that organization so that it’s more capable of achieving production excellence. The series has, to date, focused mainly on how best to construct such a subsystem and what activities it should pursue. In this concluding post, however, I want to return to the point of a CoPE, discuss signs of success, and evaluate the impacts it’s having.
Get it delivered straight to your inbox.
By subscribing to our newsletter, you agree to Honeycomb’s Terms of Service and Privacy Notice.
Liz Fong-Jones
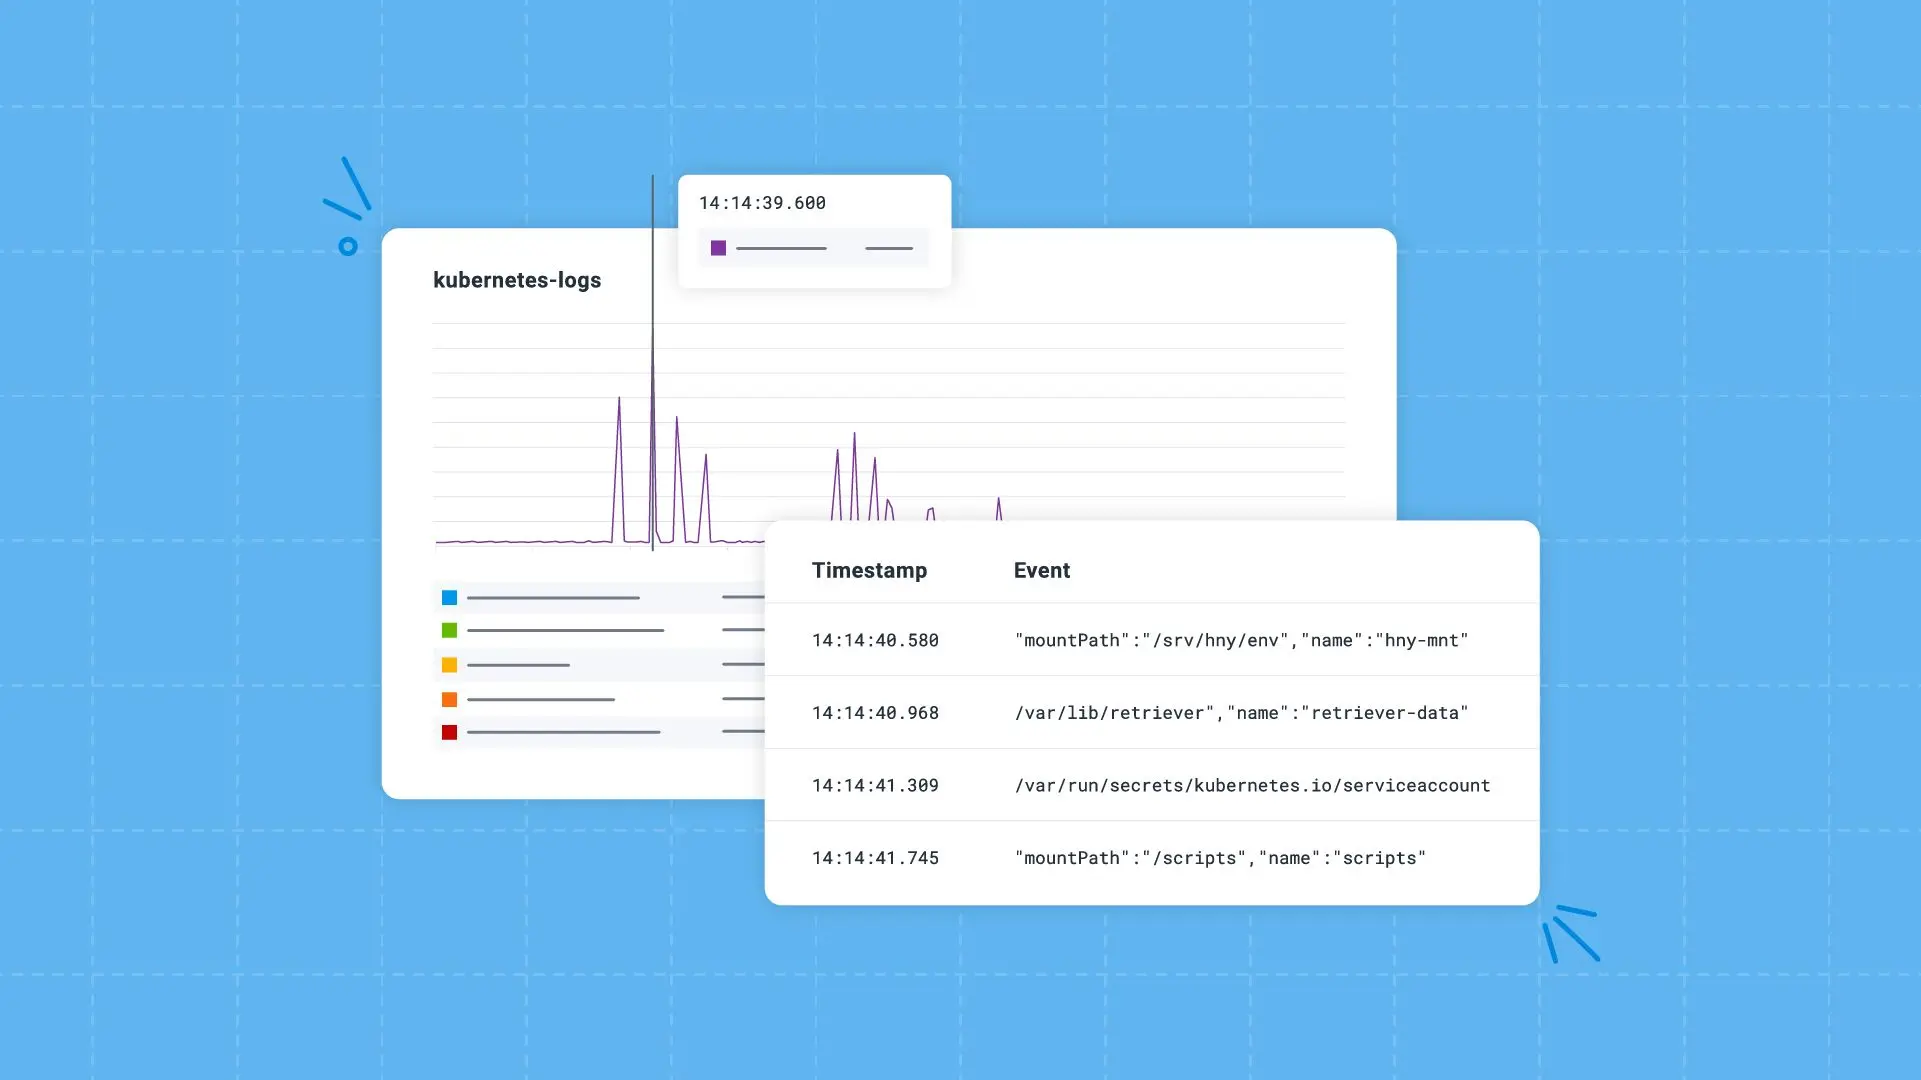
Let’s be real, we’ve never been huge fans of conventional unstructured logs at Honeycomb. From the very start, we’ve emitted from our own codestructured wide events and distributed traces with well-formed schemas. Fortunately (because it avoids reinventing the wheel) and unfortunately (because it doesn’t adhere to our standards for observability) for us, not all the software we run is written by us. And Kubernetes is a prime example of such a load-bearing part of our infrastructure.
Mei Luo
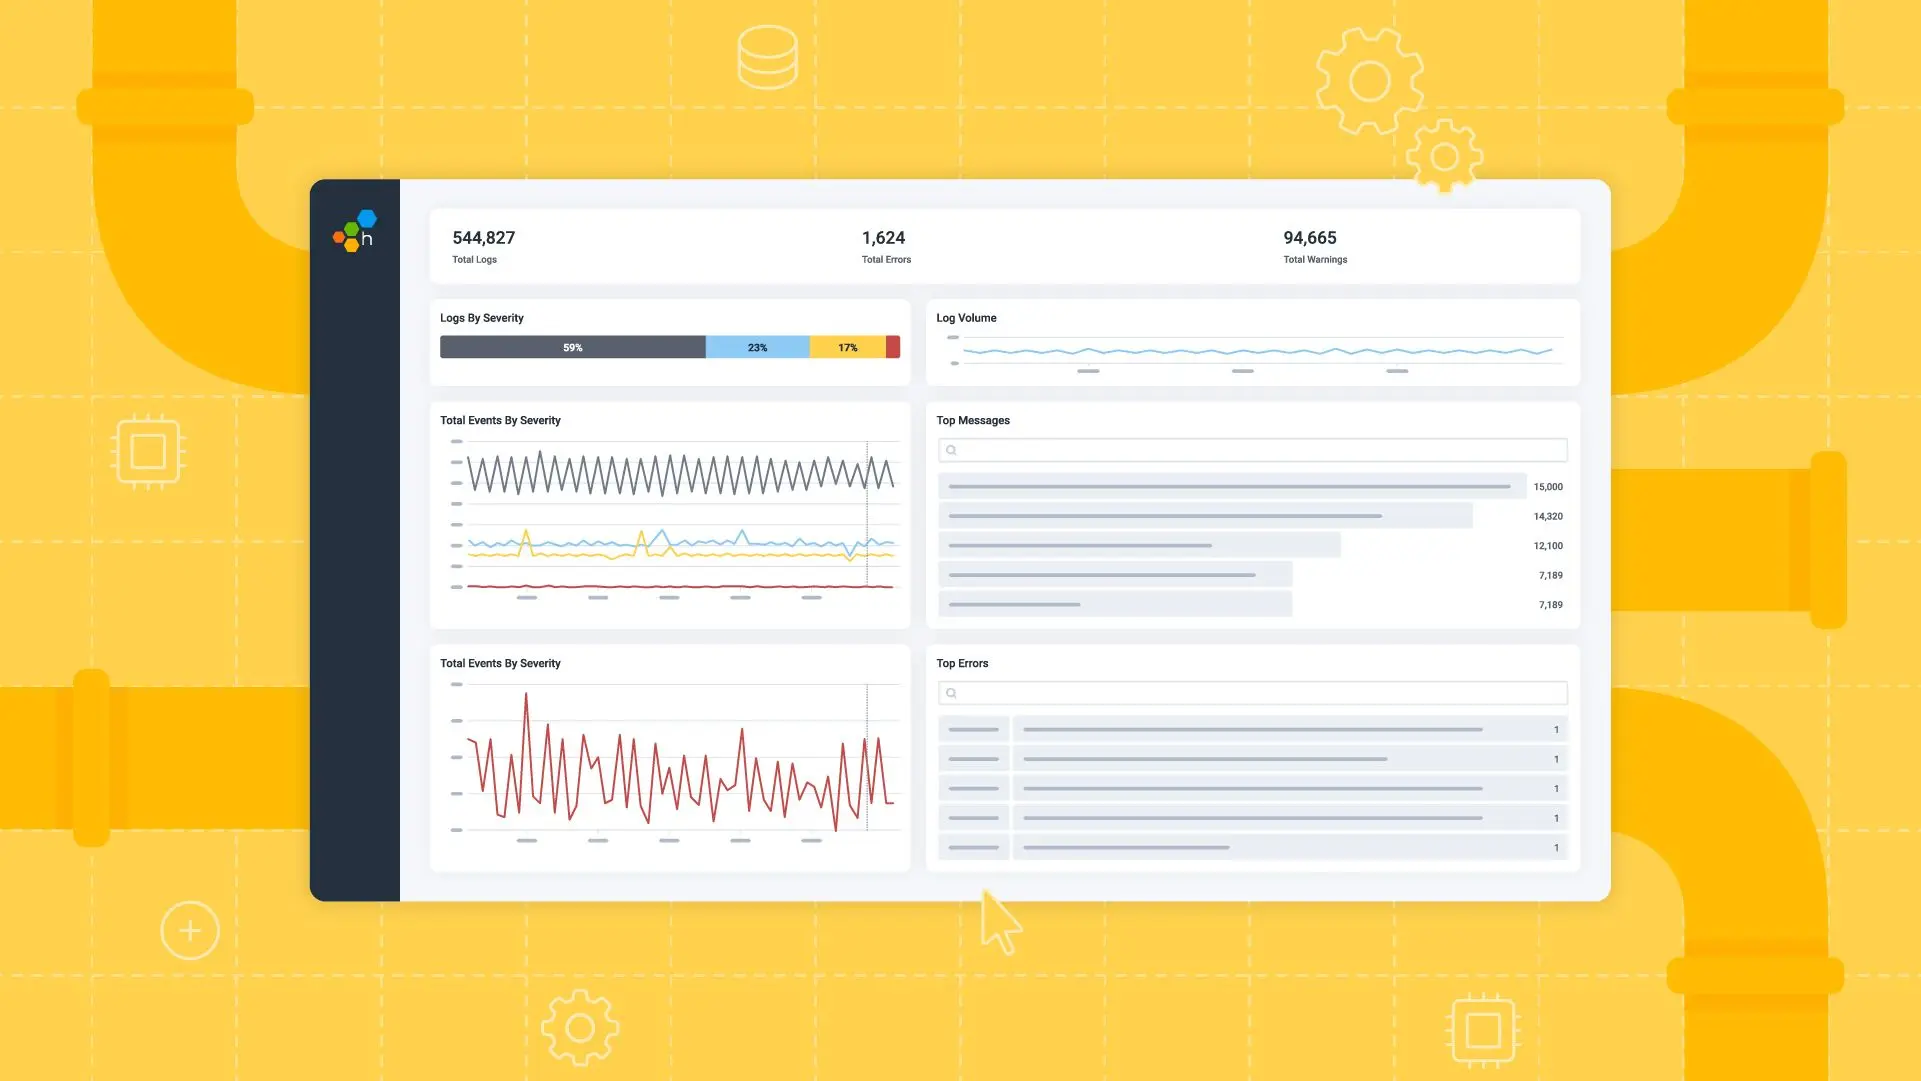
At Honeycomb, we know how important it is for organizations to have a unified observability platform. This is why we’re launching Honeycomb Telemetry Pipeline and Honeycomb for Log Analytics: to enable engineering teams to send and analyze data—including logs—into a single, unified platform.
Elsie Phillips
Over the past six weeks, we introduced a series of impactful updates aimed at making your observability workflows faster, more unified, and more collaborative. Here’s a snapshot of what we worked on.
Frontend development has evolved rapidly over the past decade, but one challenge remains constant: understanding what’s happening in real-time across diverse browsers, environments, and user interactions. This is where observability steps in—but how does it apply to the frontend world where user experience can break in countless, unexpected ways?
Fahim Zaman
Real user monitoring (RUM) began as a straightforward approach to tracking basic web performance metrics. Focused on things like page load times and response rates, RUM relied on server-side logging and simple browser timings. While these tools captured Core Web Vitals (CWVs), they offered limited insights into how users actually interacted with pages, focused mainly on server-side performance.
Oh no, I’m getting out-of-memory errors! How much memory is my app using? To find out, we go look for a metric that tells us how much memory is available, and we graph it around the time that our errors occurred.
Winston Hearn
Recently, we announced the launch of Honeycomb for Frontend Observability, our new solution that helps frontend developers move from traditional monitoring to observability. What this means in practice is that frontend developers are no longer limited to a metrics view of their app that can only be disaggregated in a few dimensions. Now, they can enjoy the full power of observability, where their app collects a broad set of data as traces to enable much richer analysis of the state of a web service.
Kent Quirk
Refinery is Honeycomb’s sampling proxy, which our largest customers use to improve the value they get from their telemetry. It has a variety of interesting samplers to choose from. One category of these is called dynamic sampling. It’s basically a technique for adjusting sample rates to account for the volume of incoming data—but doing so in a way that rare events get more priority than common events.