Honeycomb was built for the AI era. Learn how to futureproof your software for what comes next.
Discover why Honeycomb is the better choice for your engineers, your customers, and your bottom line.
Start your journey with the definitive guide to observability. Download our complimentary ebook.
Bring observability to every software engineer.
Learn about our company, mission and values.
Come for the impact, stay for the culture.
See Honeycomb's latest press releases, media, and more
Learn more about becoming a Honeycomb partner.
Already a Honeycomb customer?
Fred Hebert
We’ve posted before about how engineers on call at Honeycomb aren’t expected to do project work, and that whenever they’re not dealing with interruptions, they’re free to work on whatever will make the on-call experience better.
Tyler Helmuth
As our software complexity increases, so does our telemetry—and as our telemetry increases, it needs more and more tweaking en route to its final destination. You’ve likely needed to change an attribute, parse a log body, or touch up a metric before it landed in your backend of choice.
Winston Hearn
Observability has traditionally been backend-focused, but the frontend is just as hard—if not harder—to debug and has simply outgrown current monitoring tools. Engineers working with the frontend need the ability to see every user interaction with their system—and all the rich context around it. They need observability for the frontend. Today, we’re proud to announce that Honeycomb for Frontend Observability is now generally available.
In this post, I’m going to walk through how you can use Honeycomb for Frontend Observability to debug INP, which was just promoted to a stable Core Web Vital in March. The Honeycomb-specific steps in this post are applicable to debugging CLS and LCP as well, and Honeycomb’s instrumentation package captures attribution data for all three metrics.
Rox Williams
The best DevOps and SRE teams have shifted their approach to monitoring and logging their systems. These teams debug problems cohesively and rationally, regardless of the system’s complexity. Gone are the days of having a slew of logs that fail to explain the cause of alerts, system failures, and other unknowns.
Nick Travaglini
Building a center of production excellence (CoPE) starts with indexing on production. Here’s why. Odds are that a software engineer today is really focused on one place: pre-prod. Short for “pre-production,” this is slang for an environment where software code operates in a prototype phase of its development lifecycle.
At this point, it’s almost passé to write a blog post comparing events to the three pillars. Nobody really wants to give up their position. Regardless, I’m going to talk about how great events are and use some analogies to try to get that across. Maybe these will help folks learn to really appreciate them and to depreciate a certain understanding of the three pillars. Or maybe not.
Austin Parker
One of the things about OpenTelemetry that’s easy to miss if you’re not spending the whole day in the ins and outs of the project is just how much stuff it can do—but that’s what I’m here for! Today, I want to go through the project and give you a guide to the various parts of OpenTelemetry, how mature they are, and what you can expect over the next six months or so. I ranked these elements by relative maturity across the entire project. As such, the stuff marked ‘very ready’ is the most stable, while the stuff marked ‘an adventure’ is less stable. Let’s dive in!
Charity Majors
In 2016, we at Honeycomb first borrowed the term “observability” from the wikipedia entry for control systems observability, where it is a measure of your ability to understand internal system states just by observing its outputs. We then spent a couple of years trying to work out how that definition might apply to software systems. Many twitter threads, podcasts, blog posts, and lengthy laundry lists of technical criteria emerged from that work, including a whole ass book.
Whether you’re using logs to debug issues, keeping an eye on system performance, or protecting your infrastructure, good log management hygiene can make a huge difference. In this article, we’ll teach you the basics of log management, why it’s so important, and how you can contribute to important business goals.
Brian Chang
Engineering has come a long way since the days of delivering discrete, point-in-time products that were often packaged on a CD and shipped to customers. The days of physical media and long development cycles are long gone. The advent of cloud computing and the rise of Software-as-a-Service (SaaS) transformed the landscape, creating a new model of continuous development and service delivery. This shift has not only revolutionized how software is developed, but has also redefined the engineer’s role.
Max Aguirre
Sampling is a necessity for applications at scale. We at Honeycomb sample our data through the use of our Refinery tool, and we recommend that you do too. But how do you get started? Do you simply a set rate for all data and a handful of drop and keep rules, or is there more to it? What do these rules even mean, and how do you implement them?
Get it delivered straight to your inbox.
By subscribing to our newsletter, you agree to Honeycomb’s Terms of Service and Privacy Notice.
Lex Neva
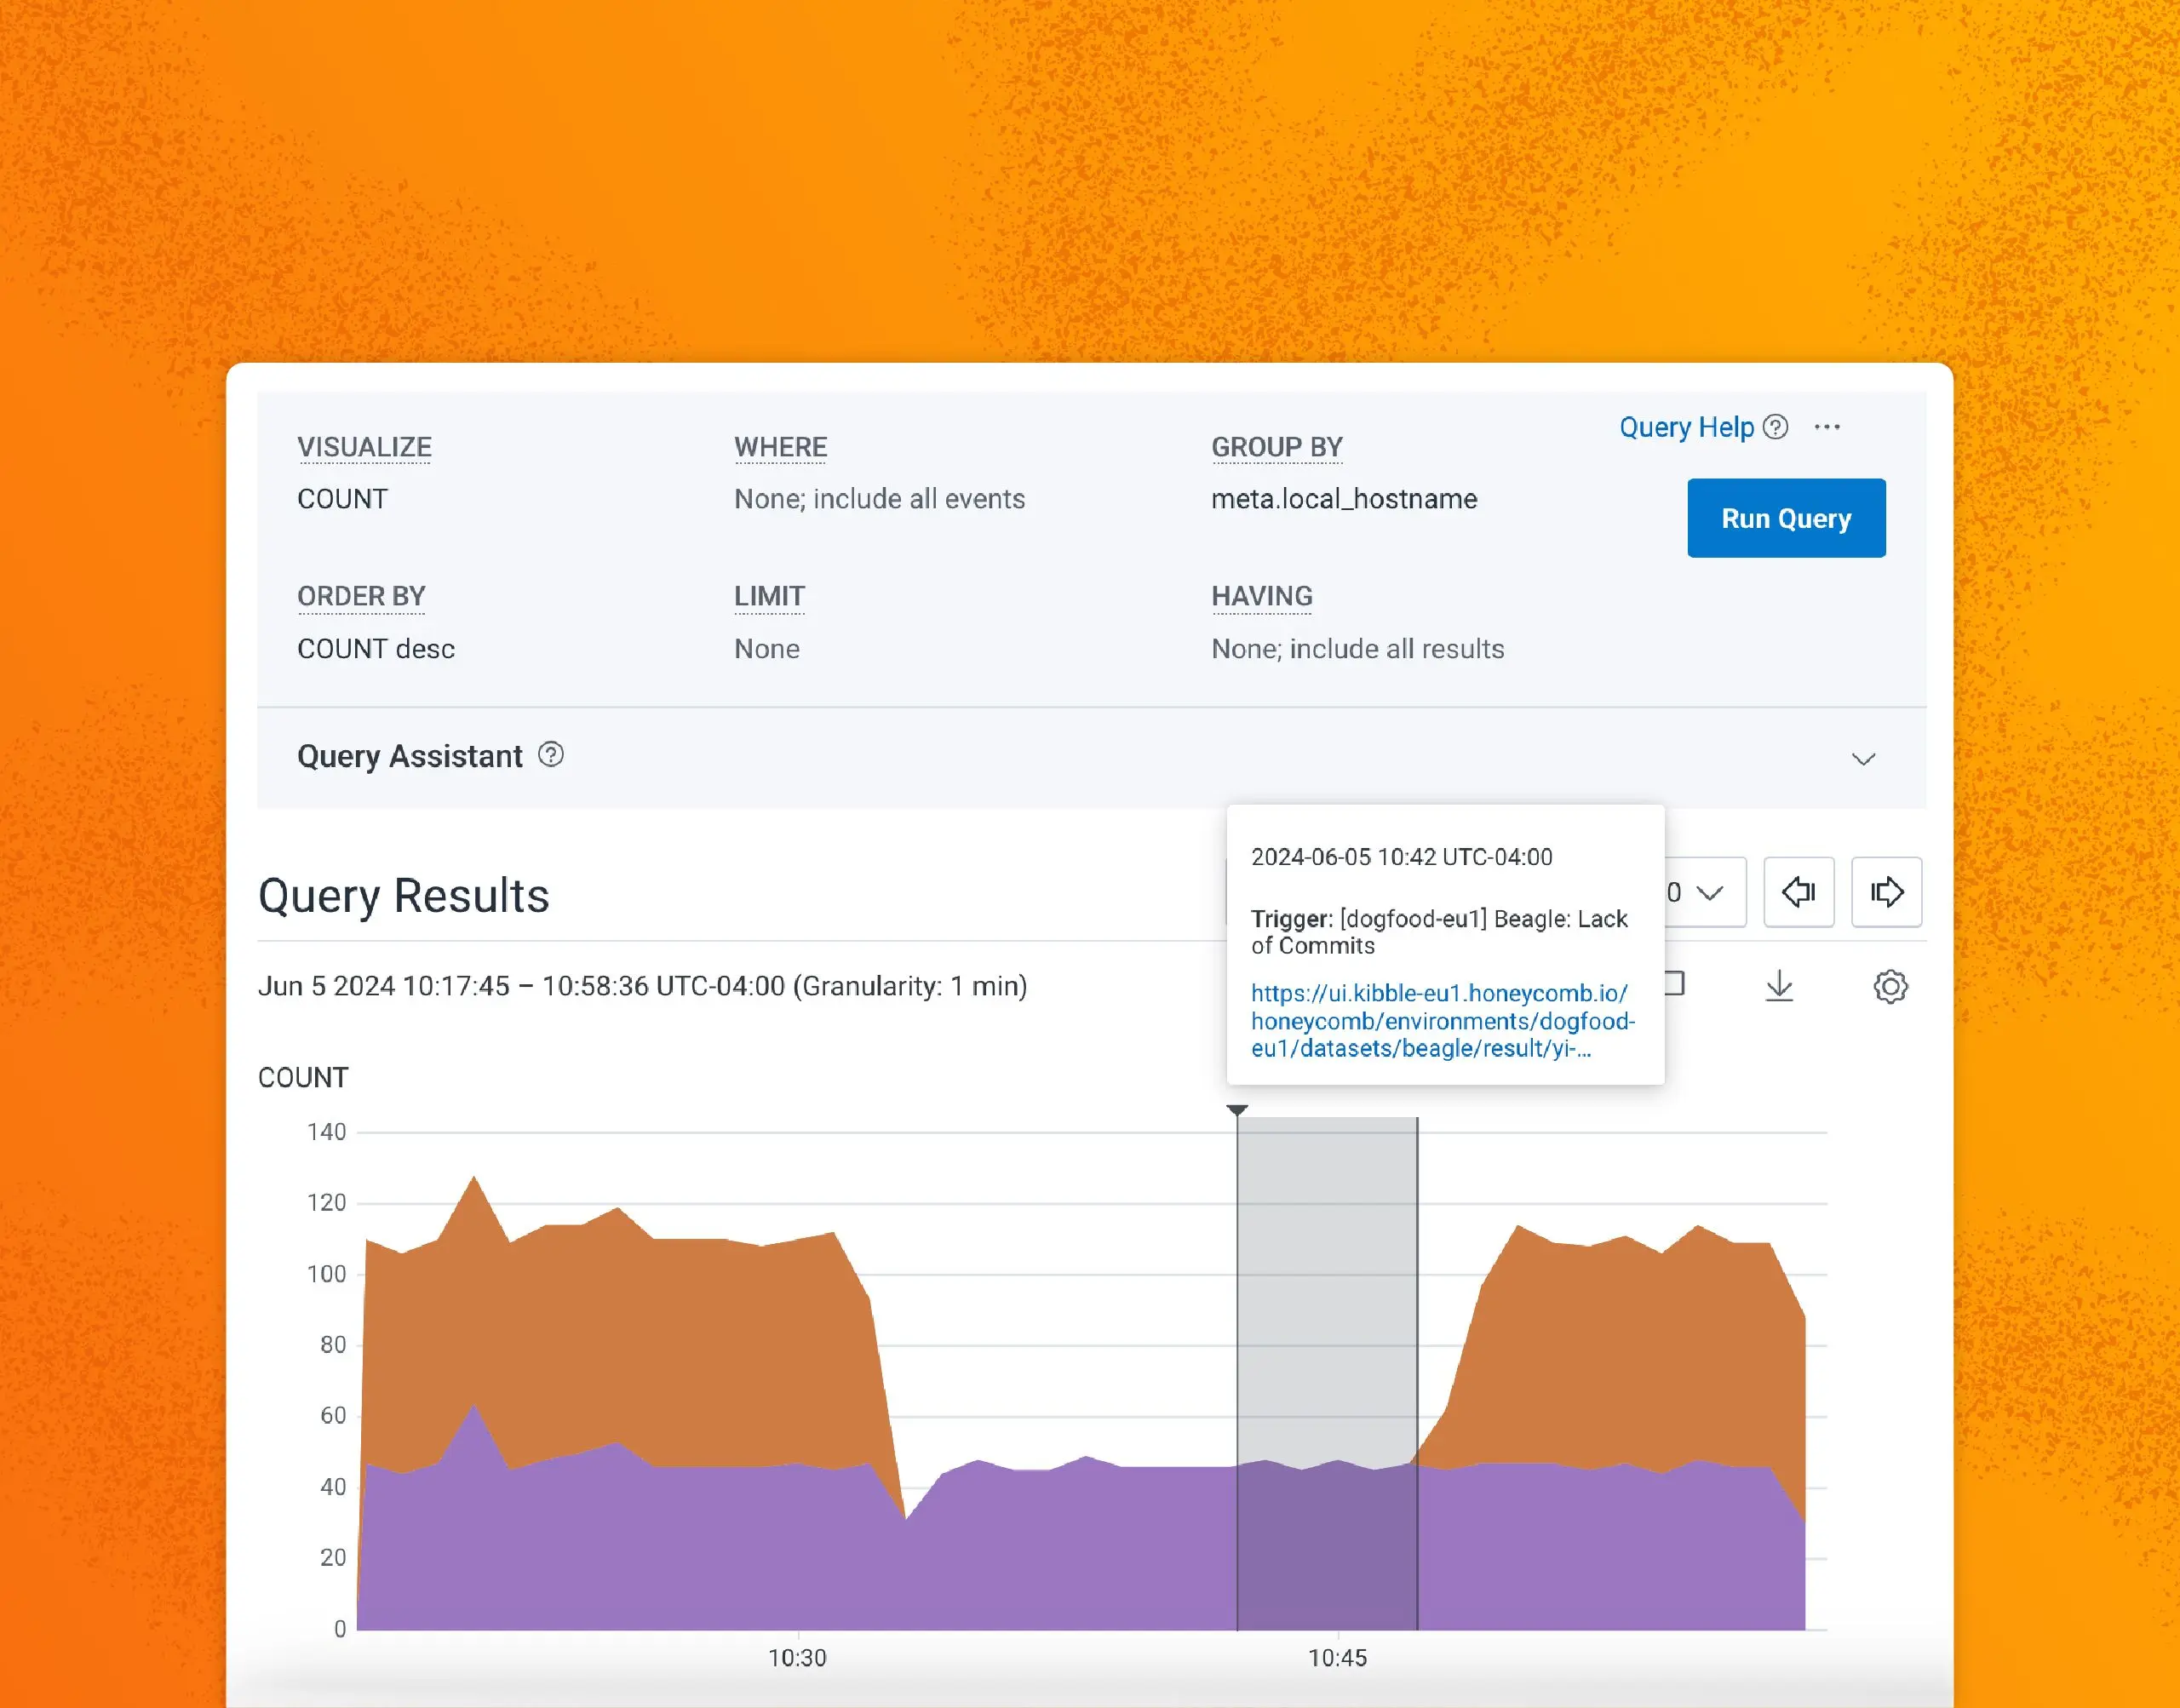
As part of our recent failure testing project, we ran into an interesting failure mode involving the OpenTelemetry SDK for Go. In this post, we’ll show you why our apps stopped sending telemetry for over 15 minutes and how we enabled keepalives to prevent this kind of failure from happening in the future.
Simply put, full-stack observability is monitoring designed for modern, cloud-native architectures. It allows you to understand how your software system interacts at scale, across everything from traditional mainframes and legacy clients to modern serverless or Kubernetes-based services.
Priscilla Lam
Setting clear, measurable goals is essential for any successful team. However, aligning those goals with the technical work can be challenging in the fast-paced world of software engineering. Engineers might focus on reducing latency or improving uptime, while business leaders look at revenue and customer satisfaction. It gets tricky to track the impact between the two to justify when specific engineering initiatives are important, why, and how they impact the bottom line. Everyone may feel the work is important, but it’s hard to see or remember why!
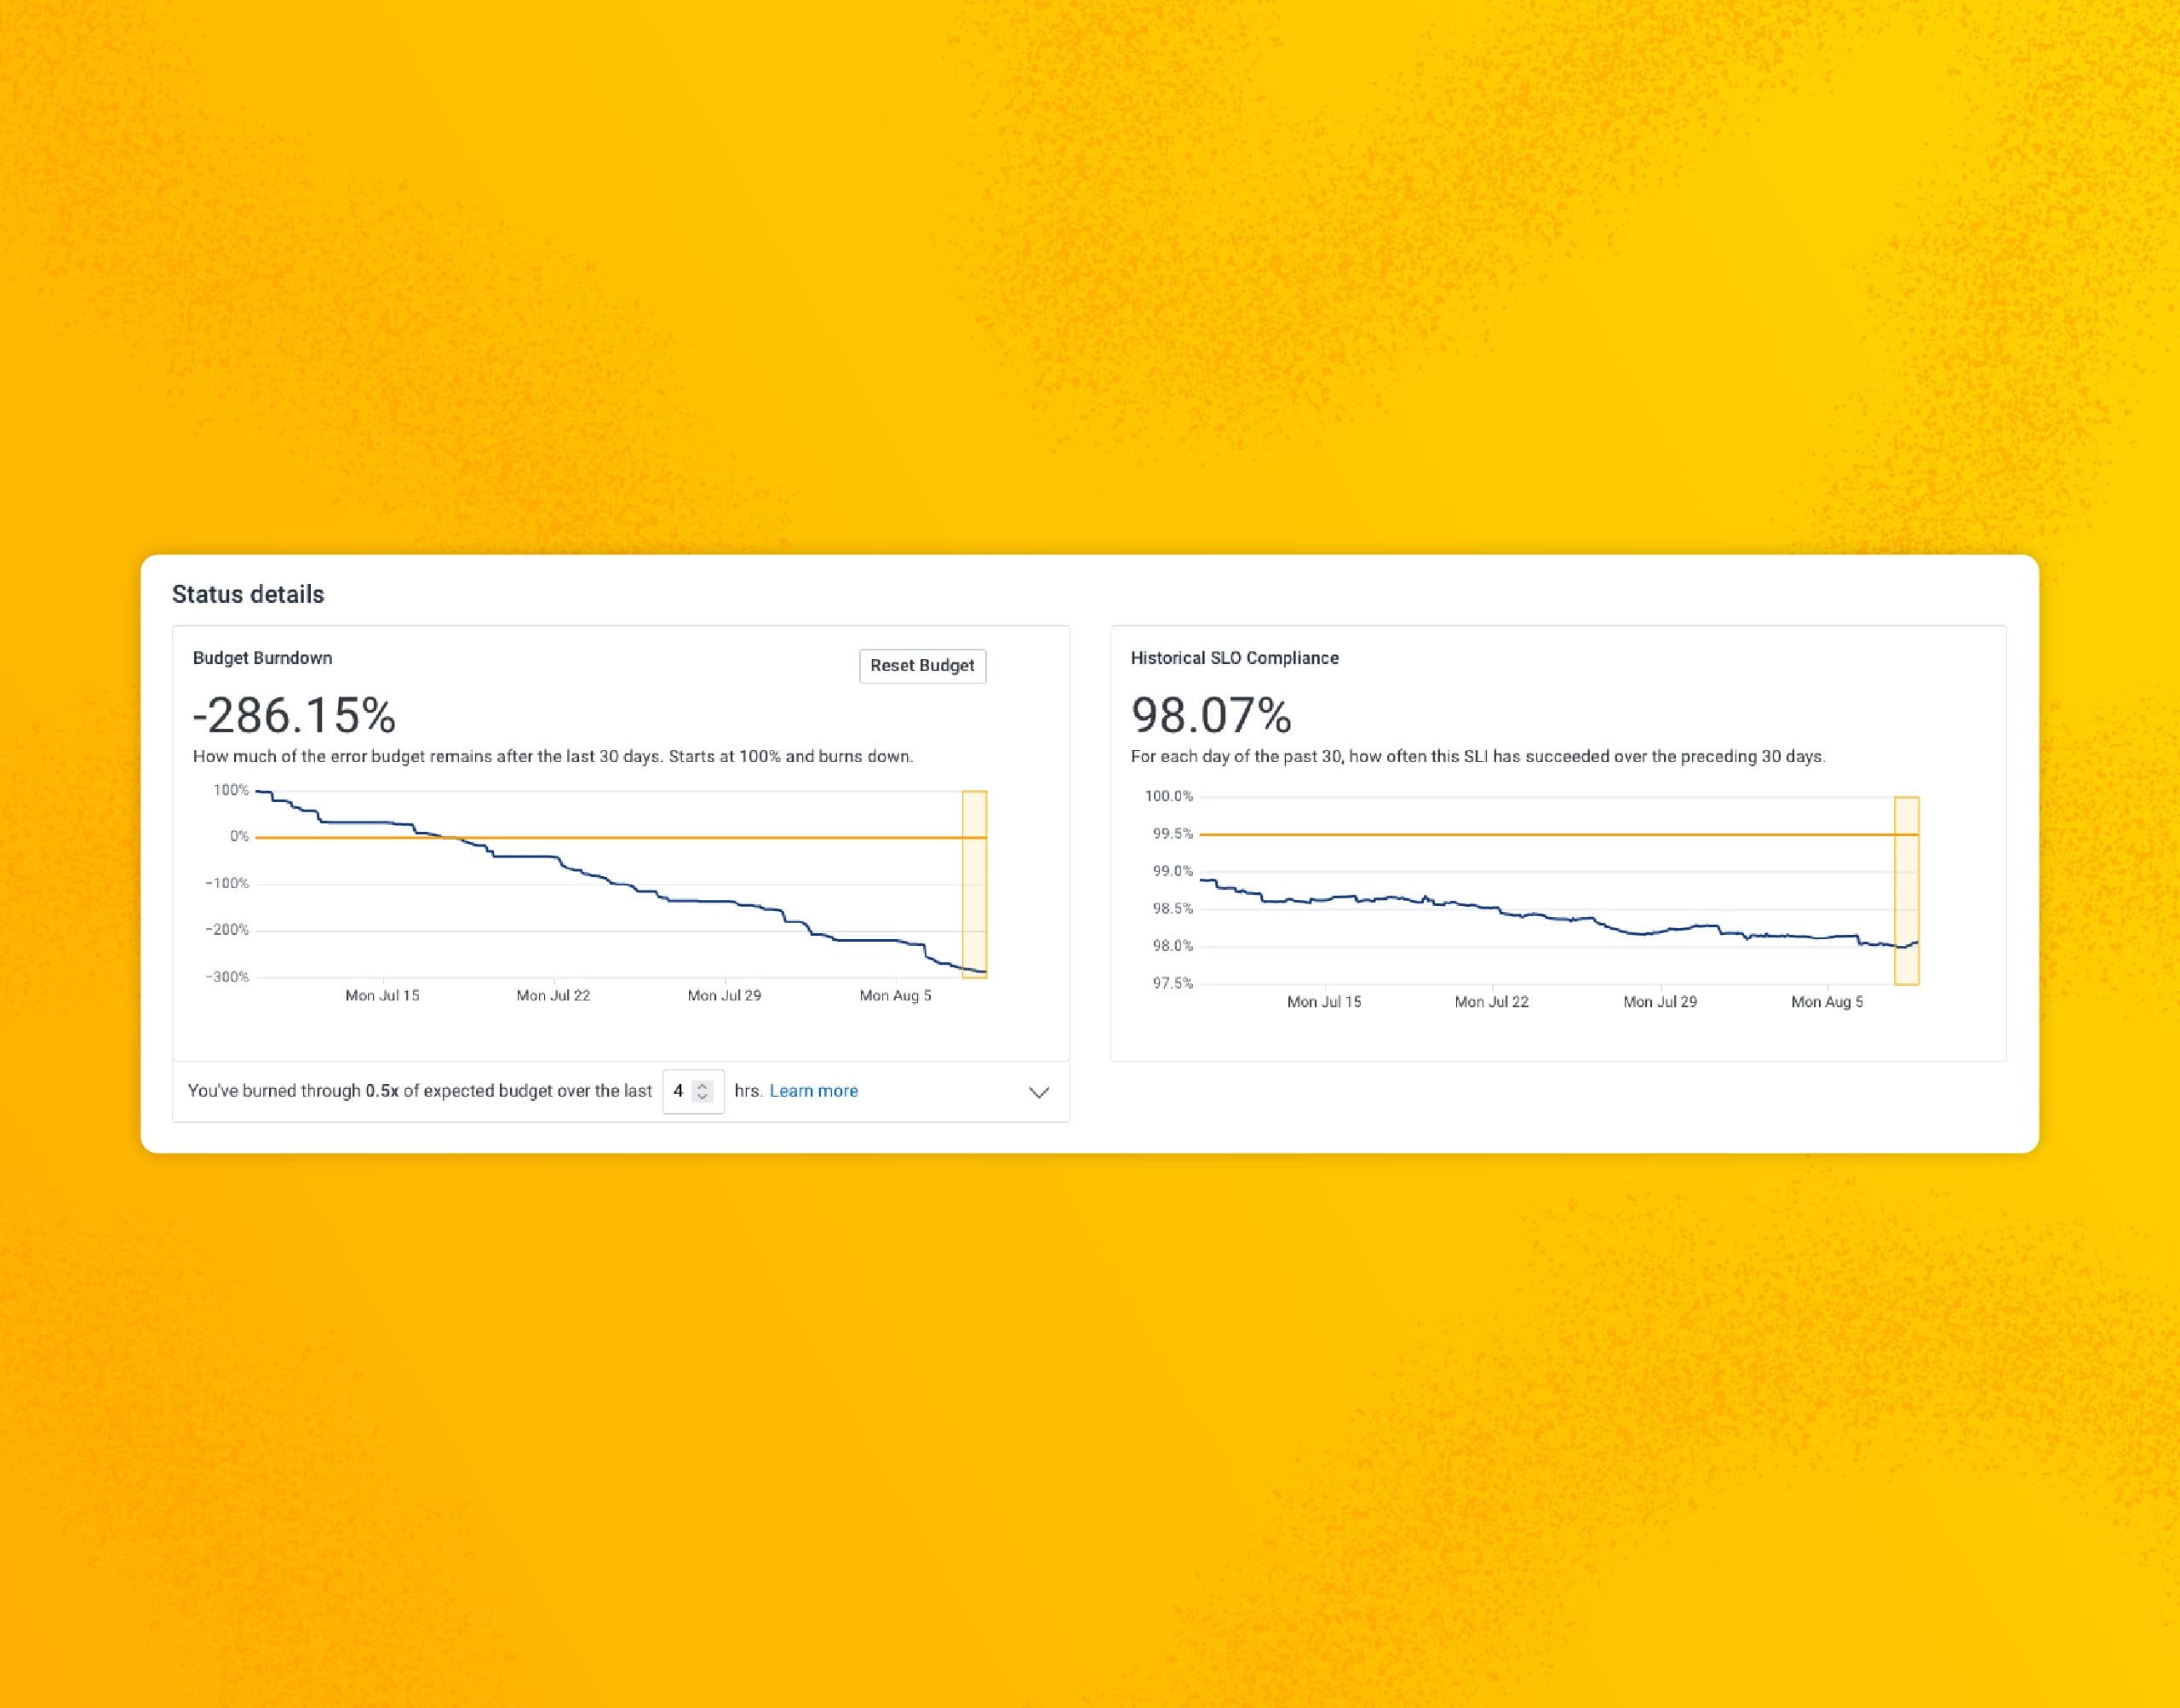
Alerts are a perennial topic, and a CoPE will need to engage with them. The bounds of this problem space are formed by two types of alerts: Reactive alerts (in Honeycomb, we call these Triggers): They are alerts that fire after some event, like crossing a pre-determined boundary. Proactive alerts (Burn Alerts based on Honeycomb’s SLO feature): These give notice before crossing a threshold; in the case of SLOs, that means before failing to meet the stated objective.
The previous post laid out the basic idea of instrumentation and how OpenTelemetry’s auto-instrumentation can get teams started. However, you can’t rely only on auto-instrumentation. This post will discuss the limitations in more detail and how a CoPE can help teams overcome them.
Martin Thwaites
The Collector is the focal point for telemetry inside your cluster. Instead of your containerized applications sending directly to your OpenTelemetry-capable backend (the place that allows you to ask questions of your telemetry), we send that data to an internal location first, then forward the data on.
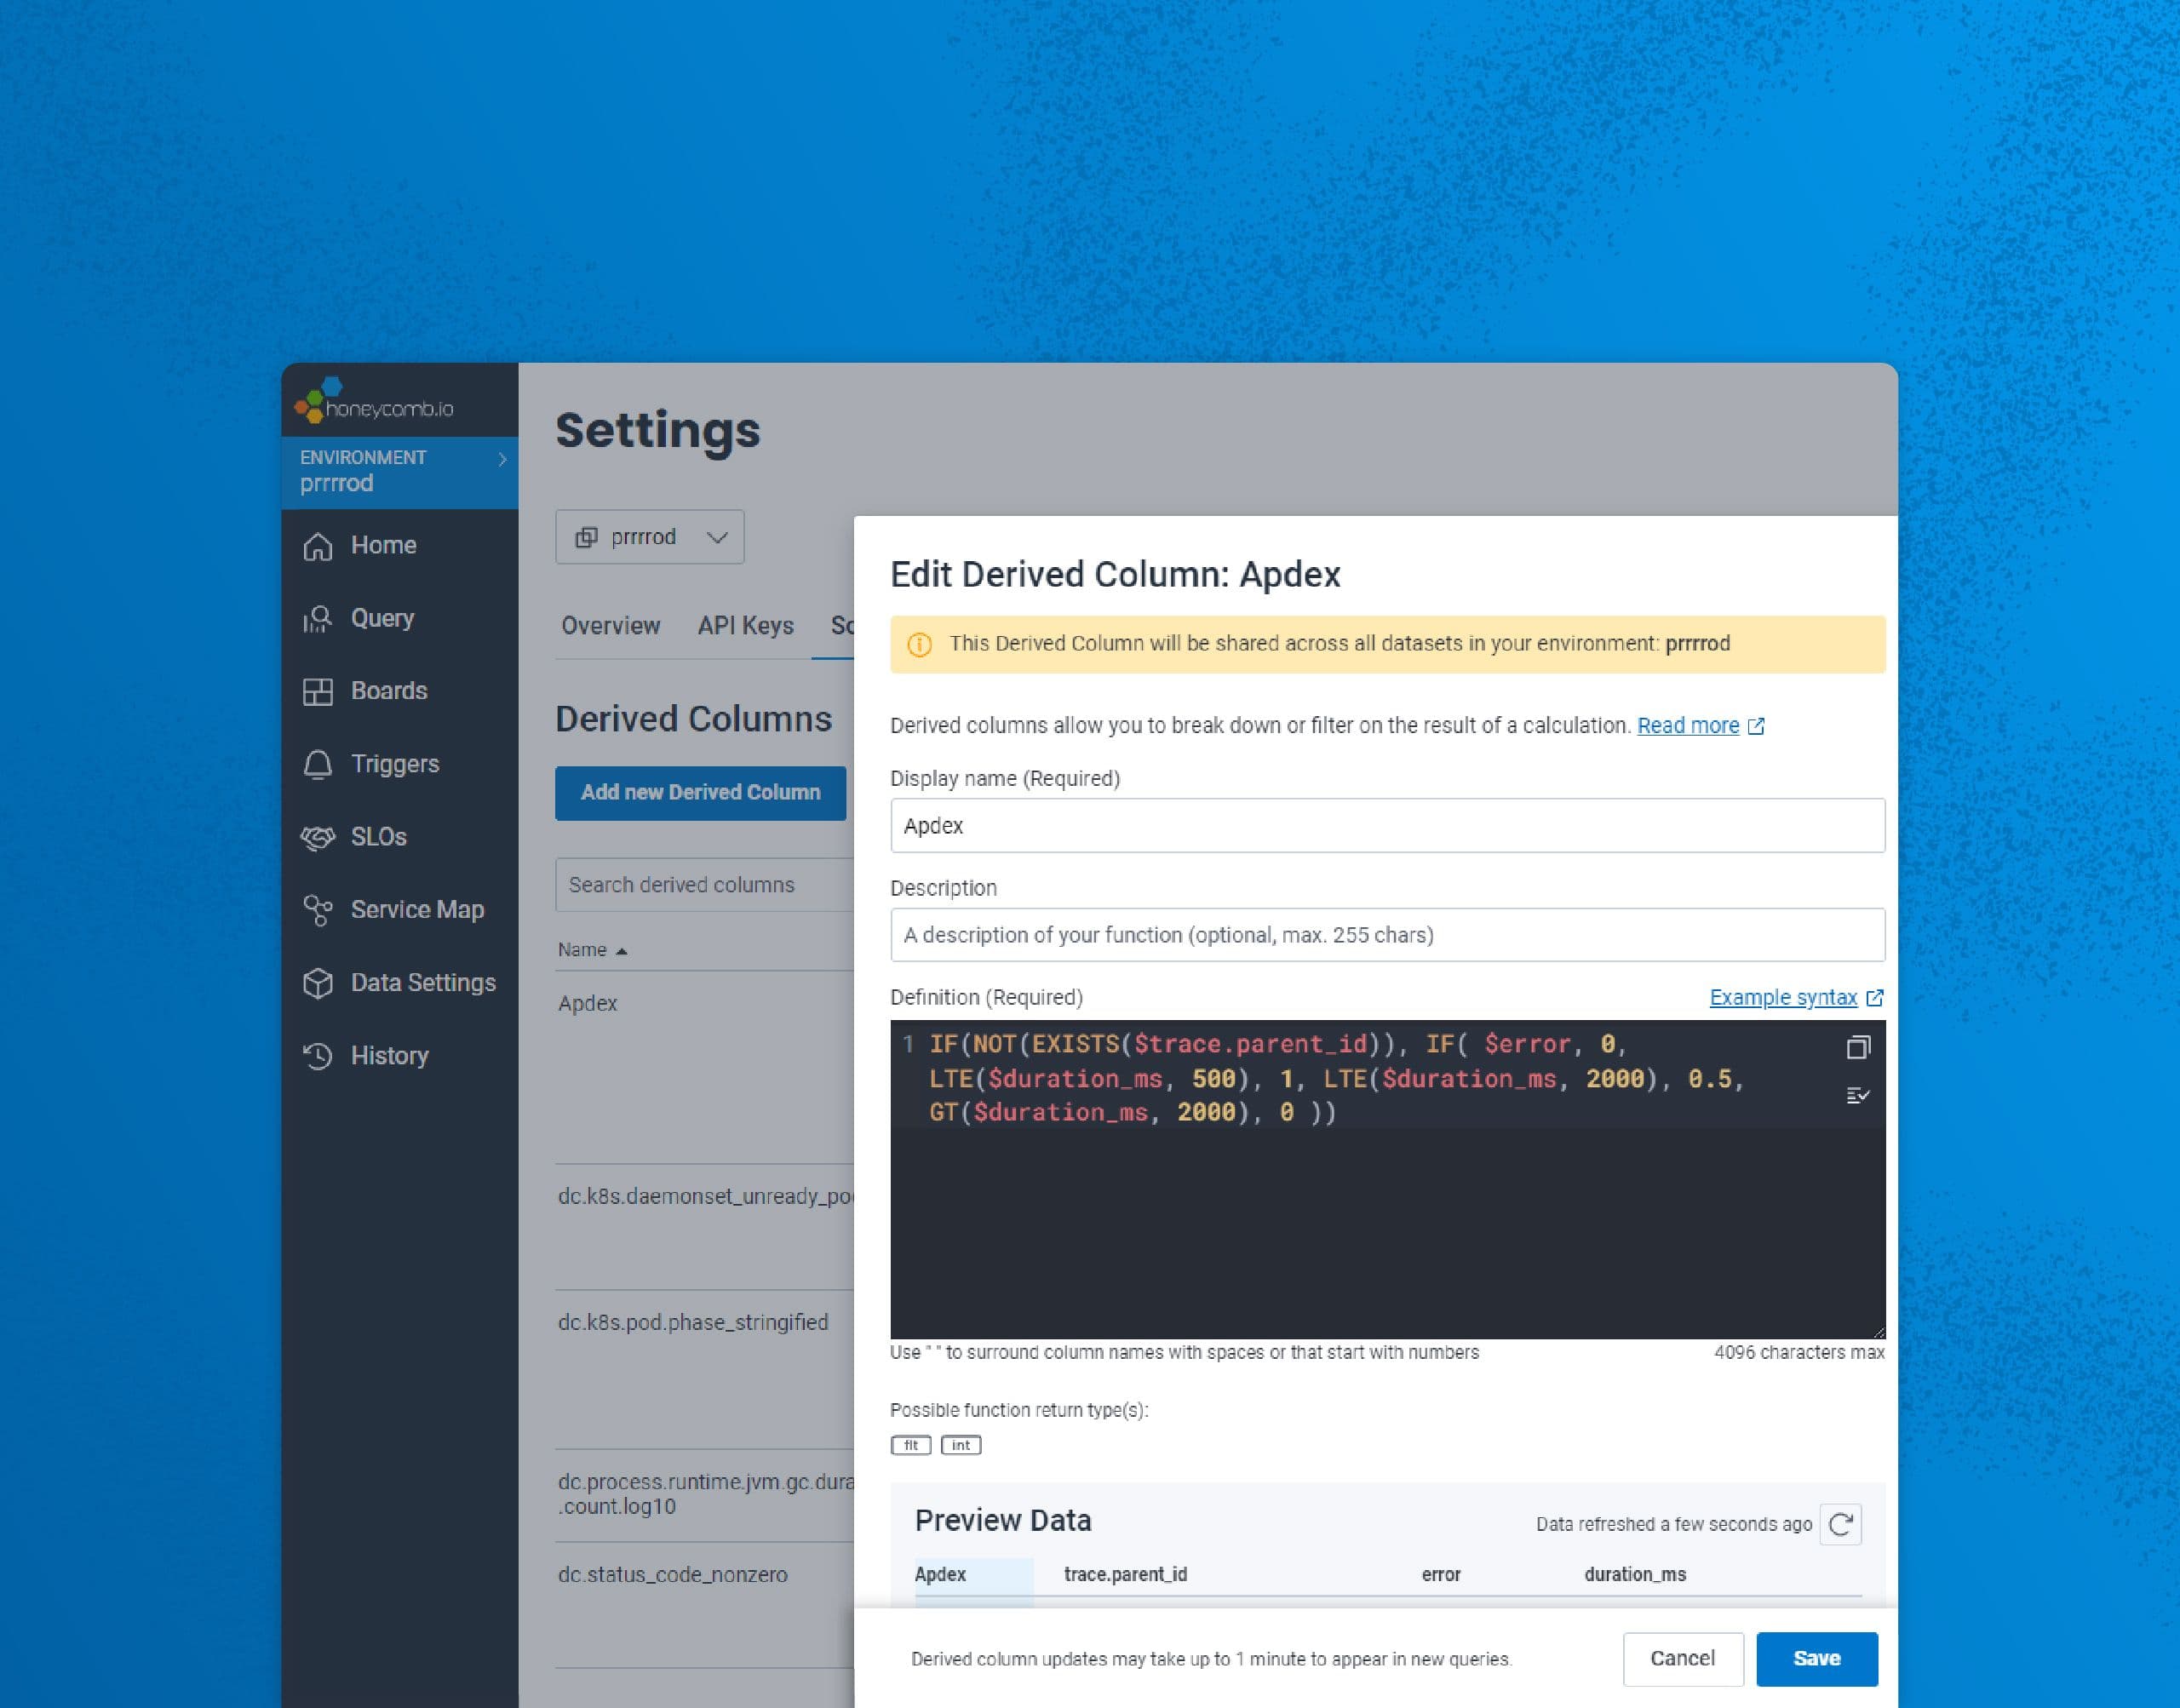
“How is my app performing?” is one of the most common, yet hardest questions to answer. There are myriad ways to measure this, like error rate, average response time, and so on. Enter the Application Performance Index (aka Apdex), a single metric that attempts to answer, “Are my application’s users happy?”
It’s one of my strongly held beliefs that errors are constructed, not discovered. However we frame an incident’s causes, contributing factors, and context ends up influencing the shape of the corrective items (if any) that get created. I’ll cover these ideas by using our June 3rd incident where a database migration caused a large outage by locking up a shared database and making it run out of connections.