Honeycomb was built for the AI era. Learn how to futureproof your software for what comes next.
Discover why Honeycomb is the better choice for your engineers, your customers, and your bottom line.
Start your journey with the definitive guide to observability. Download our complimentary ebook.
Bring observability to every software engineer.
Learn about our company, mission and values.
Come for the impact, stay for the culture.
See Honeycomb's latest press releases, media, and more
Learn more about becoming a Honeycomb partner.
Already a Honeycomb customer?
Morgante Pell
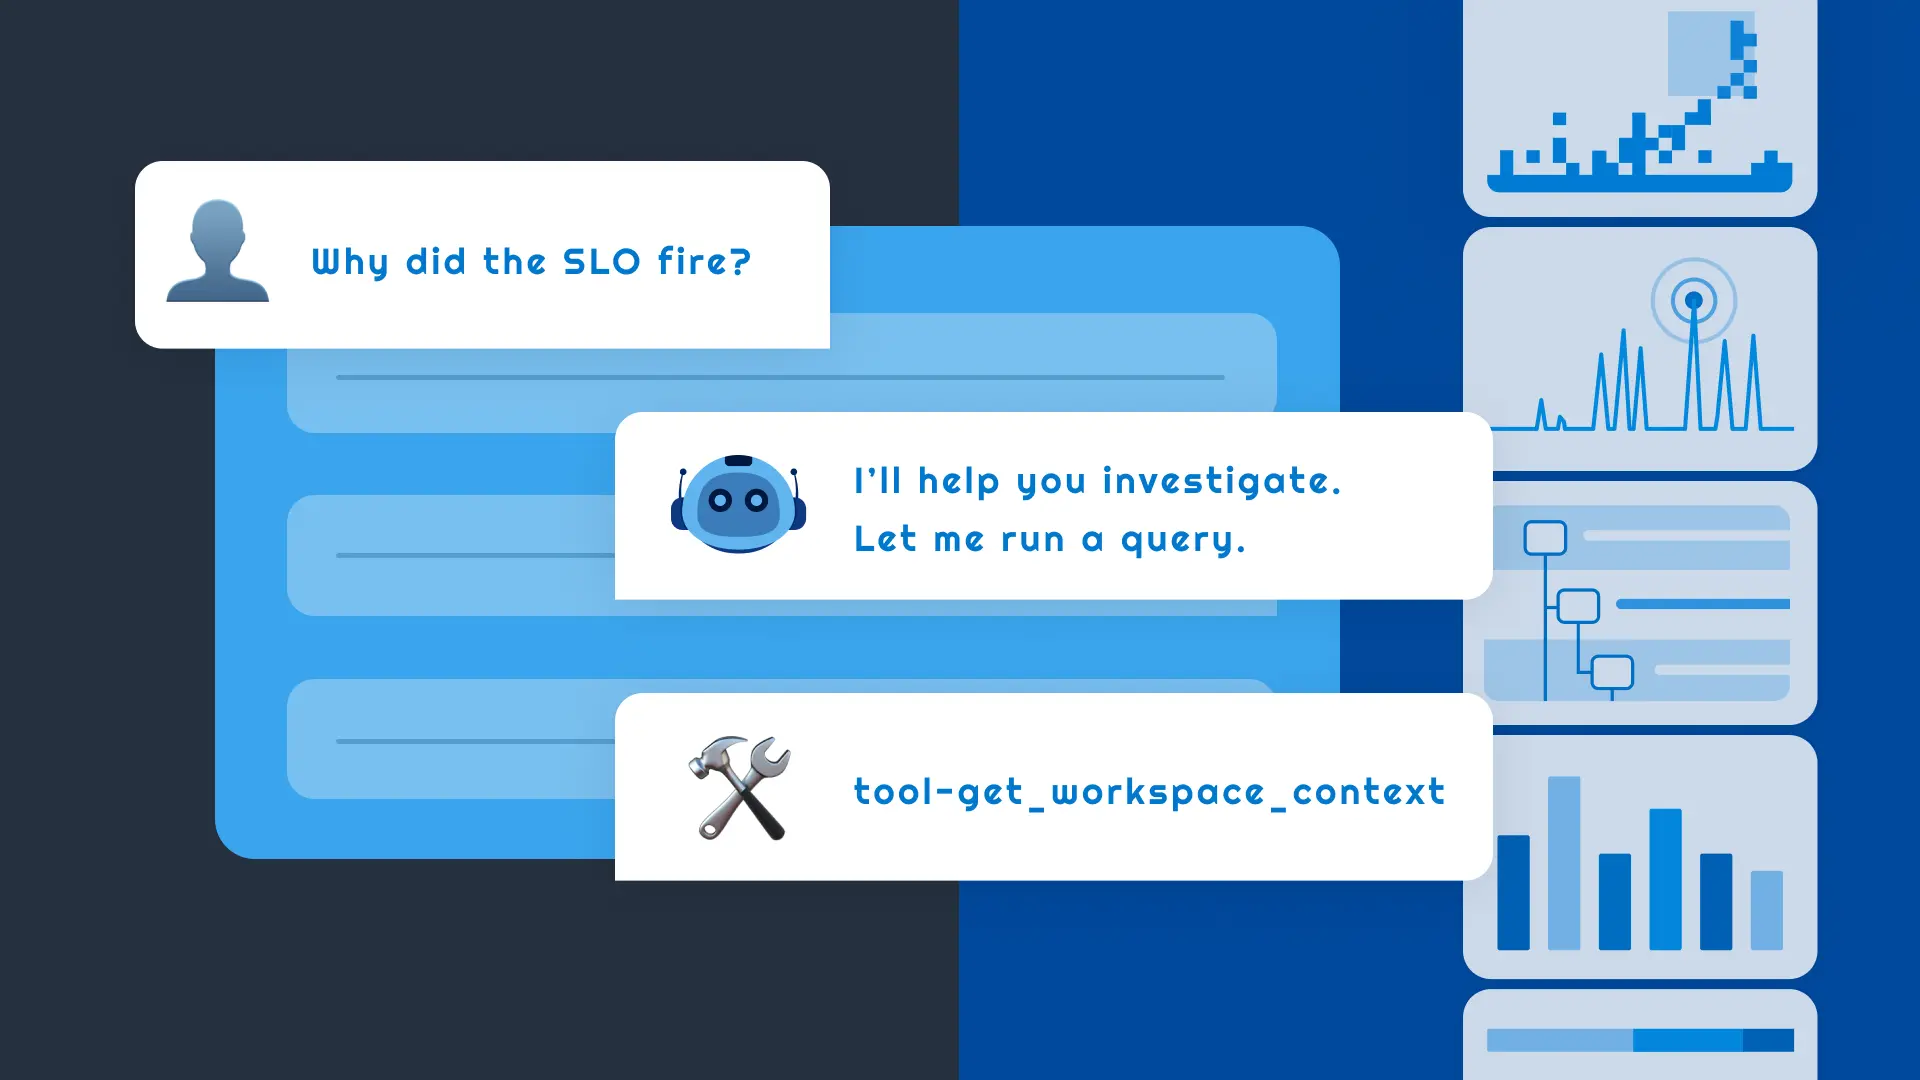
Canvas is an AI-guided workspace inside Honeycomb that combines an AI assistant with an interactive notebook for visualizing query results and traces. You can ask a natural language question about your data and Canvas will immediately start exploring your traces, through multiple queries and other tools, to find the right next steps.
Matt Ransford
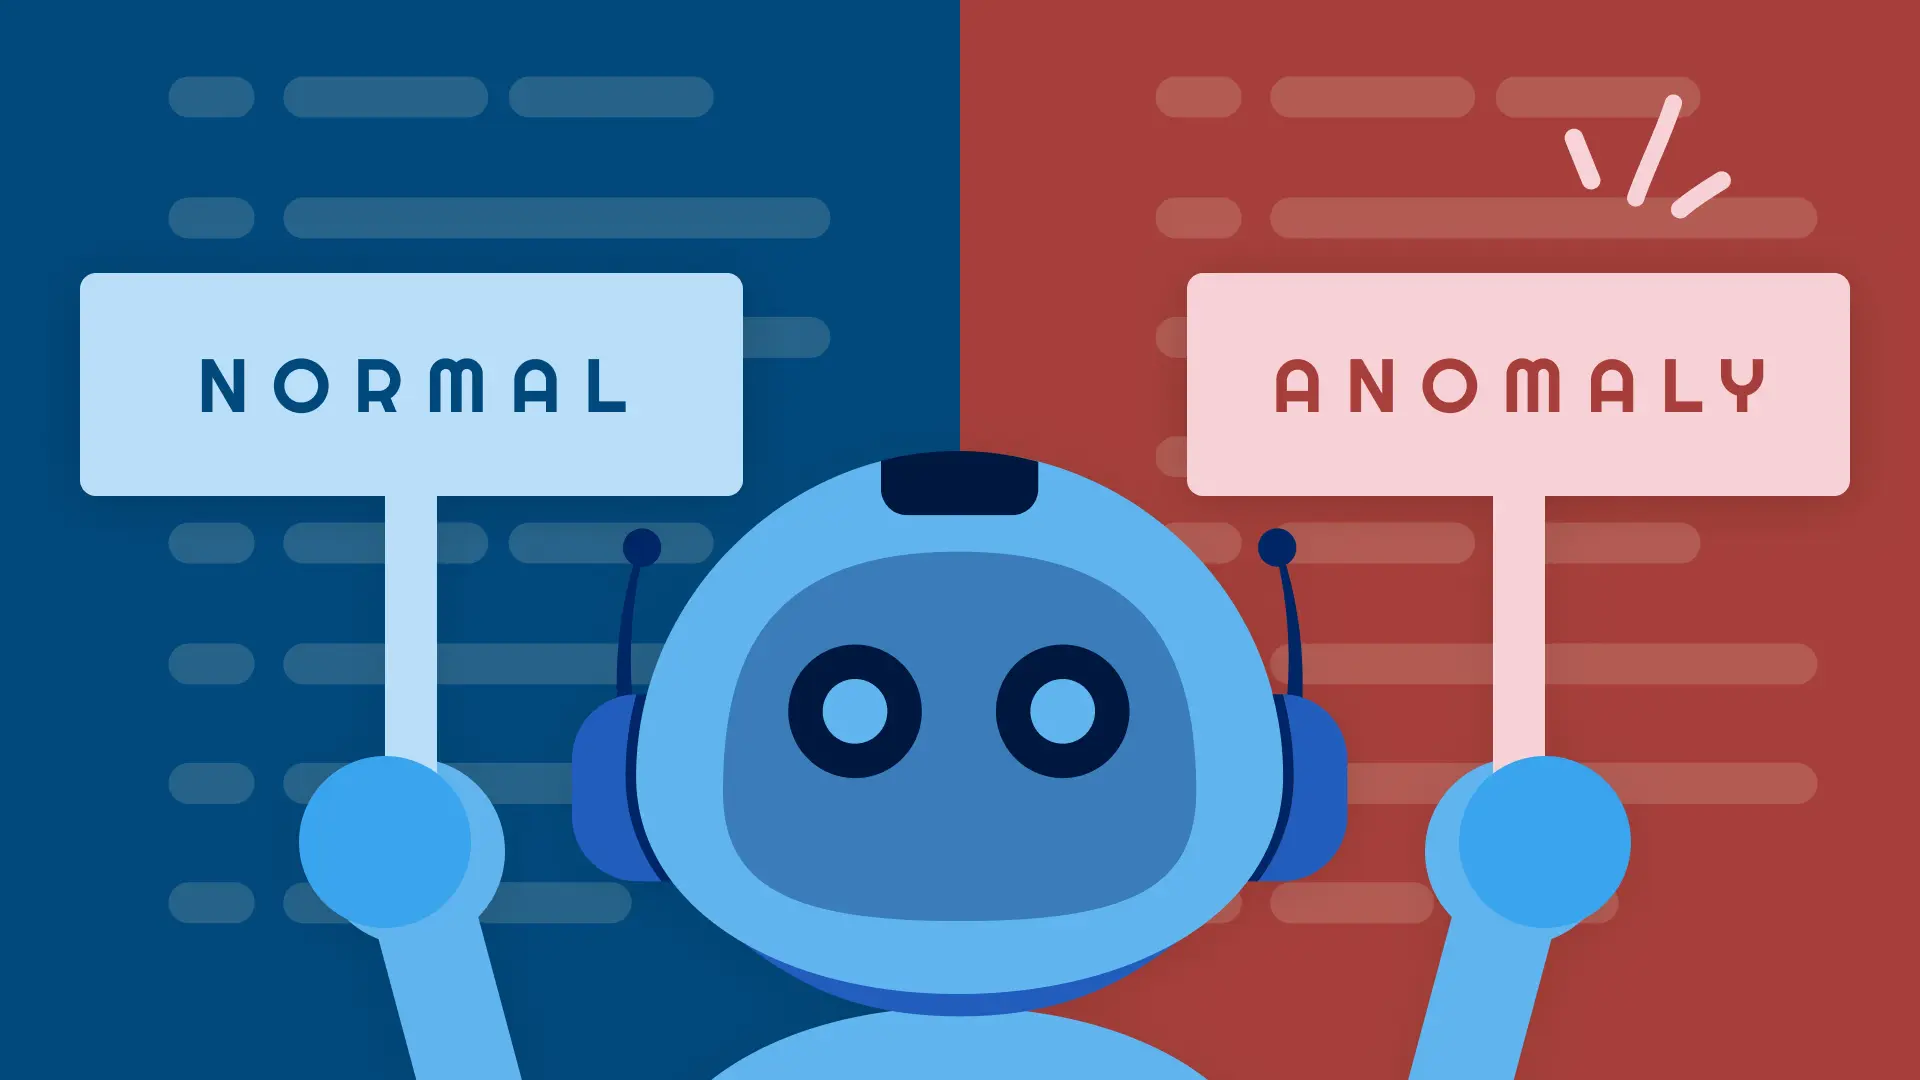
Today, we're excited to announce the release of Anomaly Detection (currently in alpha), Honeycomb's proactive approach to understanding and acting on service health.
Austin Parker
If you’ve been following my public journey with LLMs this year, it probably won’t surprise you to learn that this blog post is an announcement about the general availability of Honeycomb’s hosted MCP server. I want to share a few updates about what’s new in the GA release, discuss some interesting learnings from building it, and share examples of how we’re using MCP internally.
Kat Telles
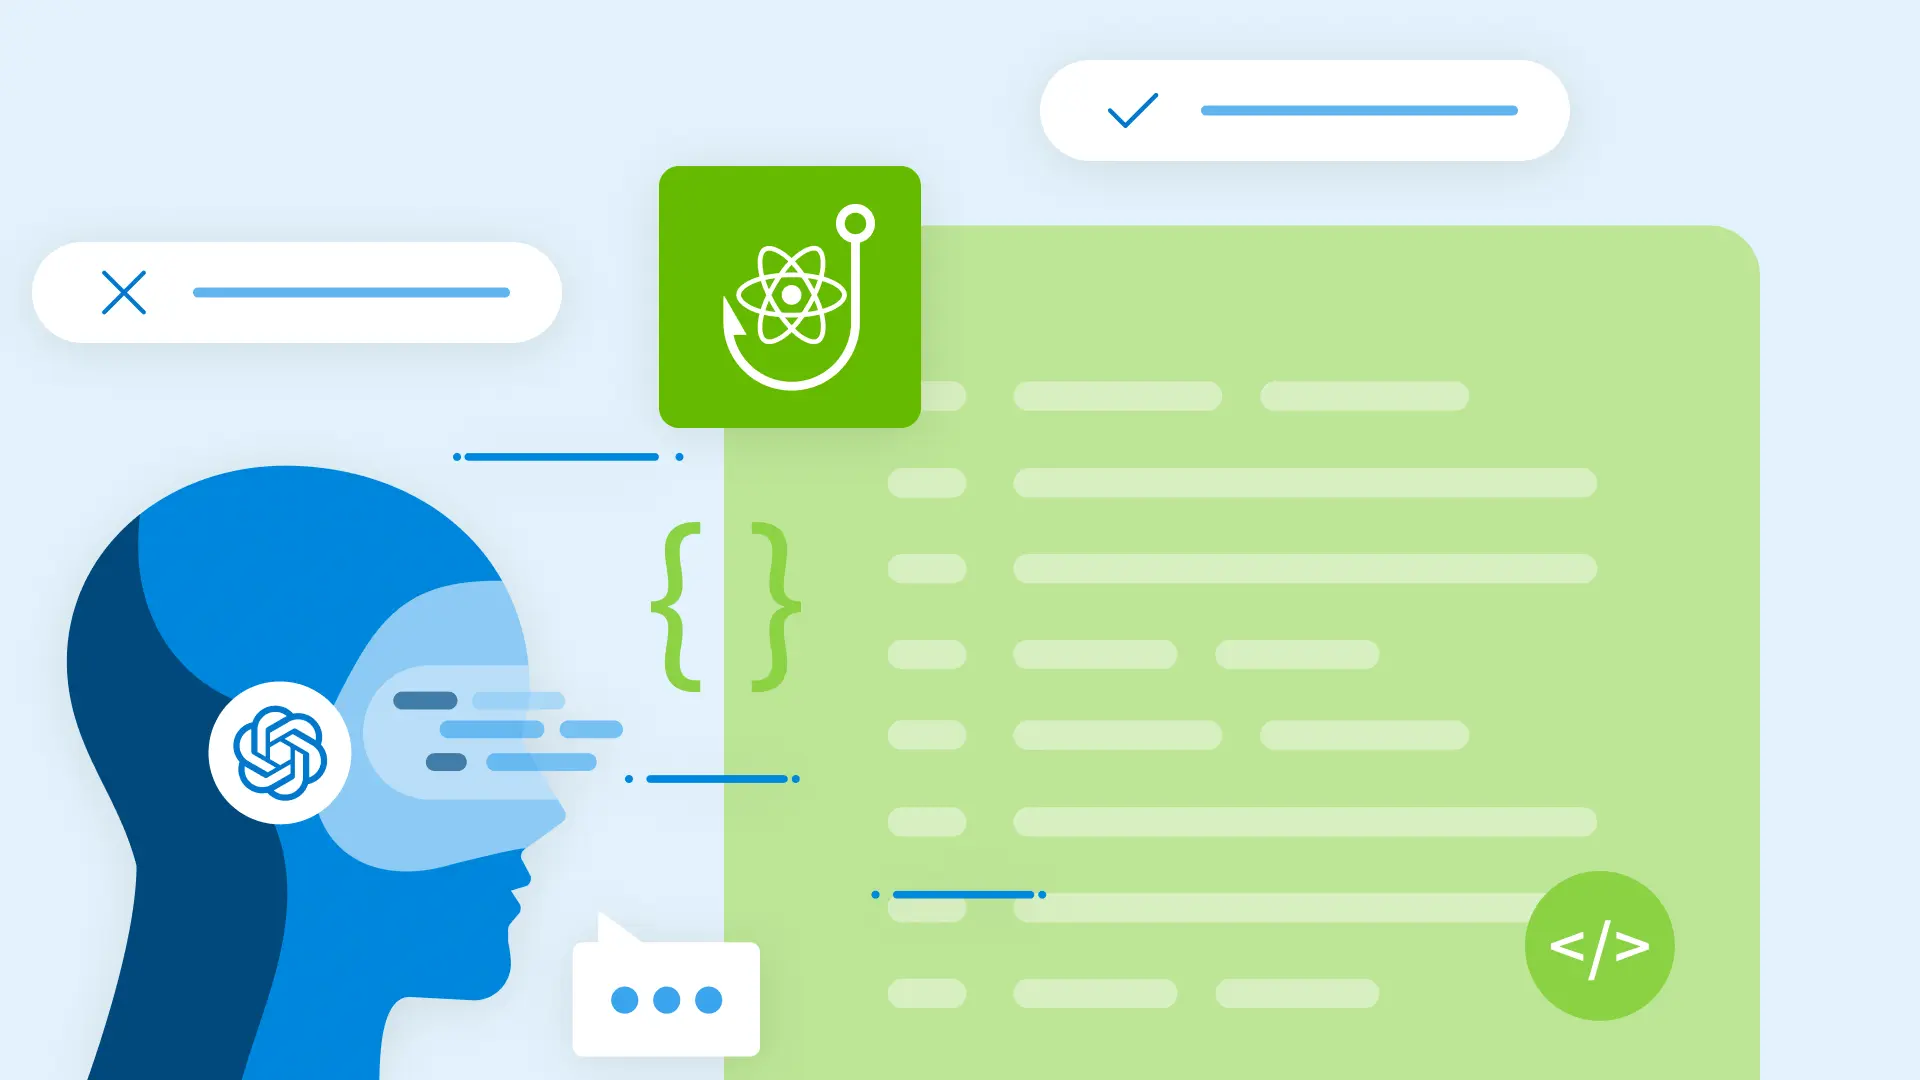
I’m a product engineer at Honeycomb. While my work spans the stack, I’m currently focused on deepening my frontend expertise. To support this, I’ve been using ChatGPT as a study assistant. It’s helped me break down complex topics with clear explanations, real-world examples, and—critically—interactive practice.
Mae Capozzi
At risk of sounding too obvious, without an observability tool, it’s extremely difficult to reason about a complicated frontend system. Especially when hundreds of engineers are shipping code every day.
Rox Williams
Observability tools like Honeycomb are built for engineers, not PM teams… but that doesn’t mean there’s no benefit to having your PMs in Honeycomb. Whether it’s debugging a weird customer issue or tracking how a feature is used in the wild, observability gives PMs something traditional product tools can’t: real-time answers with full context, down to a single user.
New Relic is a well-known application performance monitoring (APM) solution that helps engineers visualize, monitor, and troubleshoot their systems. As businesses evolve, engineers must deliver new capabilities at greater scale and speed, often while managing an increasing number of services and systems. This naturally raises the question: what tools can help?
We’re proud to announce an integration suite to help you monitor and understand your Claude usage and costs not just in Honeycomb, but in any observability tool that supports OpenTelemetry.
Jason Harley
We're thrilled to announce that Honeycomb Tags are now generally available across SLOs, triggers, and boards! Over 100 customers are already actively tagging their observability resources in Honeycomb today.
Elsie Phillips
Traditional error tracking surfaces what broke. Honeycomb shows you why, and how to fix it. With Error Analysis in Honeycomb for Frontend Observability, now in public beta, teams get a streamlined way to investigate and prioritize client-side errors without writing a single query.
Charity Majors
Every day I seem to run into yet another post with someone solemnly opining that “writing code has never been the hardest part of software engineering.
Katie Leonard
You don’t need to be a power user to get powerful results. I’m not training models or prompting GPTs into poetry—I’m just using them to do what great managers already try to do: communicate clearly, prioritize outcomes, and lead with intention.
Get it delivered straight to your inbox.
By subscribing to our newsletter, you agree to Honeycomb’s Terms of Service and Privacy Notice.
Ken Rimple
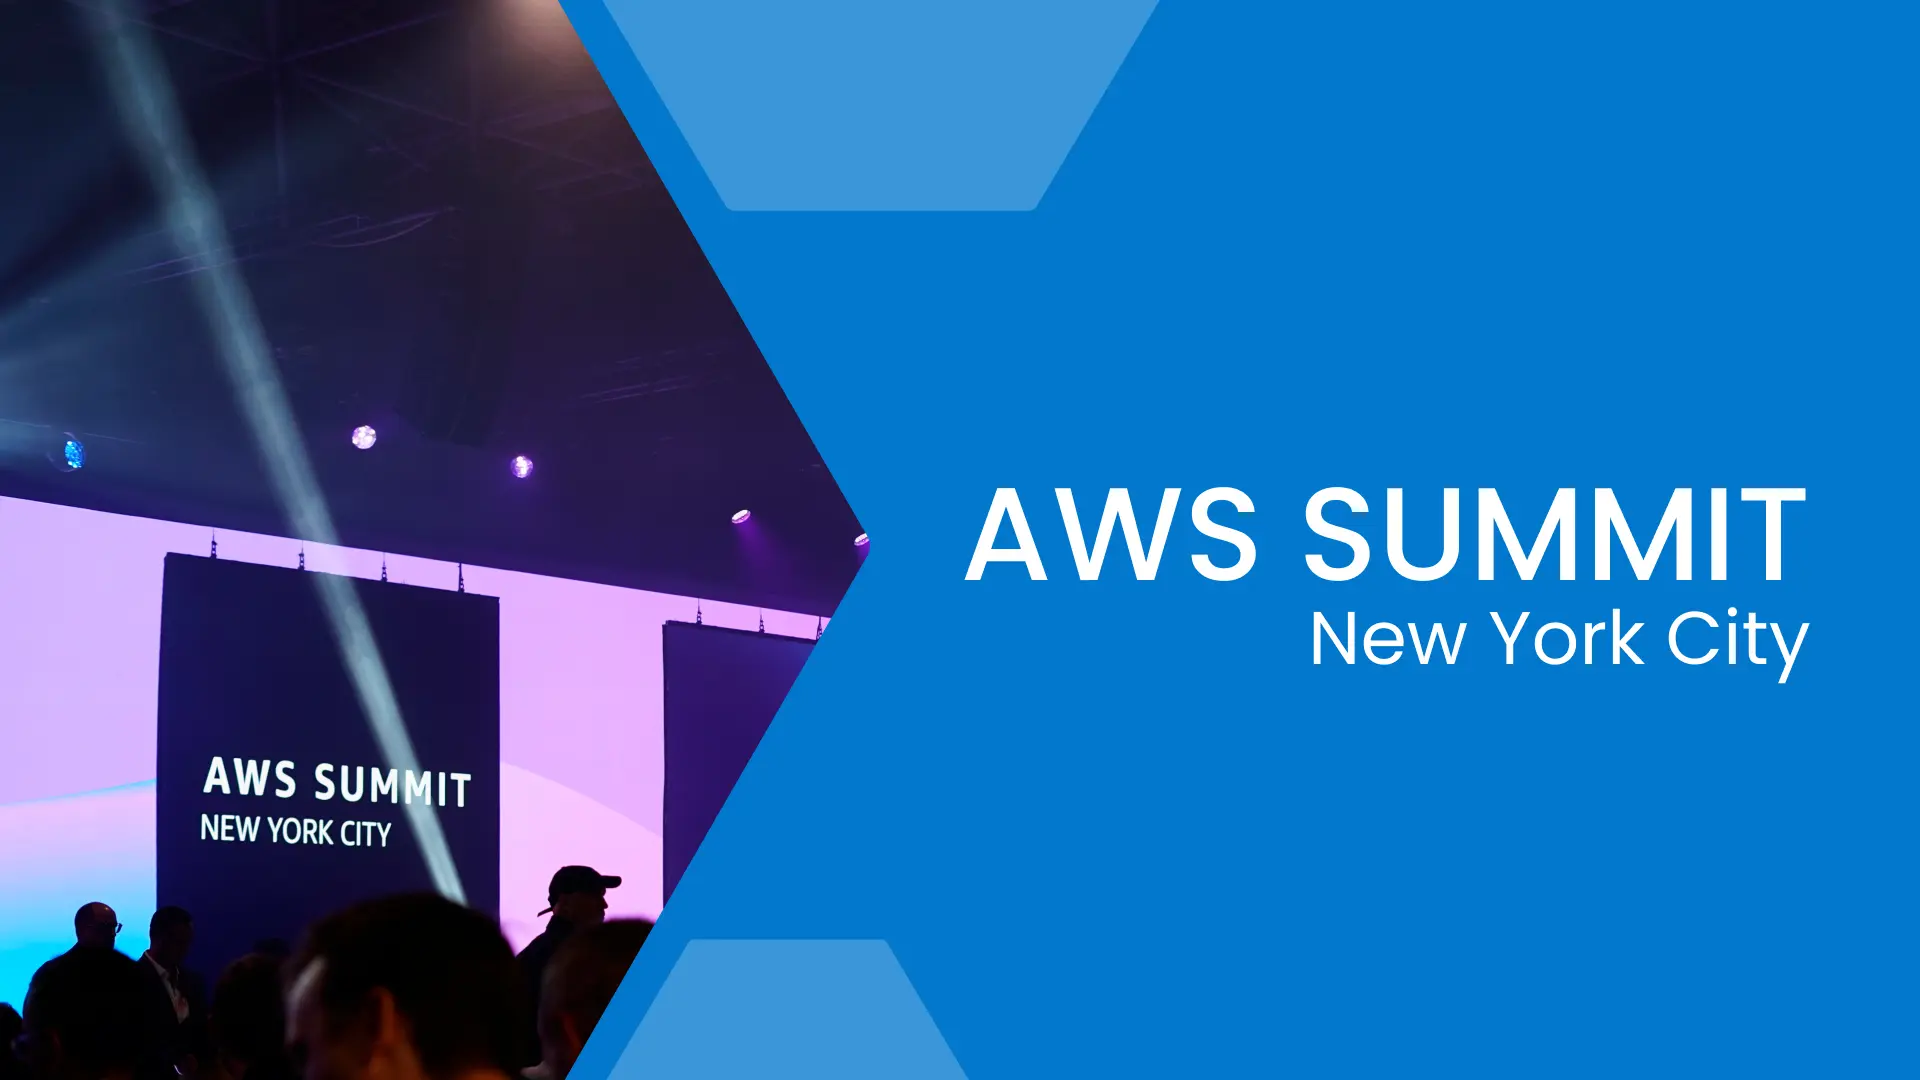
If you’re unfamiliar with AWS Summits, these are conferences that occur on a yearly basis in different cities. The events are mostly used to announce new products and technologies. This year, the theme was AI, as evidenced by the keynote, a large majority of the talks, and a walk around the vendor floor.
Jessica Kerr (Jessitron)
Some people can get an AI assistant to write a day’s worth of useful code in ten minutes. Others among us can only watch it crank out hundreds of lines of crap that never works. What’s the difference?
Julie Neumann
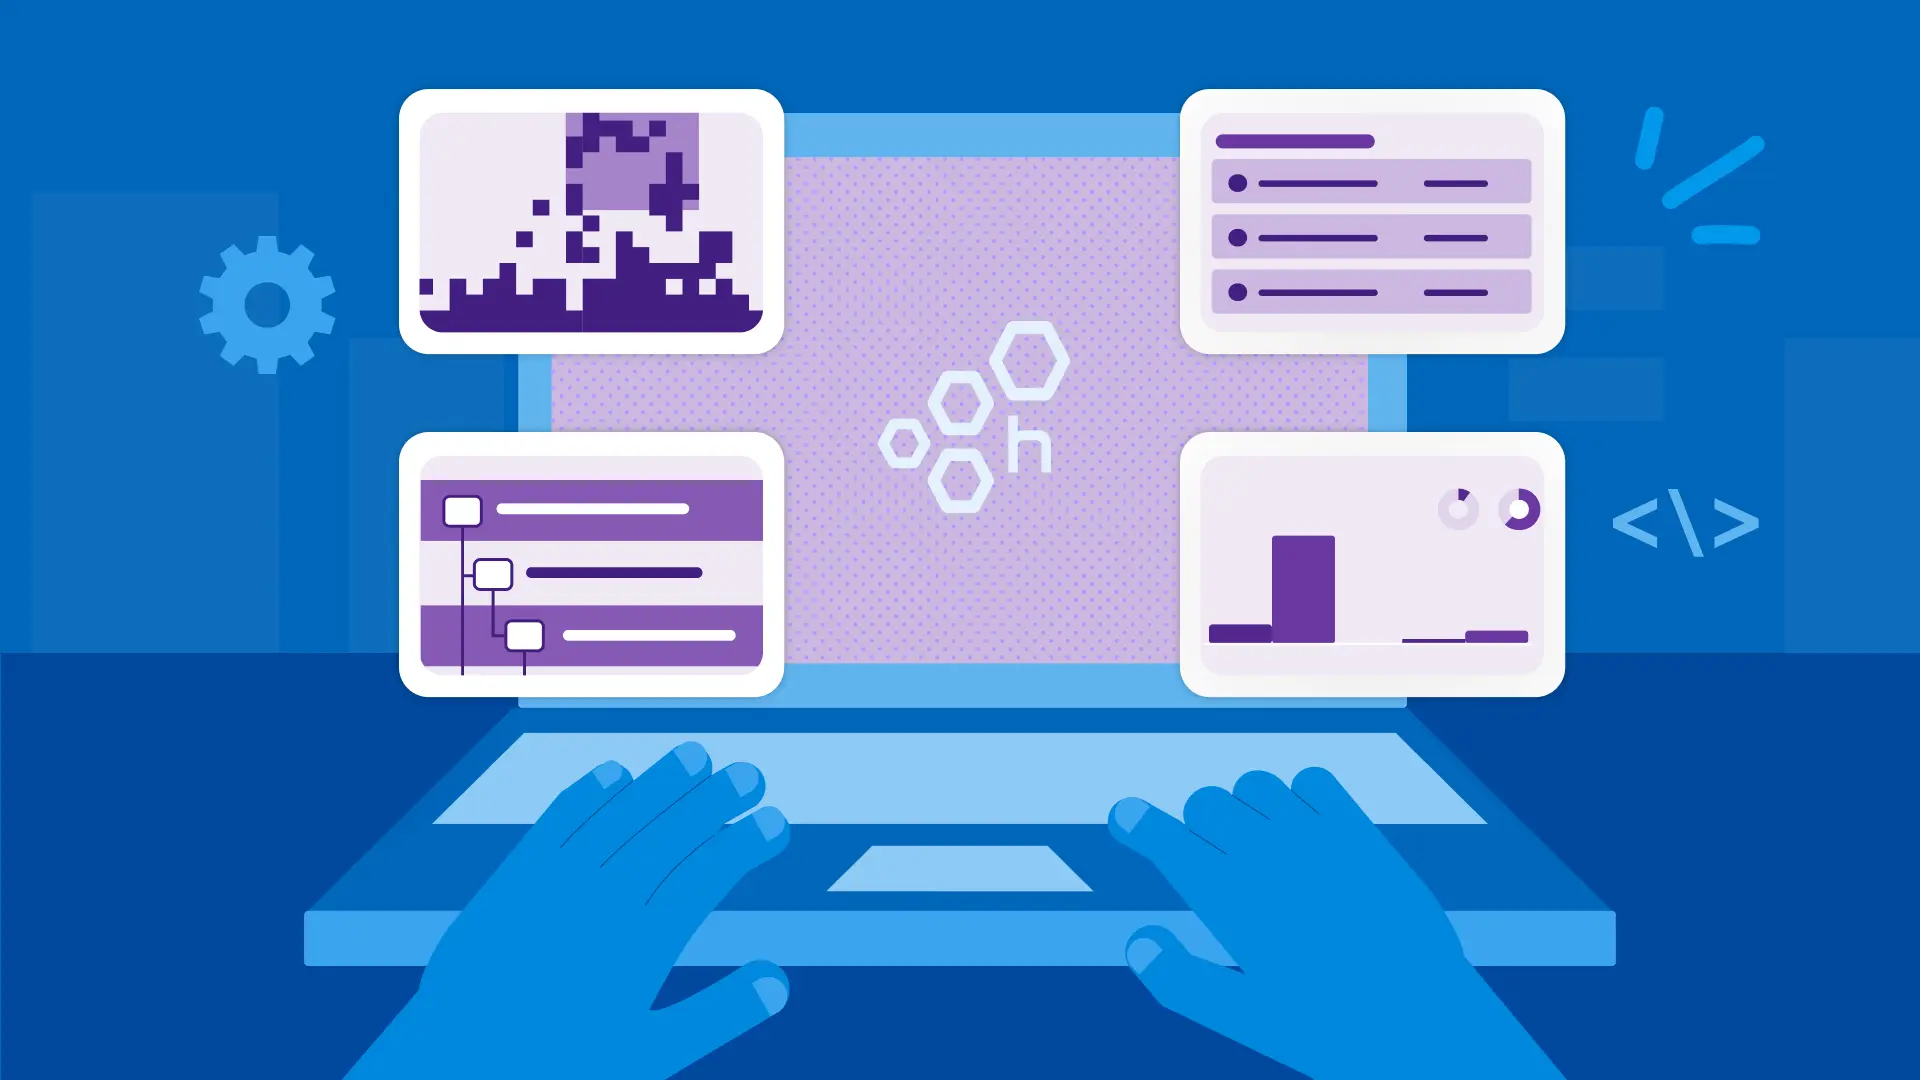
I’m pleased to announce the public beta of Honeycomb Hosted MCP, along with our first wave of one-click integrations for Cursor, Visual Studio Code, and Claude Desktop.
OpenTracing was created to solve this problem by providing a vendor-neutral implementation to instrument code for distributed tracing. Over time, the community recognized the need for a broader, unified standard that went beyond tracing to also include metrics and logs.
Bernardo Guerreiro
Irving Popovetsky