Honeycomb was built for the AI era. Learn how to futureproof your software for what comes next.
Discover why Honeycomb is the better choice for your engineers, your customers, and your bottom line.
Start your journey with the definitive guide to observability. Download our complimentary ebook.
Bring observability to every software engineer.
Learn about our company, mission and values.
Come for the impact, stay for the culture.
See Honeycomb's latest press releases, media, and more
Learn more about becoming a Honeycomb partner.
Already a Honeycomb customer?
Austin Parker
Seems like you can’t throw a rock without hitting an announcement about a Model Context Protocol server release from your favorite application or developer tool. While I could just write a couple hundred words about the Honeycomb MCP server, I’d rather walk you through the experience of building it, some of the challenges and successes we’ve seen while building and using it, and talk through what’s next. It should be pretty exciting, so strap in!
Christine Yen
We’re excited to share that Honeycomb has completed our first-ever acquisition: we’re joining forces with Grit, bringing aboard not only a strong team but also compelling technology that supercharges our ability to deliver on our mission: to bring observability to every software engineer.
Martin Thwaites
Observability is way more about software engineering than it is about operations. Operators are users of observability data for monitoring and alerting on systems. They’ll use that telemetry data to scale systems, or potentially debug the outside of applications. In contrast, software engineers are creators, designers, and users of observability data, and where they use that data is much wider than that of pure operators of production systems.
You can’t throw a rock without hitting an online discussion about ‘vibe coding,’ so I figured I’d add some signal to the noise and discuss how I’ve been using AI-driven coding tools with observability platforms like Honeycomb over the past six months. This isn’t an exhaustive guide, and not everything I say is going to be useful to everyone—but hopefully it will clear up some common misconceptions and help folks out.
Mike Terhar
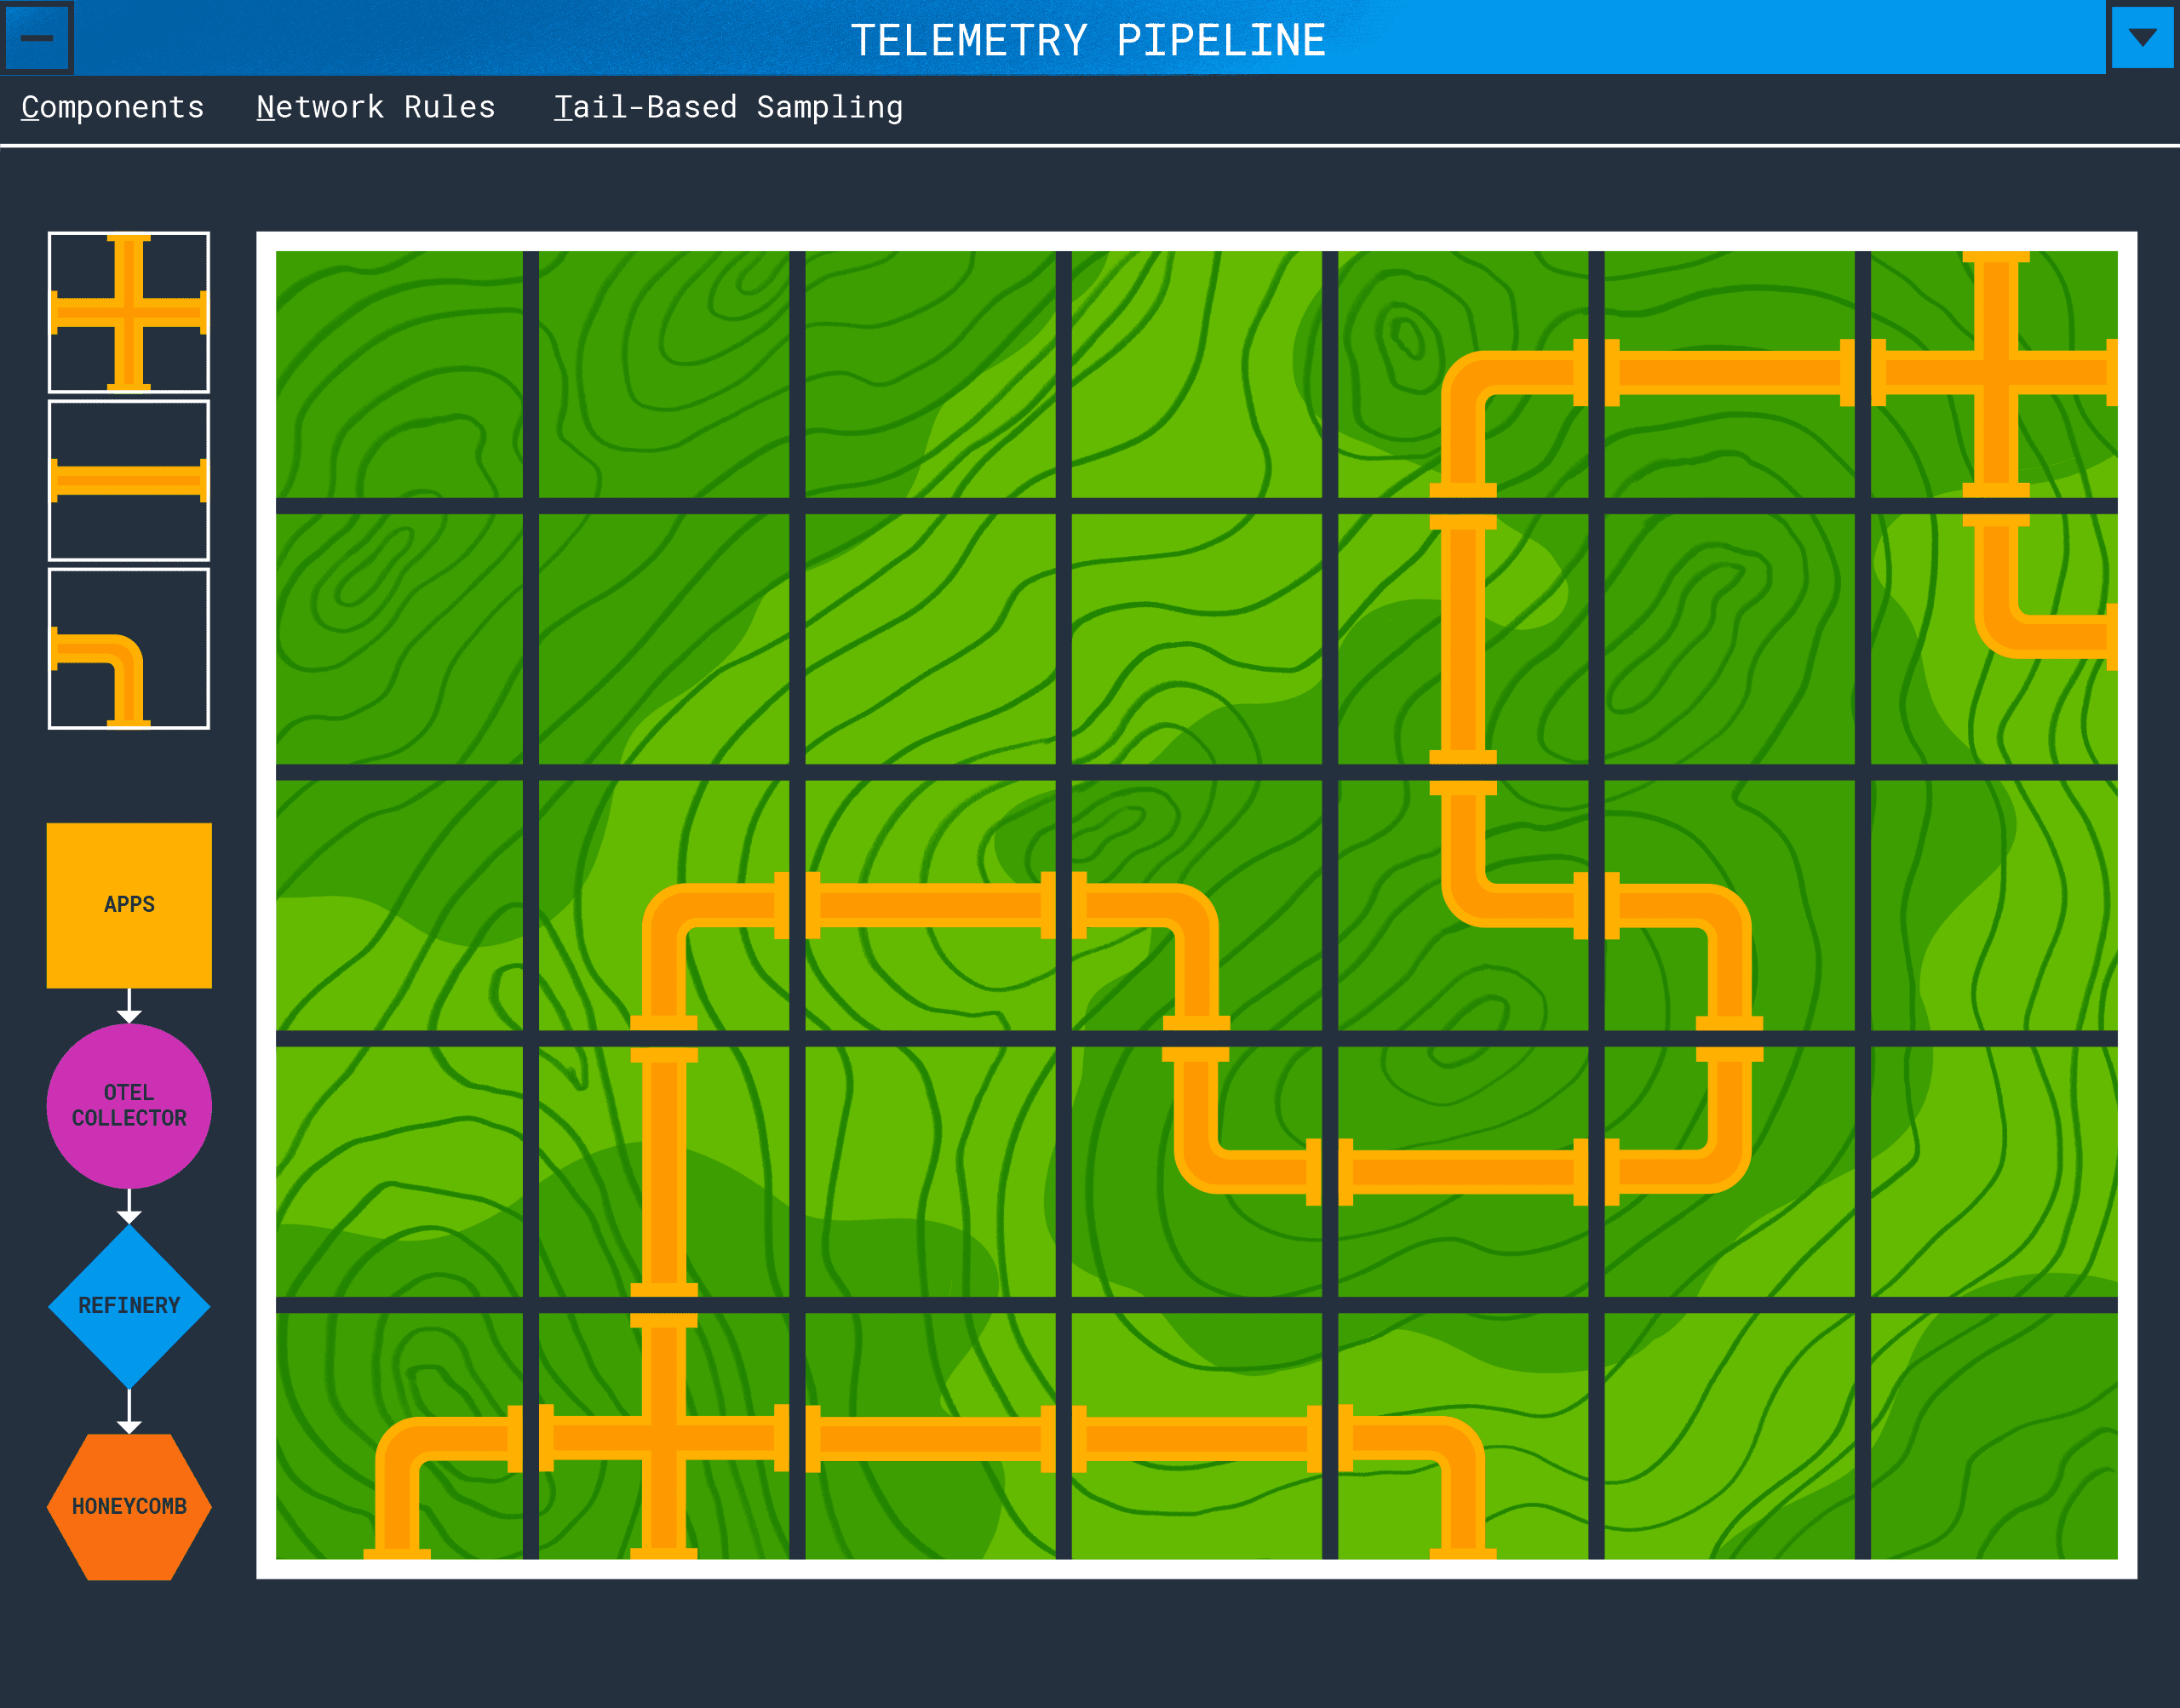
In a simple deployment, an application will emit spans, metrics, and logs which will be sent to api.honeycomb.io and show up in charts. This works for small projects and organizations that do not control outbound access from their servers. If your organization has more components, network rules, or requires tail-based sampling, you’ll need to create a telemetry pipeline.
David Marchante
At Honeycomb, we believe that observability should be accessible, effective, and transformative. That’s why our customer education team is thrilled to introduce Honeycomb Academy, a learning hub designed to help our customers of all experience levels master observability, OpenTelemetry, and the Honeycomb platform.
Grady Salzman
At Honeycomb, we’re actively growing our design system, Lattice, to ensure accessibility, optimize performance, and establish consistent design patterns across our product. One metric we use to measure Lattice is the adoption of components across the product. Adoption is about understanding how, where, and why they’re being used.
Davin Taddeo
CloudWatch metrics can be a very useful source of information for a number of AWS services that don’t produce telemetry as well as instrumented code. There are also a number of useful metrics for non-web-request based functions, like metrics on concurrent database requests. We use them at Honeycomb to get statistics on load balancers and RDS instances. The Amazon Data Firehose is able to export directly to Honeycomb as well, which makes getting the data into Honeycomb straightforward.
Ken Rimple
How many of you started with technologies you still use exactly the same way today? Even if you’re a master Lisp/Clojure developer, you’ve still evolved, right? I should really get my head around those parentheses some day.
Kate Guarente-Smith
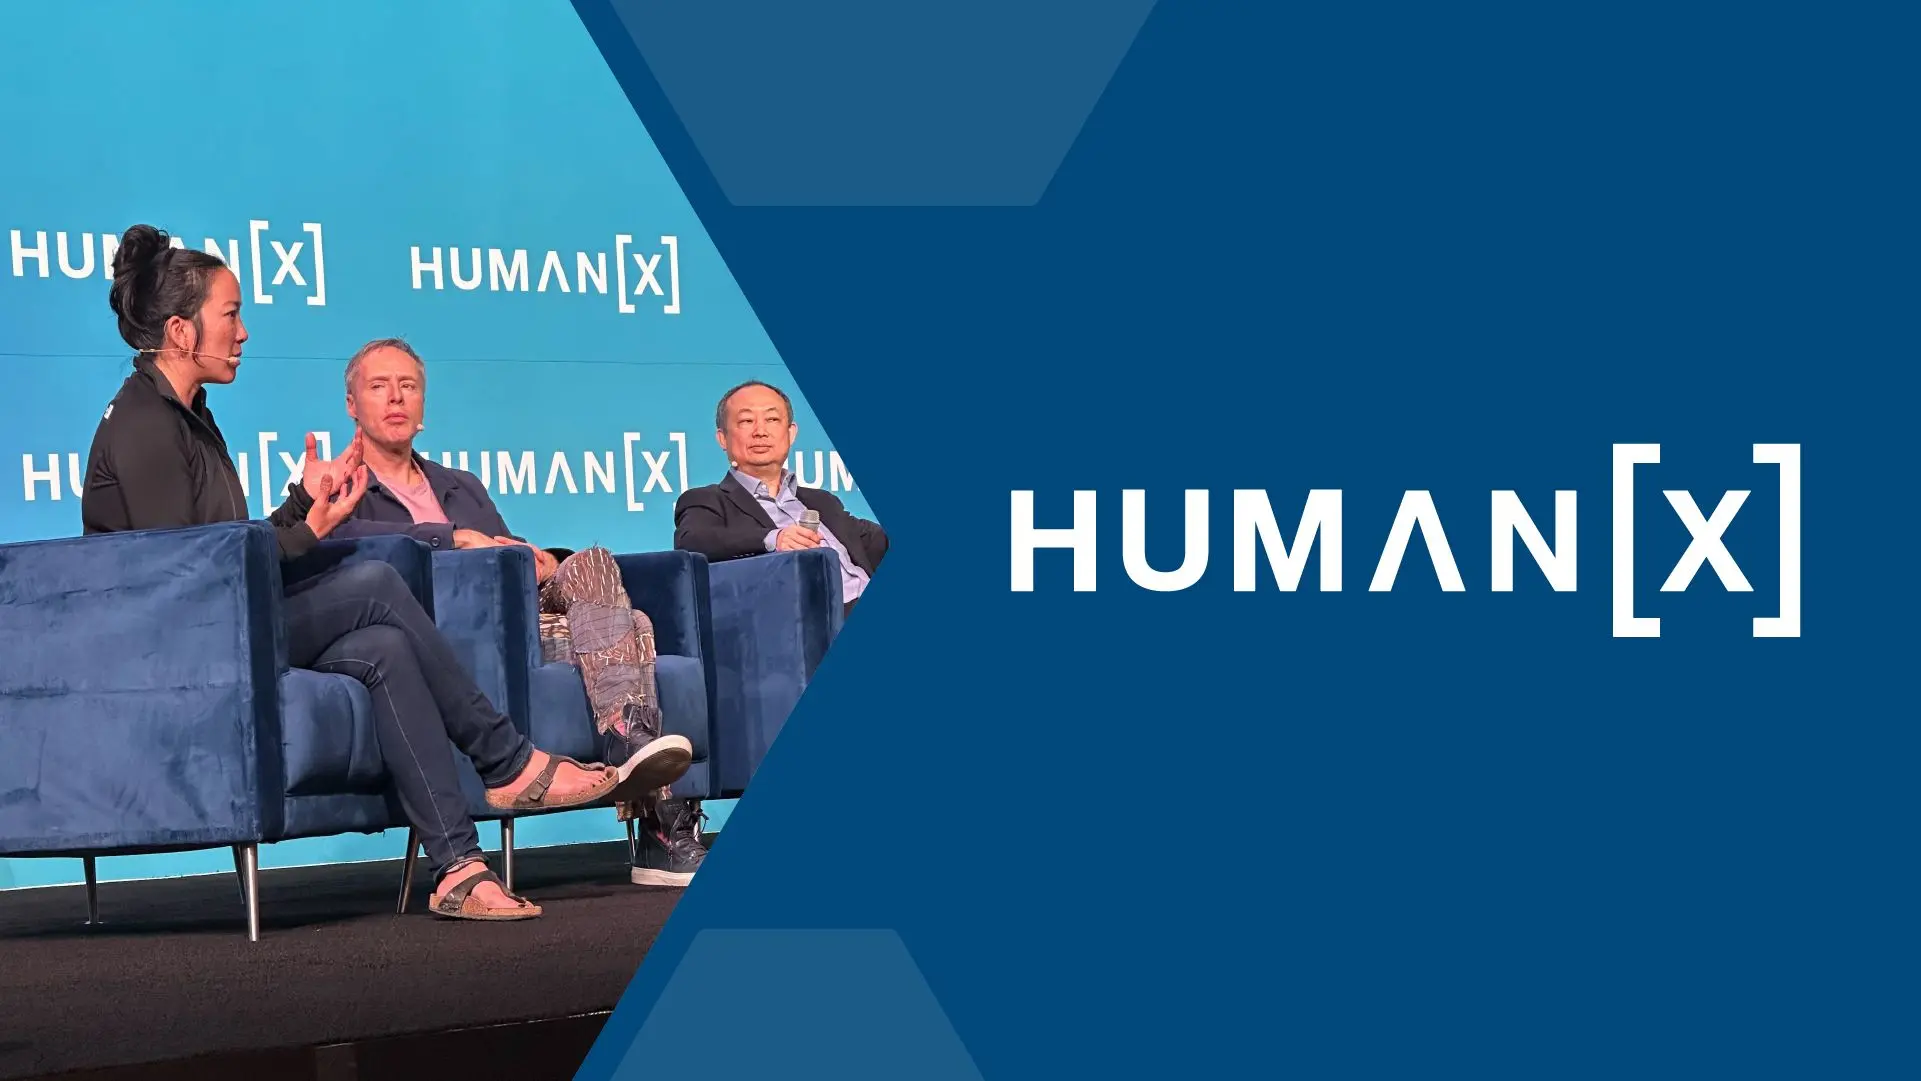
Last week marked the inaugural HumanX conference, a convening of leaders, technologists, policy makers, and media, all brought together to discuss the state of AI and its potential impact on the future of software, business, and society.
Observability and monitoring are not about gathering different data—they differ in their purpose, but share the same data.
Phillip Carter
The common definition of a computer is a programmable machine that stores, retrieves, and processes data. I would argue that ChatGPT already fits this definition, as you can control how it responds with prompts (programs), it can store data you pass it (memory), it can search that data to generate a response (RAG), and it can process inputs to produce a response (inference).
Get it delivered straight to your inbox.
By subscribing to our newsletter, you agree to Honeycomb’s Terms of Service and Privacy Notice.
Molly Stamos
If you’ve been using Honeycomb for a bit, you know that Calculated Fields (otherwise known as derived columns) are a powerful way to transform your events to a format that’s easier to query and understand. However, they use a lisp-esque language that can be difficult to read and a pain to write.
Fahim Zaman
As software teams race to integrate AI into their development workflows, we need to ask ourselves: are AI-powered tools actually making software better?
I first started using AI coding assistants in early 2021, with an invite code from a friend who worked on the original GitHub Copilot team. Back then, the workflow was just single-line tab completion, but you could also guide code generation with comments and it’d try its best to implement what you want.
Fred Hebert
AI is everywhere, and its impressive claims are leading to rapid adoption. At this stage, I’d qualify it as charismatic technology—something that under-delivers on what it promises, but promises so much that the industry still leverages it because we believe it will eventually deliver on these claims.
Rox Williams
In this blog, we’ll explore OpenTelemetry metrics, how they work, and how to use them effectively to ensure your systems and applications run smoothly.
OpenTelemetry is a big, big project. It’s so big, in fact, that it can be hard to know what part you’re talking about when you’re talking about it! One particular critique I’ve seen going around recently, though, is about how OpenTelemetry is just ‘three pillars’ all over again. Reader, this could not be further from the truth, and I want to spend some time on why.
One of the main pieces of advice about Service Level Objectives (SLOs) is that they should focus on the user experience. Invariably, this leads to people further down the stack asking, “But how do I make my work fit the users?”—to which the answer is to redefine what we mean by “user.” In the end, a user is anyone who uses whatever it is you’re measuring.
This blog post will get you started ingesting your Next.js application’s telemetry into Honeycomb. I’ll show you the configuration steps, how to view your traces in Honeycomb, and even how to explore your frontend React telemetry with our Frontend Observability Web Launchpad.