Honeycomb was built for the AI era. Learn how to futureproof your software for what comes next.
Discover why Honeycomb is the better choice for your engineers, your customers, and your bottom line.
Start your journey with the definitive guide to observability. Download our complimentary ebook.
Bring observability to every software engineer.
Learn about our company, mission and values.
Come for the impact, stay for the culture.
See Honeycomb's latest press releases, media, and more
Learn more about becoming a Honeycomb partner.
Already a Honeycomb customer?
Rox Williams
Honeycomb’s Jessica Kerr and Fred Hebert recently hosted a webinar with Courtney Nash of The VOID where they dug into one of the biggest questions in tech right now.
Mike Terhar
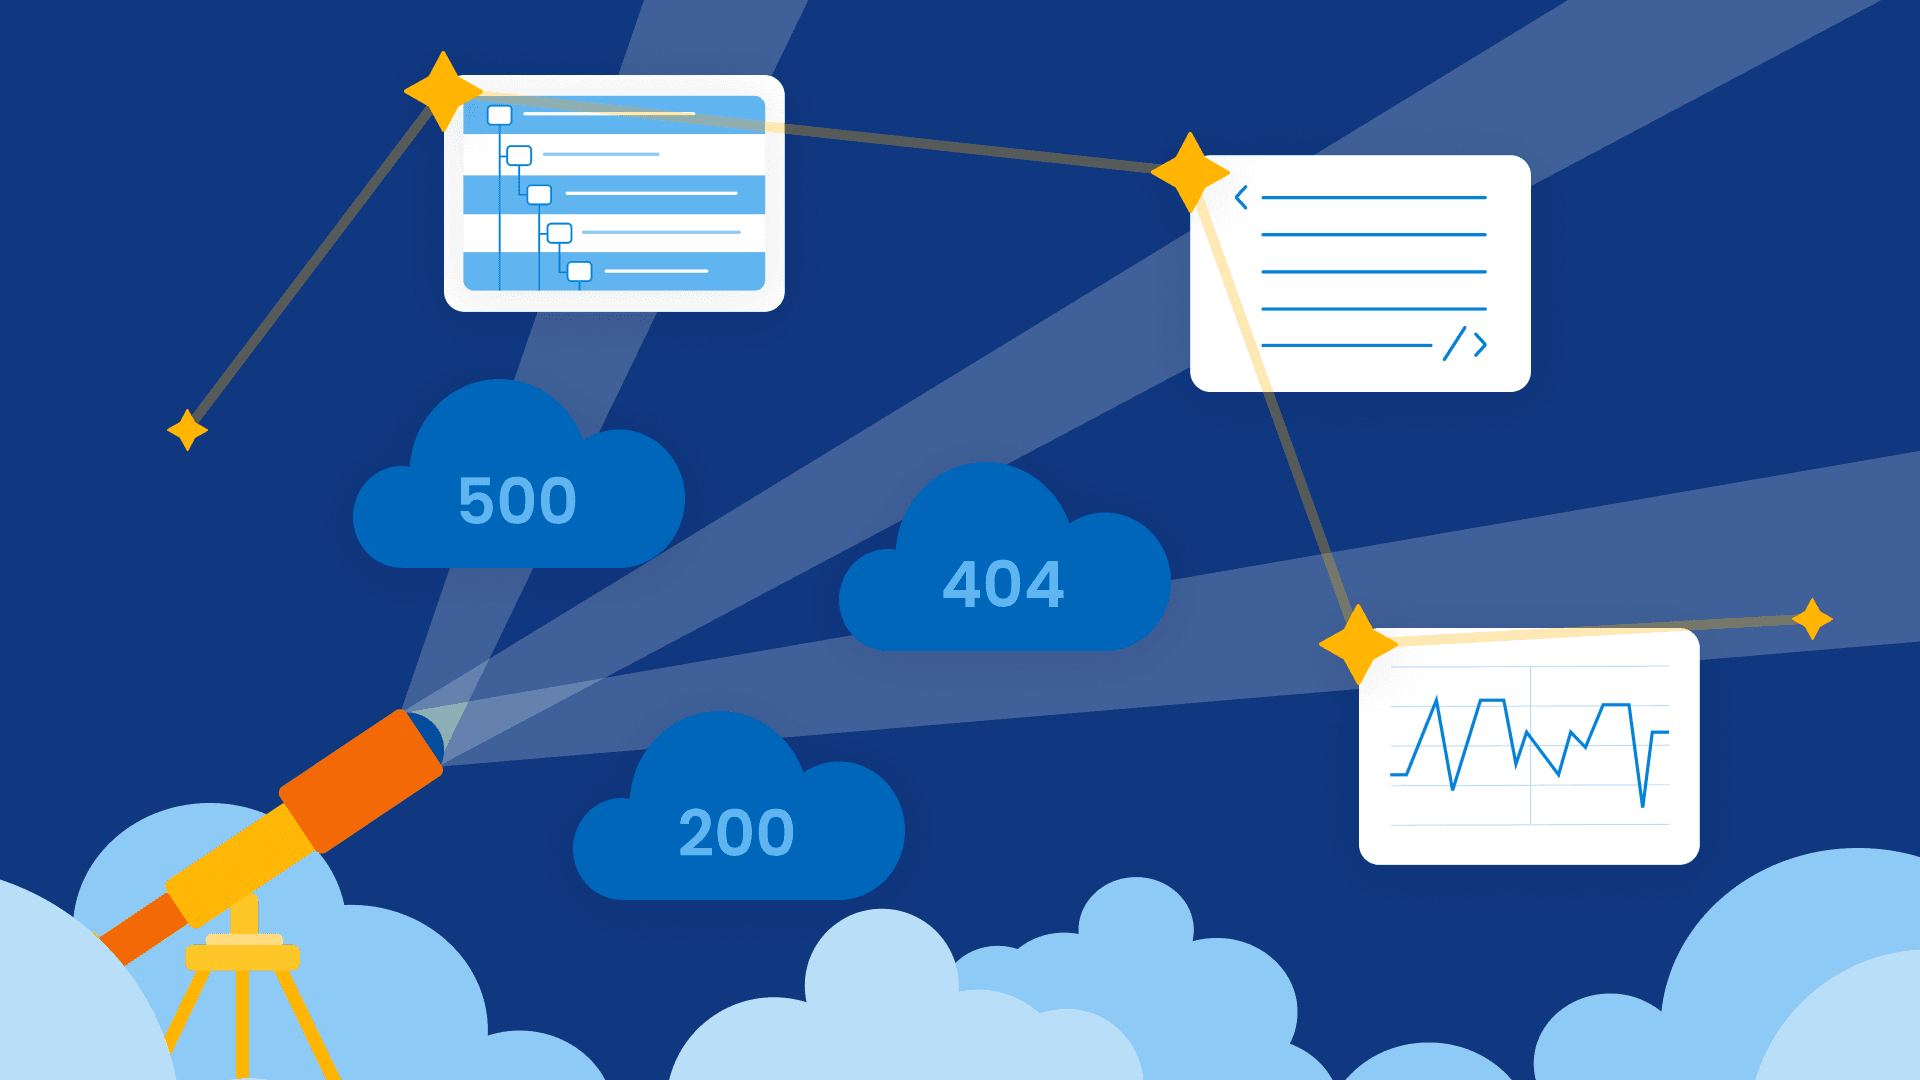
You've probably seen it: your health check endpoint returns success, but your users are staring at an error page. This is the reality of monitoring HTTP endpoints in production—status codes alone don't tell the whole story.
Ian Wilkes
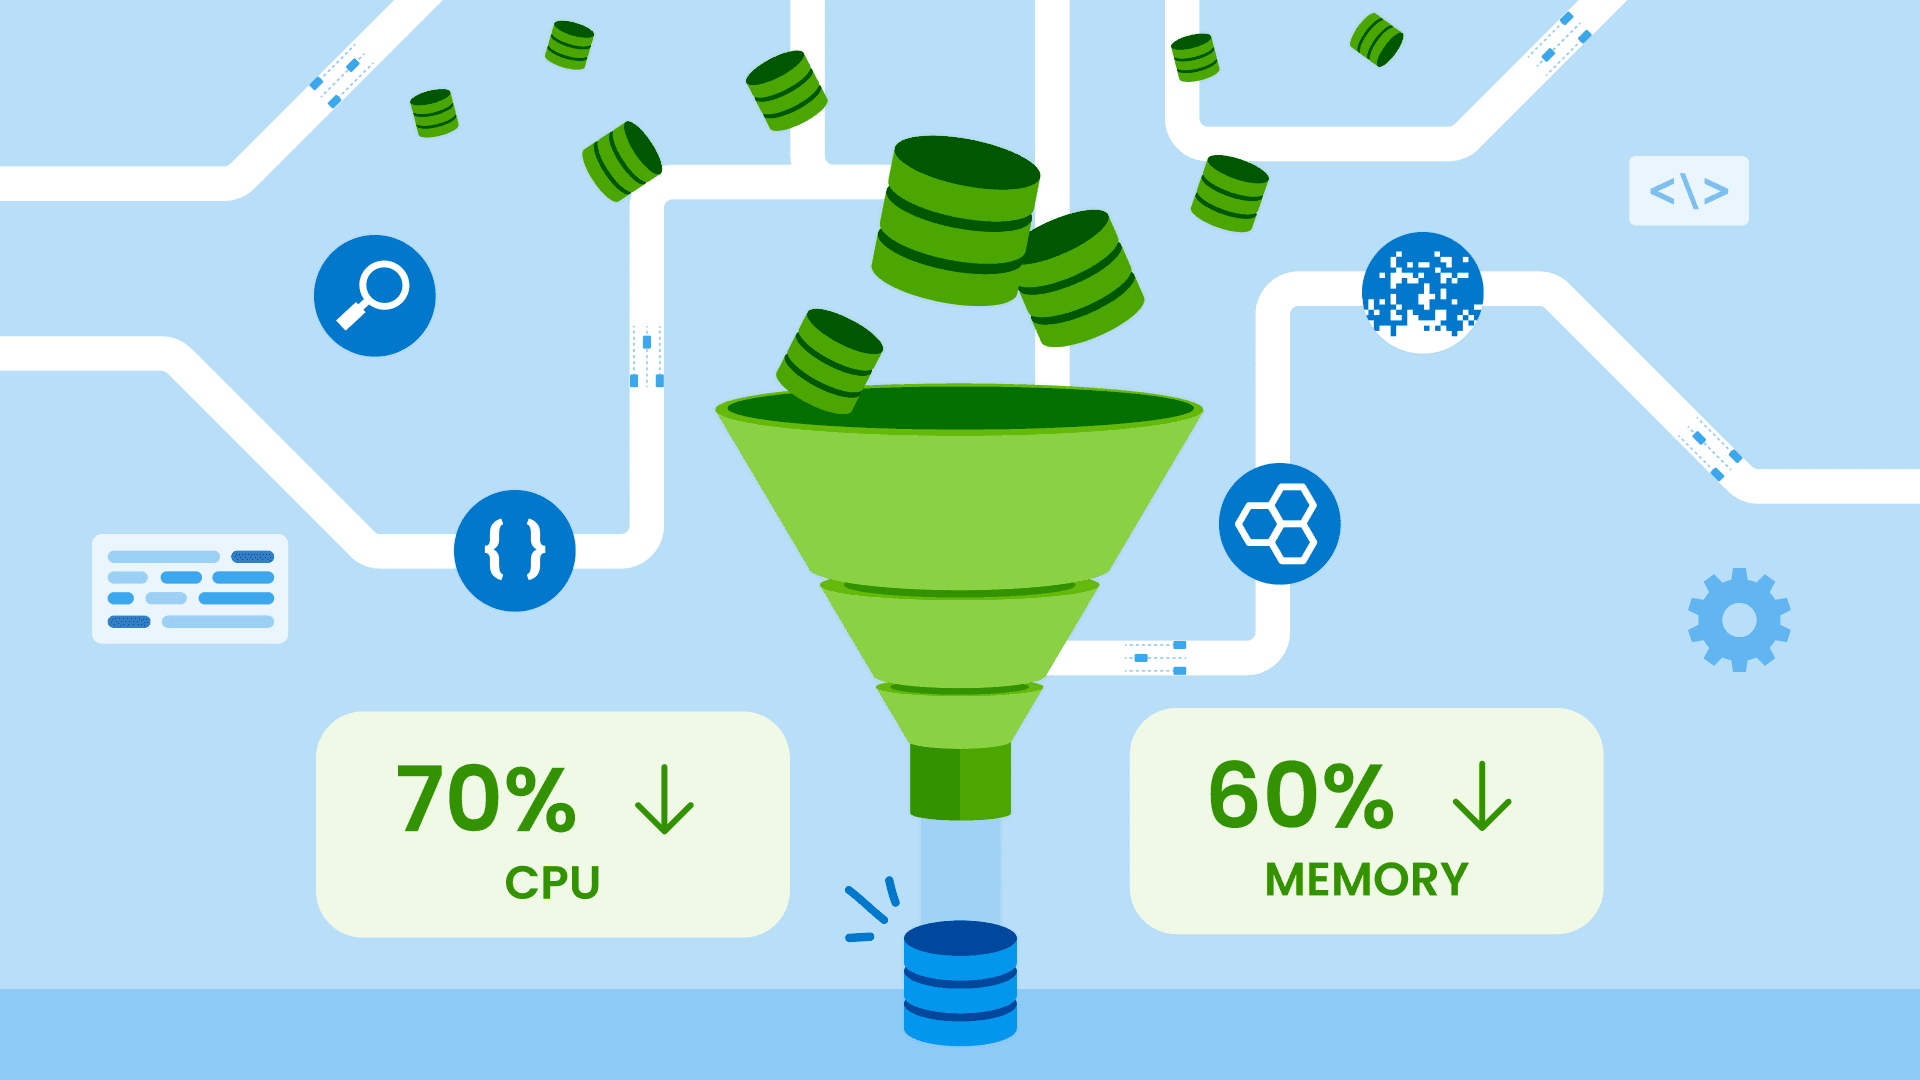
We've just released Refinery 3.0, a performance-focused update which significantly improves Refinery's CPU and memory efficiency.
Elsie Phillips
The new Honeycomb-maintained React Native SDK built on OpenTelemetry gives you the best of both worlds: modern, open standards to avoid lock-in and a more streamlined setup. Spans from your React Native app also automatically propagate for seamless end-to-end tracing.
Shabih Syed
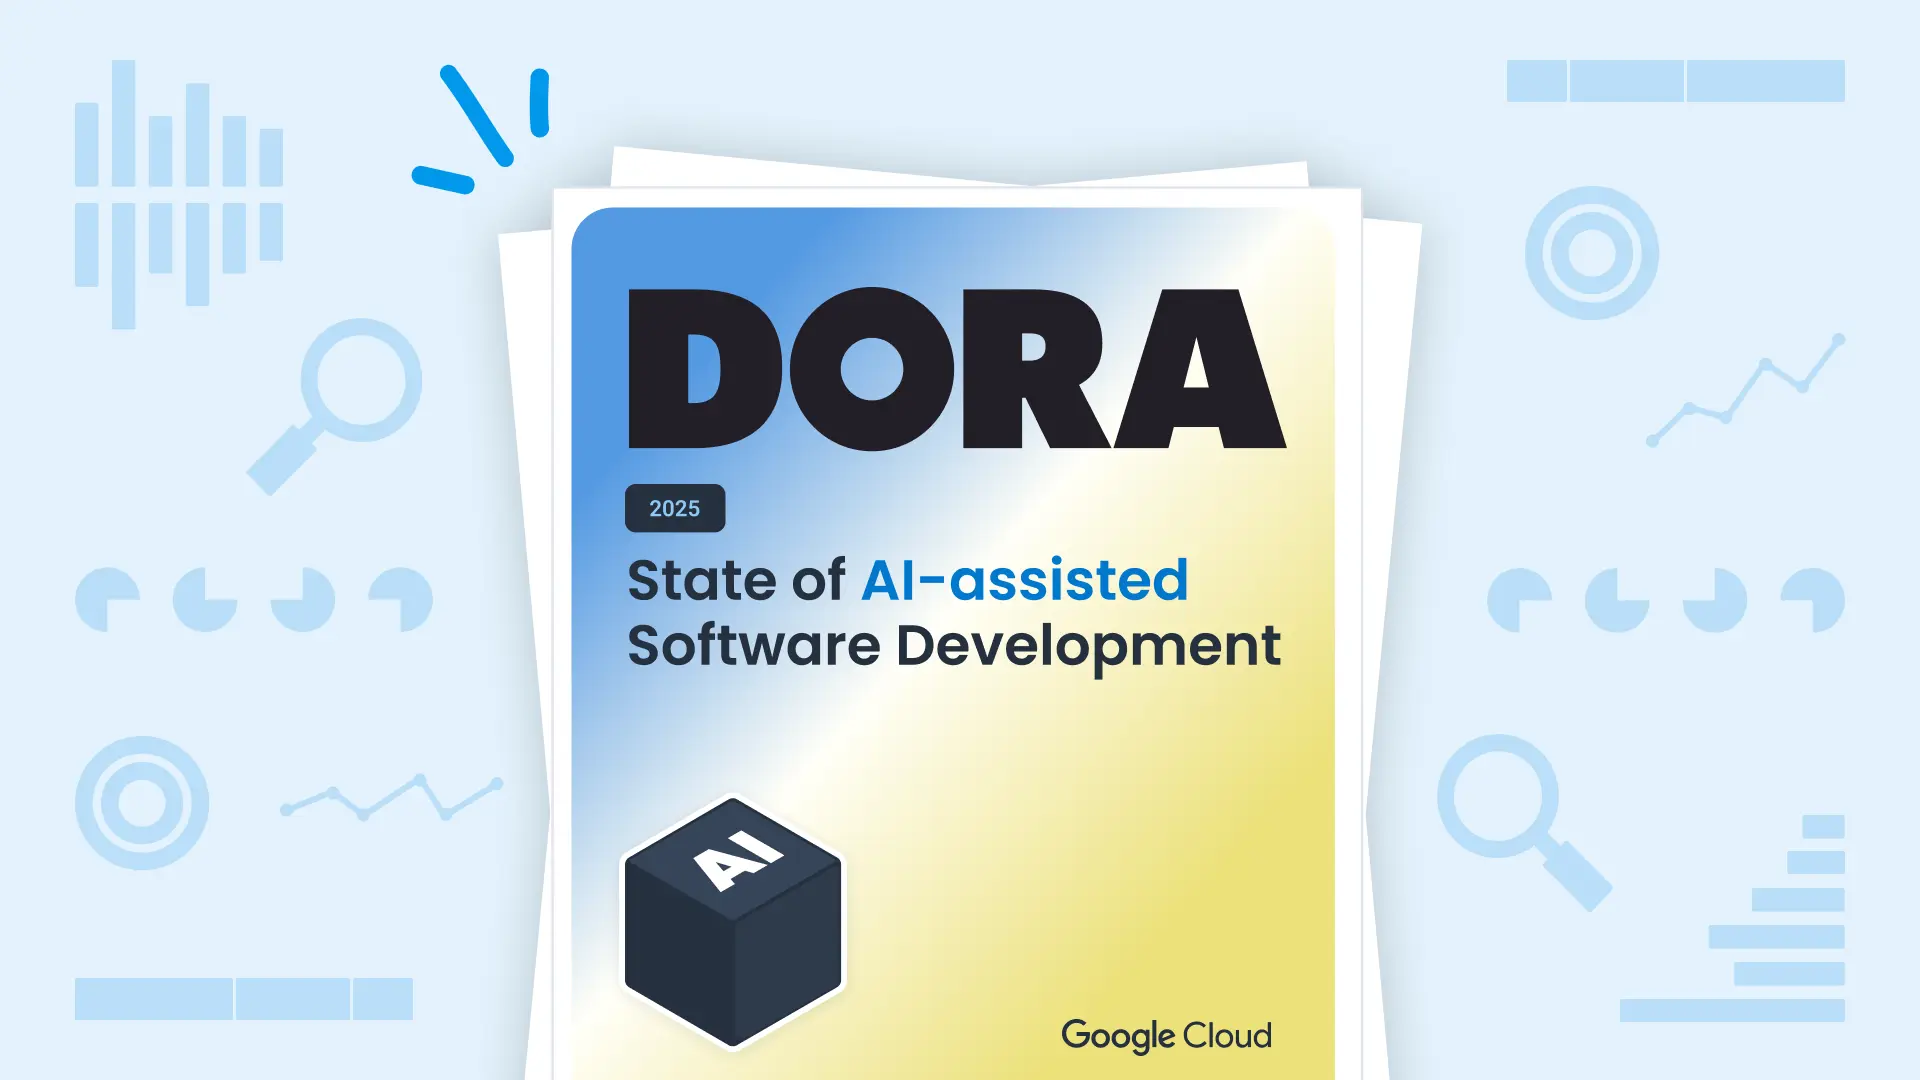
The 2025 DORA State of AI-Assisted Software Development Report delivers a critical insight for technology leaders: AI is fundamentally an amplifier, not a solution. It magnifies the strengths of high-performing organizations with robust observability while exposing the dysfunctions of struggling ones.
Tyler Helmuth
With the influx of AI tooling, it’s never been easier to contribute to open source communities. These tools are capable of gathering context quickly, “understanding” repositories faster than ever before. They provide instant summaries about repositories that, previously, would have meant reading lines and lines of code.
Alex Boten
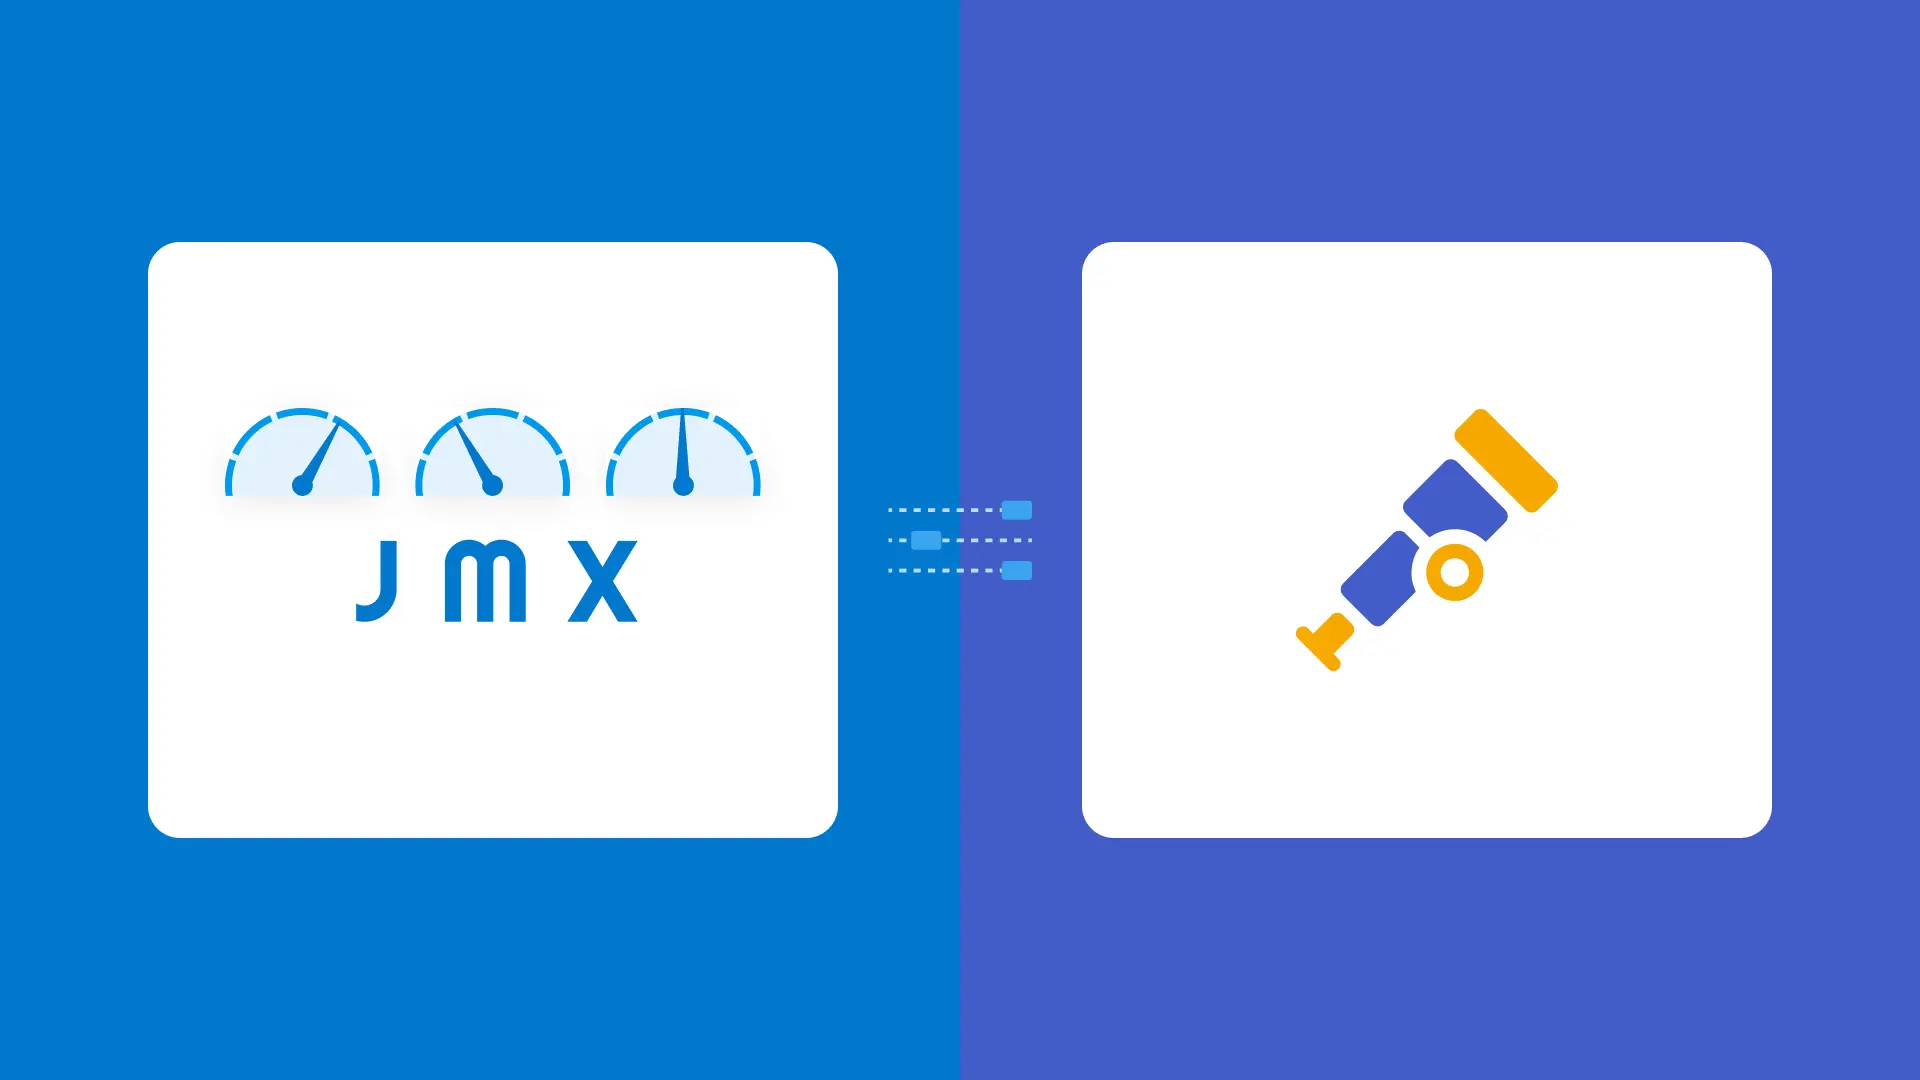
The OpenTelemetry community and the contributors to the Java Special Interest Group (SIG) have spent a great deal of time integrating core Java technologies into the project. An integration that is particularly useful is Java Management Extensions (JMX).
Ken Rimple
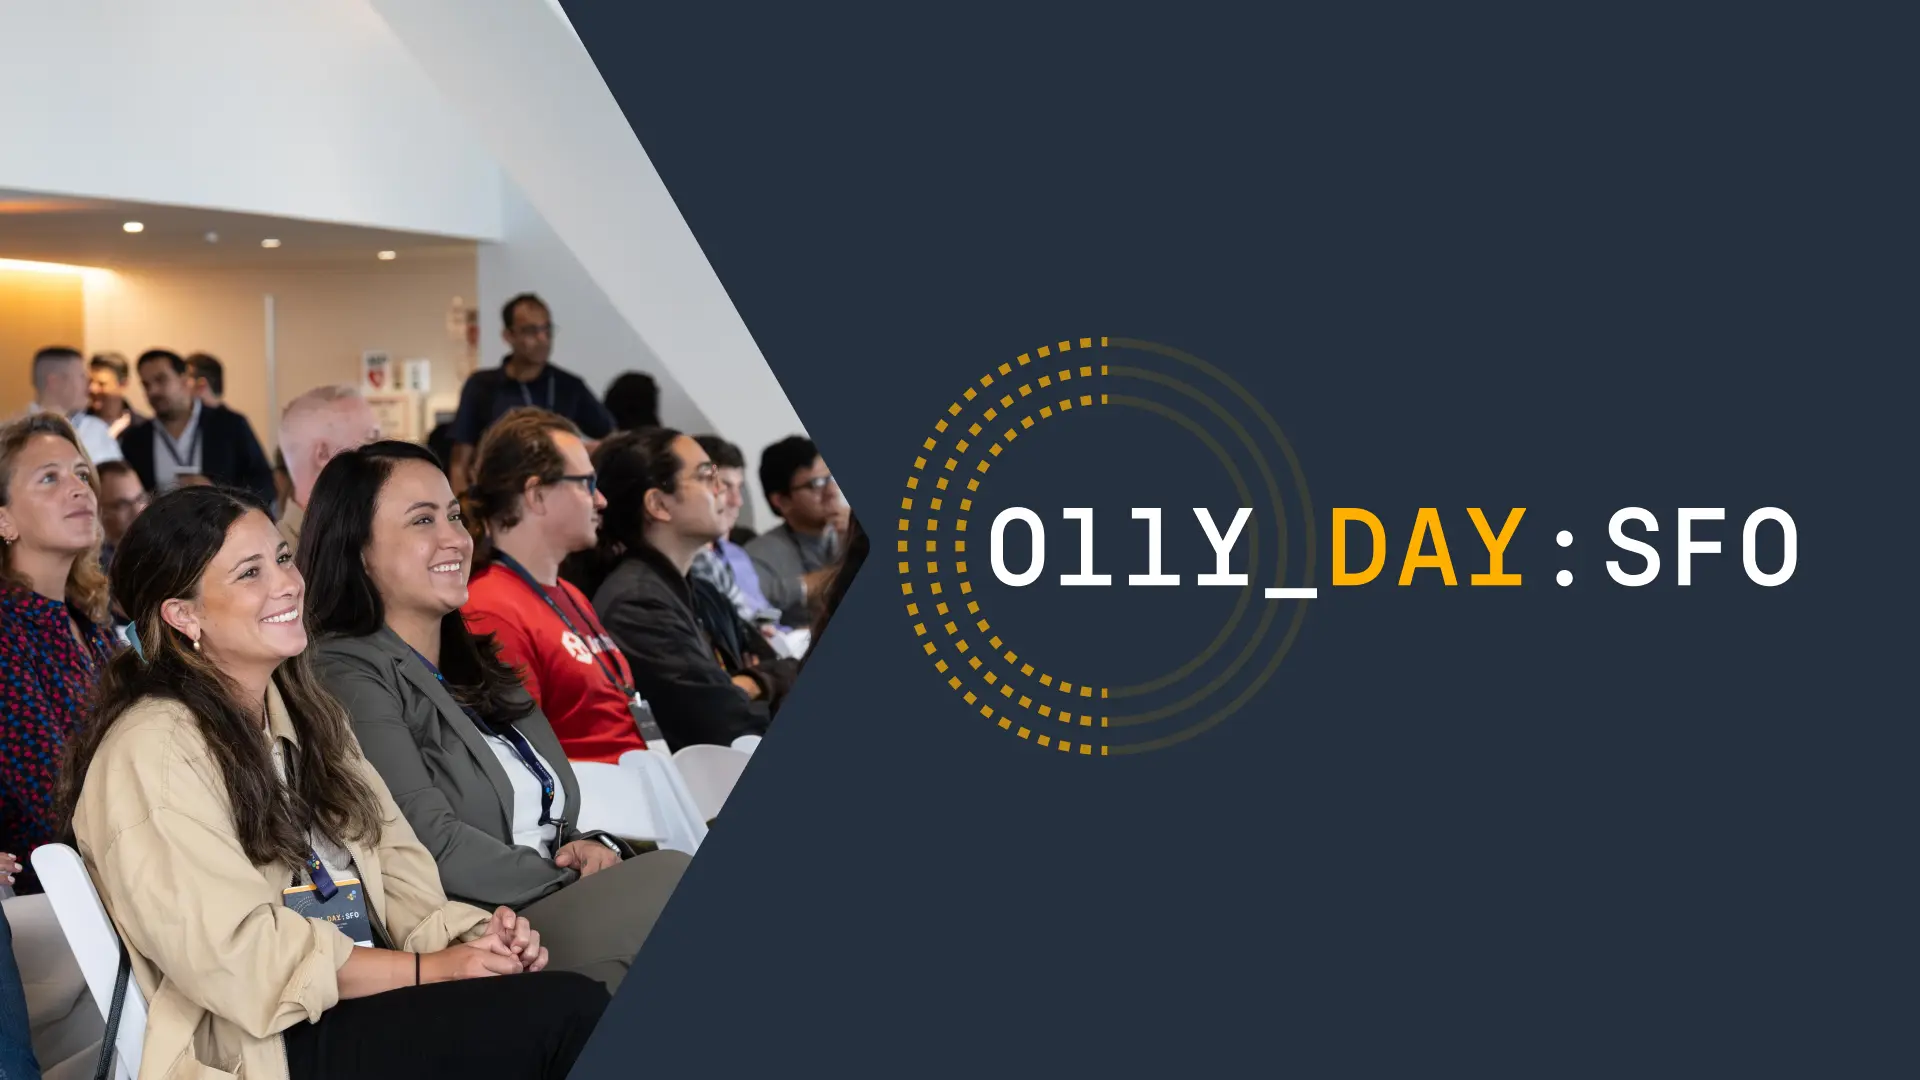
AI and observability are no longer separate conversations—they’re deeply intertwined. Across keynotes, panels, and demos, speakers at Honeycomb's Observability Day San Francisco unpacked what that means for engineering teams today: faster insights, smarter tools, and new challenges to solve.
Ileanell Perez
In April, I was given a chance that truly excited me: stepping in as the interim Director of Platform while my manager went on maternity leave. It wasn’t just a temporary assignment, to me: it was my first real taste of what it means to operate at the director level.
Morgante Pell
Canvas is an AI-guided workspace inside Honeycomb that combines an AI assistant with an interactive notebook for visualizing query results and traces. You can ask a natural language question about your data and Canvas will immediately start exploring your traces, through multiple queries and other tools, to find the right next steps.
Matt Ransford
Today, we're excited to announce the release of Anomaly Detection (currently in alpha), Honeycomb's proactive approach to understanding and acting on service health.
Austin Parker
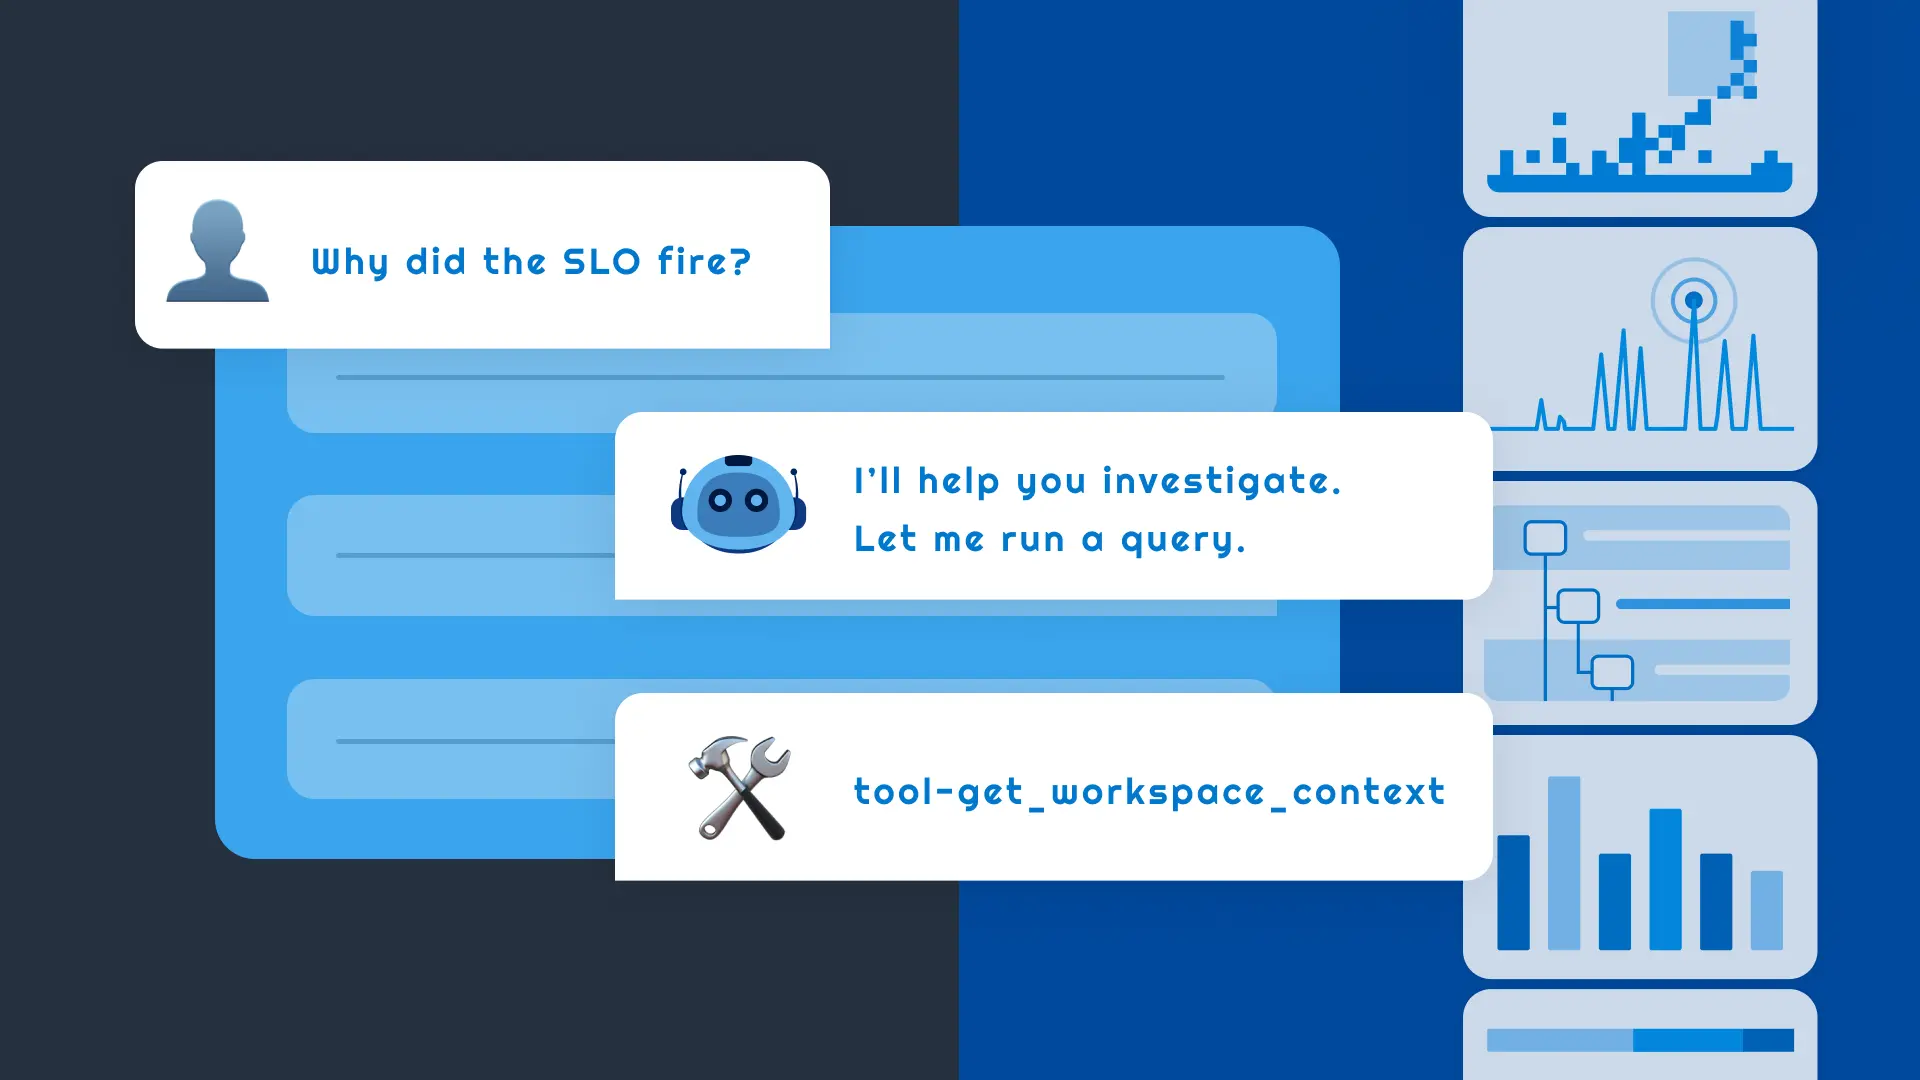
If you’ve been following my public journey with LLMs this year, it probably won’t surprise you to learn that this blog post is an announcement about the general availability of Honeycomb’s hosted MCP server. I want to share a few updates about what’s new in the GA release, discuss some interesting learnings from building it, and share examples of how we’re using MCP internally.
Get it delivered straight to your inbox.
By subscribing to our newsletter, you agree to Honeycomb’s Terms of Service and Privacy Notice.
Kat Telles
I’m a product engineer at Honeycomb. While my work spans the stack, I’m currently focused on deepening my frontend expertise. To support this, I’ve been using ChatGPT as a study assistant. It’s helped me break down complex topics with clear explanations, real-world examples, and—critically—interactive practice.
Mae Capozzi
At risk of sounding too obvious, without an observability tool, it’s extremely difficult to reason about a complicated frontend system. Especially when hundreds of engineers are shipping code every day.
Observability tools like Honeycomb are built for engineers, not PM teams… but that doesn’t mean there’s no benefit to having your PMs in Honeycomb. Whether it’s debugging a weird customer issue or tracking how a feature is used in the wild, observability gives PMs something traditional product tools can’t: real-time answers with full context, down to a single user.
New Relic is a well-known application performance monitoring (APM) solution that helps engineers visualize, monitor, and troubleshoot their systems. As businesses evolve, engineers must deliver new capabilities at greater scale and speed, often while managing an increasing number of services and systems. This naturally raises the question: what tools can help?
We’re proud to announce an integration suite to help you monitor and understand your Claude usage and costs not just in Honeycomb, but in any observability tool that supports OpenTelemetry.
Jason Harley
We're thrilled to announce that Honeycomb Tags are now generally available across SLOs, triggers, and boards! Over 100 customers are already actively tagging their observability resources in Honeycomb today.
Traditional error tracking surfaces what broke. Honeycomb shows you why, and how to fix it. With Error Analysis in Honeycomb for Frontend Observability, now in public beta, teams get a streamlined way to investigate and prioritize client-side errors without writing a single query.
Charity Majors
Every day I seem to run into yet another post with someone solemnly opining that “writing code has never been the hardest part of software engineering.