Honeycomb was built for the AI era. Learn how to futureproof your software for what comes next.
Discover why Honeycomb is the better choice for your engineers, your customers, and your bottom line.
Start your journey with the definitive guide to observability. Download our complimentary ebook.
Bring observability to every software engineer.
Learn about our company, mission and values.
Come for the impact, stay for the culture.
See Honeycomb's latest press releases, media, and more
Learn more about becoming a Honeycomb partner.
Already a Honeycomb customer?
Dan Juengst
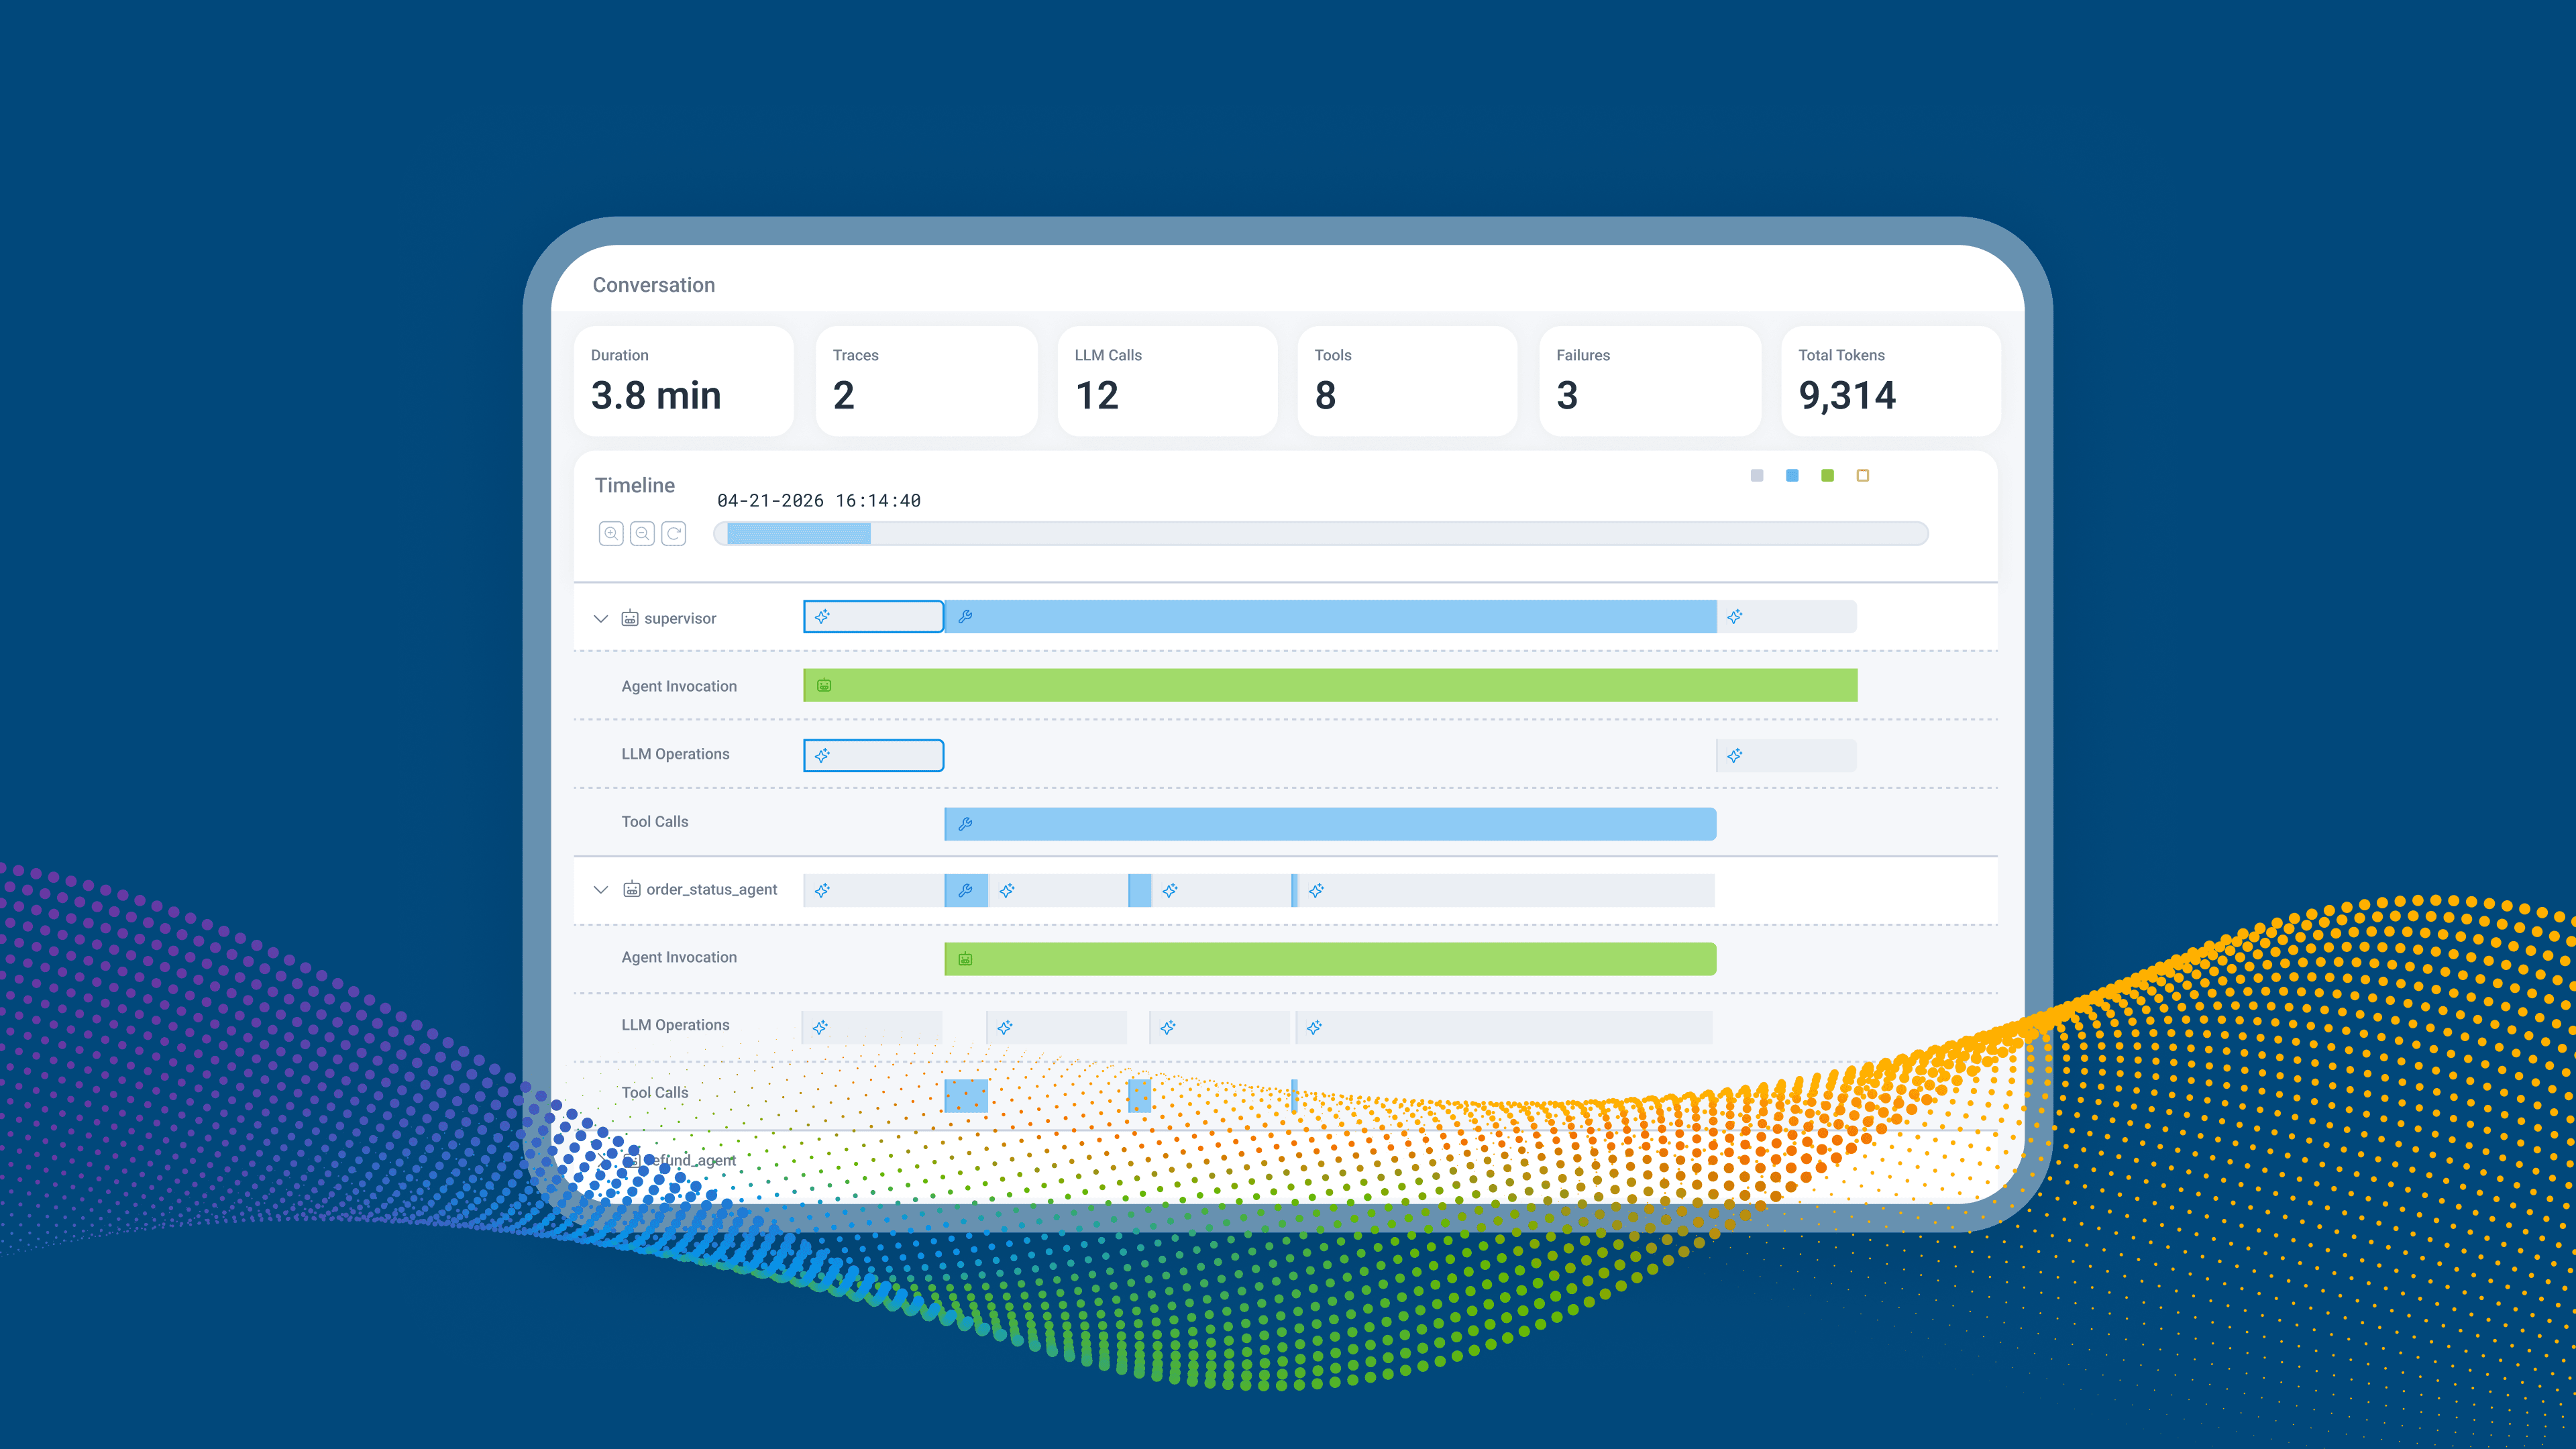
The LLM is rarely the root cause of agent failures. This technical guide shows how to instrument AI agents using OpenTelemetry's GenAI semantic conventions so they appear in Honeycomb's Agent Timeline—including tool calls, multi-agent handoffs, and framework-specific SDKs—so you can debug what actually went wrong.
Jessica Kerr (Jessitron)
The OpenTelemetry Collector is usually deployed as a long-running process, but when telemetry is rare, it makes sense to run it as a Lambda function instead. Here's how to do it.
Rox Williams
Evaluating Dynatrace alternatives? Compare top observability platforms, including Honeycomb, Datadog, New Relic, Grafana, and more on features, pricing, and complexity to find the best fit for your team.
Mike Goldsmith
In this post, I'll show how OpenTelemetry Weaver lets you define, layer, and validate semantic convention schemas so that both humans and agents have full context on every attribute in your telemetry.
When you want to add some information to your tracing telemetry, you could emit a log, create a span, or add a piece of data to your current span. Adding a piece of data to your current span is the best! Usually.
Exploring Grafana alternatives? Compare top observability platforms, including Honeycomb, Datadog, Dynatrace, and more, on features, pricing, and ease of use to find the right fit for your team.
Do you receive 50 million log lines per day and struggle to see what actually matters? Health checks, heartbeat pings, connection pool messages—they all drown out the errors and anomalies you're trying to find. What if the Collector could figure out the patterns for you?
This is what a semantic convention migration looks like in practice: not a clean cutover, but months of coexistence where old and new attribute names overlap. In this post, I'll explain why this happens, how the OpenTelemetry Collector's schema processor is designed to automate migrations in both directions, and what we're actively working on to get it into a state where everyone can use it.
Ken Rimple
Observability is the visibility you need to get the job done. Sending telemetry to Honeycomb explains what your agents are actually doing. OpenTelemetry provides semantic conventions for generative AI systems, a spec that defines how agents, LLMs, MCPs, and tools are properly observed. The primary telemetry is defined as trace spans and other events with specific naming patterns, mostly starting with gen_ai.
Alex Boten
The performance impact of instrumentation on running applications should be minimized wherever possible, and this is what led to the investigation described in this article.
Fahim Zaman
The nature of software development has changed as AI-code generation and agent-based features gain adoption. In perhaps a more subtle shift, the fundamentals of software instrumentation are changing too.
Tyler Helmuth
In this post, I’ll explain what OpAMP is and why OpenTelemetry created it, then dive into how we use it to power Honeycomb Telemetry Pipeline.
Jessica Parsons
Today, we’re introducing the latest enhancements to Honeycomb Telemetry Pipeline, which give teams deeper visibility into pipeline health, more efficient access to archived telemetry data, and reduced operational complexity.
Mike Terhar
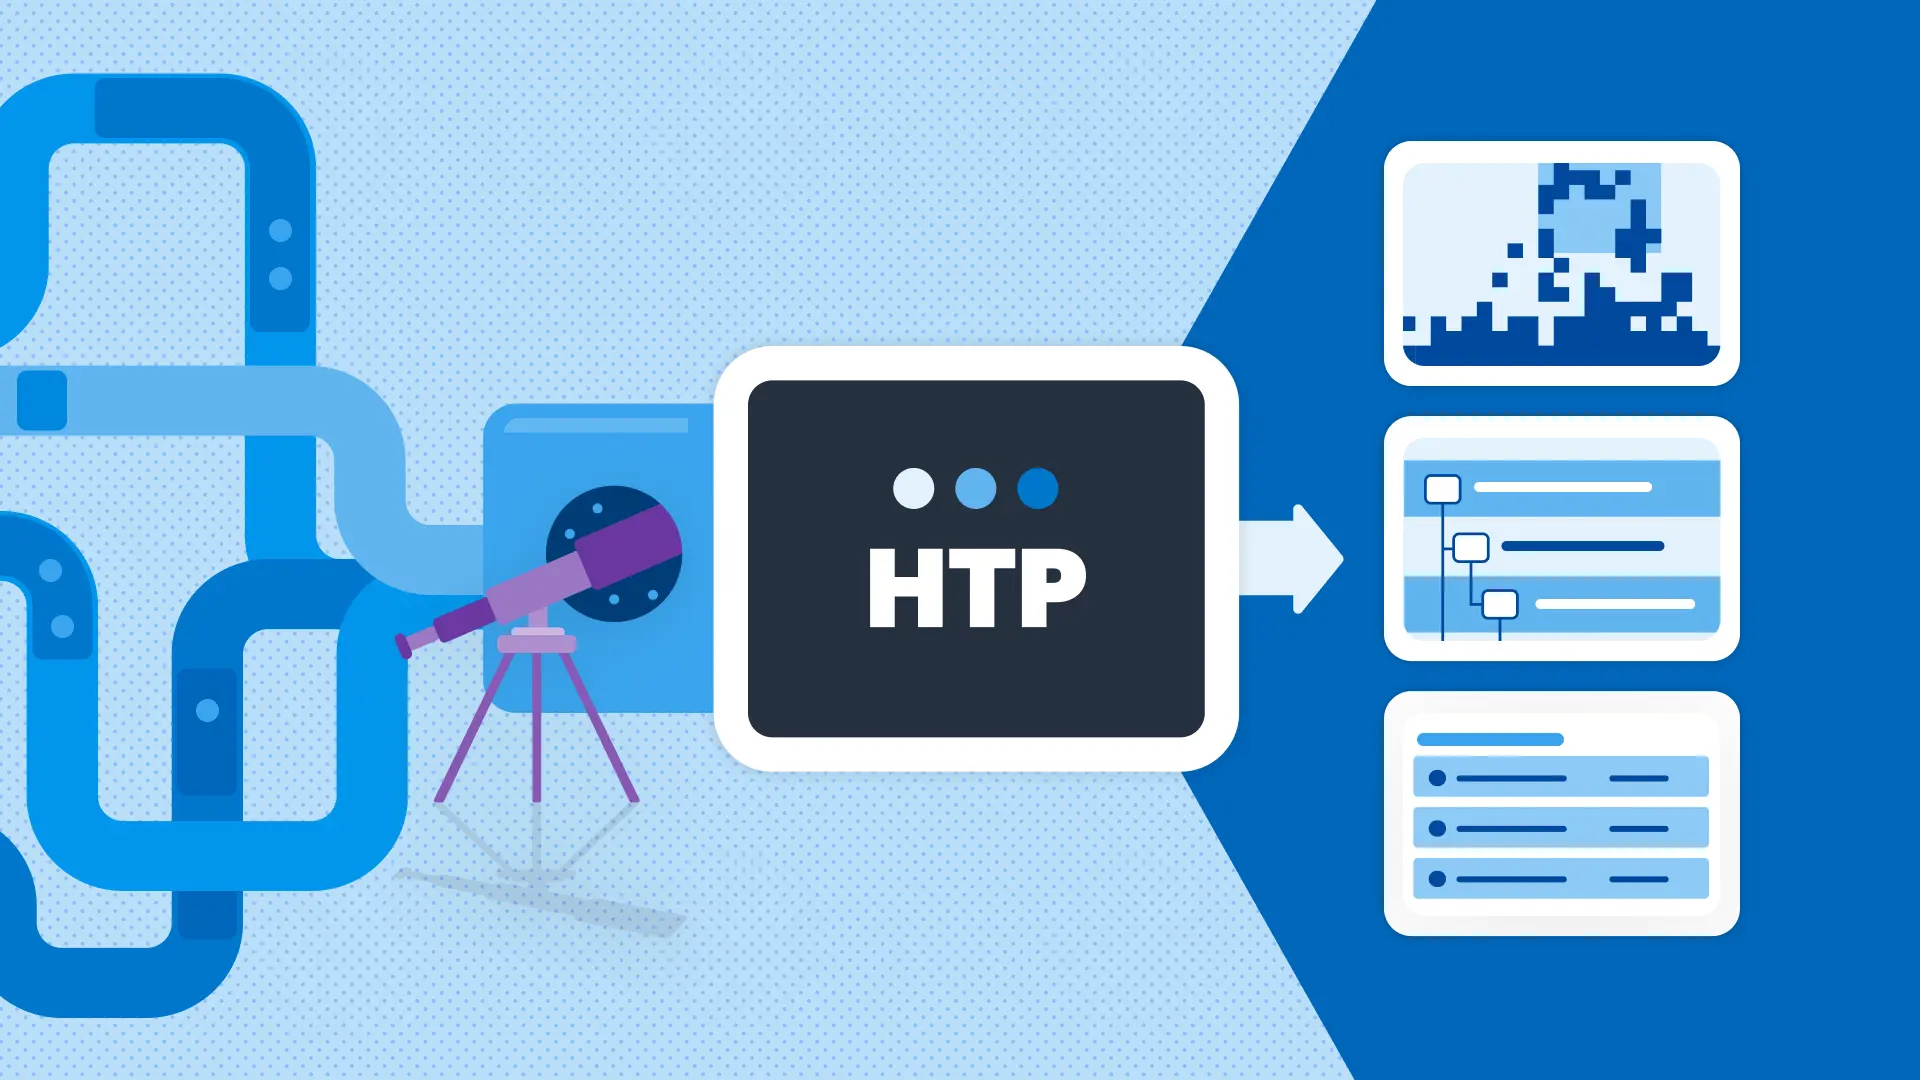
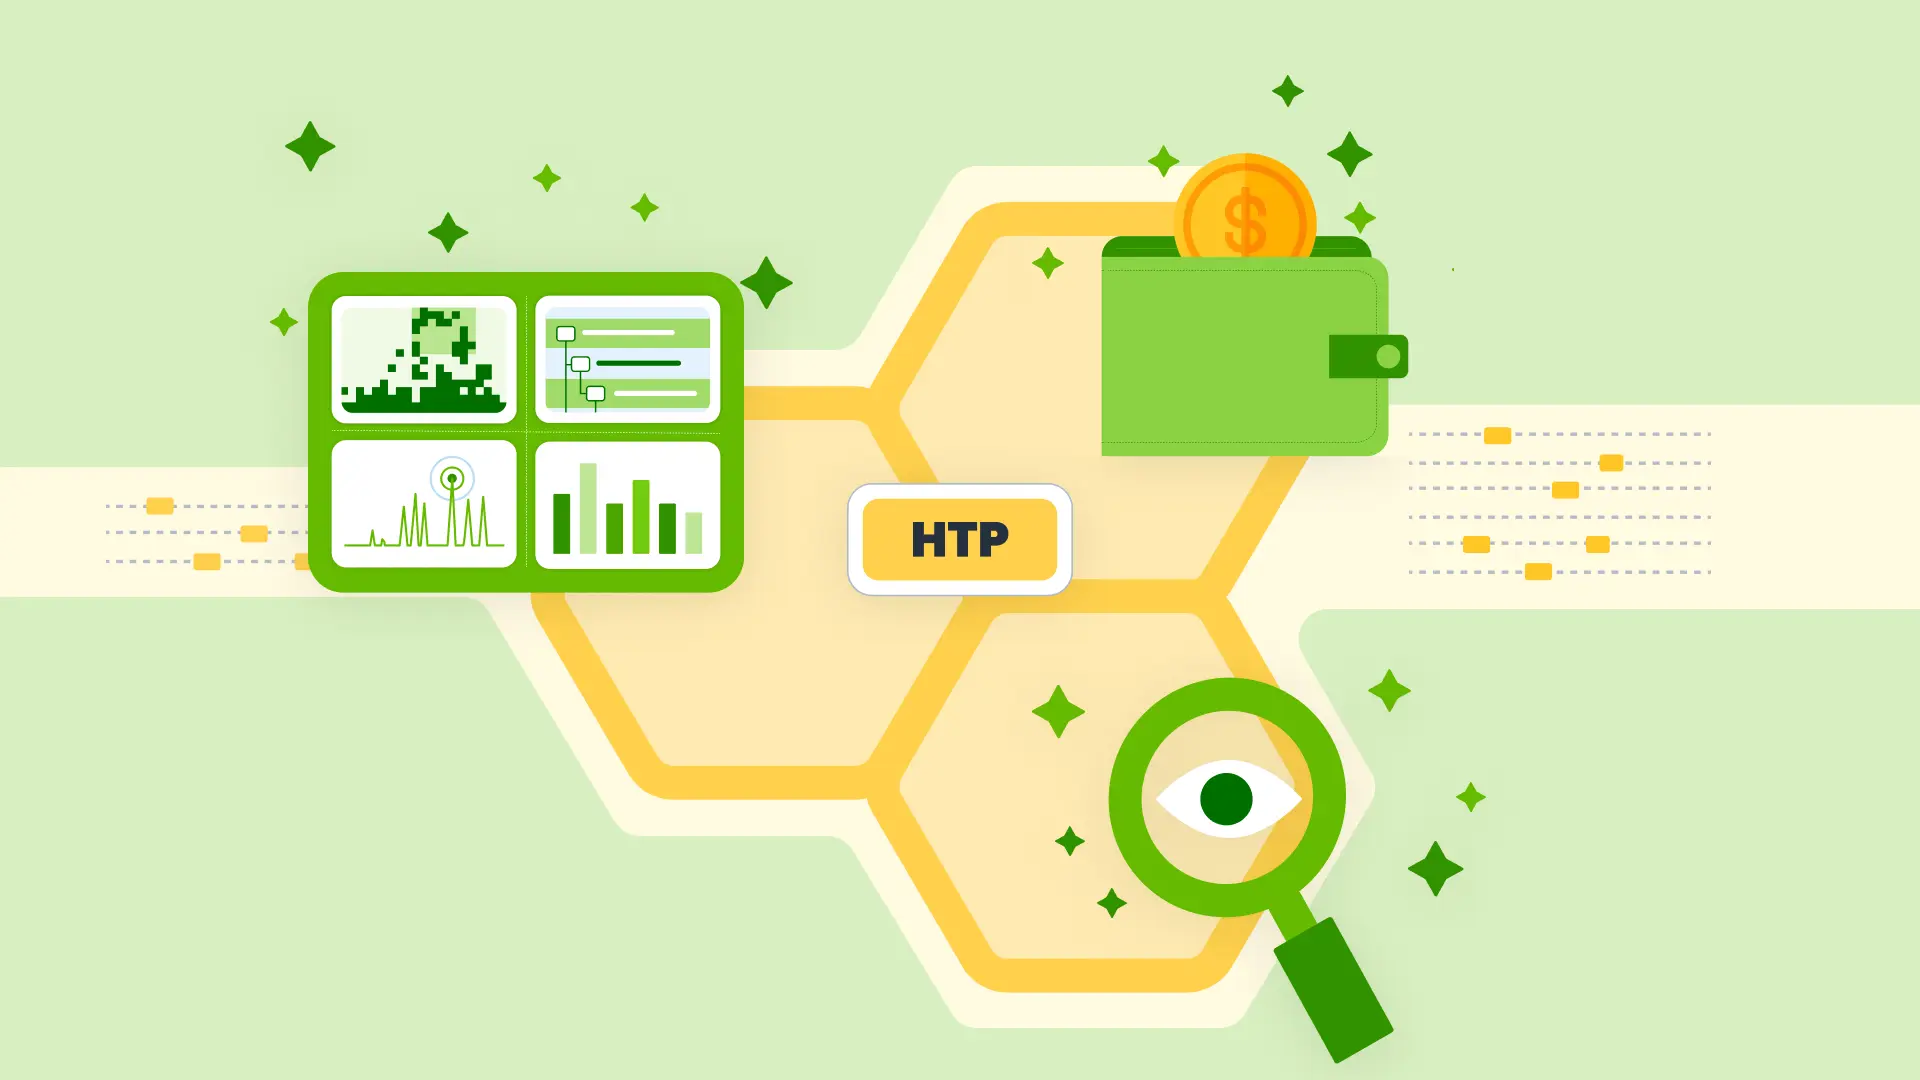
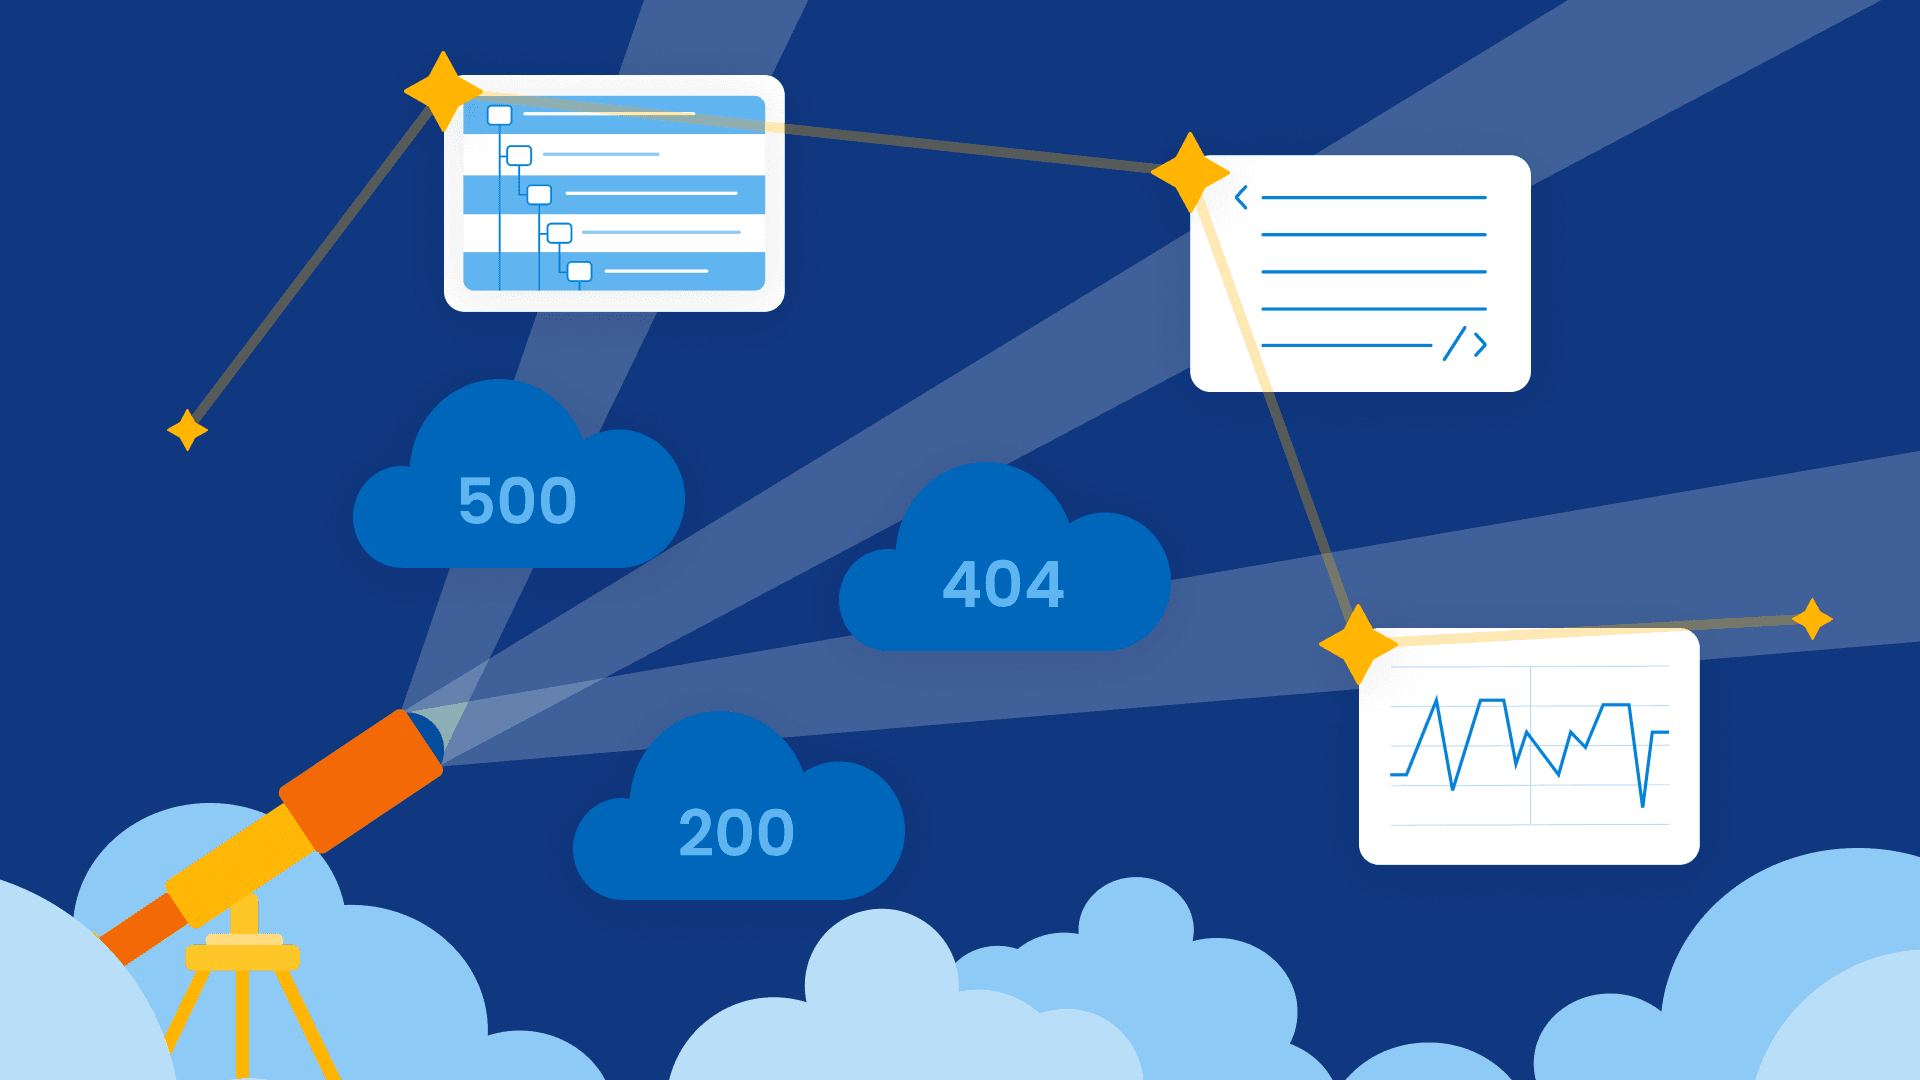
You've probably seen it: your health check endpoint returns success, but your users are staring at an error page. This is the reality of monitoring HTTP endpoints in production—status codes alone don't tell the whole story.
The OpenTelemetry community and the contributors to the Java Special Interest Group (SIG) have spent a great deal of time integrating core Java technologies into the project. An integration that is particularly useful is Java Management Extensions (JMX).
Austin Parker
We’re proud to announce an integration suite to help you monitor and understand your Claude usage and costs not just in Honeycomb, but in any observability tool that supports OpenTelemetry.
OpenTracing was created to solve this problem by providing a vendor-neutral implementation to instrument code for distributed tracing. Over time, the community recognized the need for a broader, unified standard that went beyond tracing to also include metrics and logs.
Bernardo Guerreiro
One of the great things about OpenTelemetry is that it’s a standard, and standards tend to proliferate. I was excited to see Claude Code add OpenTelemetry metric and log support in a recent release.
Elsie Phillips