Honeycomb was built for the AI era. Learn how to futureproof your software for what comes next.
Discover why Honeycomb is the better choice for your engineers, your customers, and your bottom line.
Start your journey with the definitive guide to observability. Download our complimentary ebook.
Bring observability to every software engineer.
Learn about our company, mission and values.
Come for the impact, stay for the culture.
See Honeycomb's latest press releases, media, and more
Learn more about becoming a Honeycomb partner.
Already a Honeycomb customer?
George Miranda
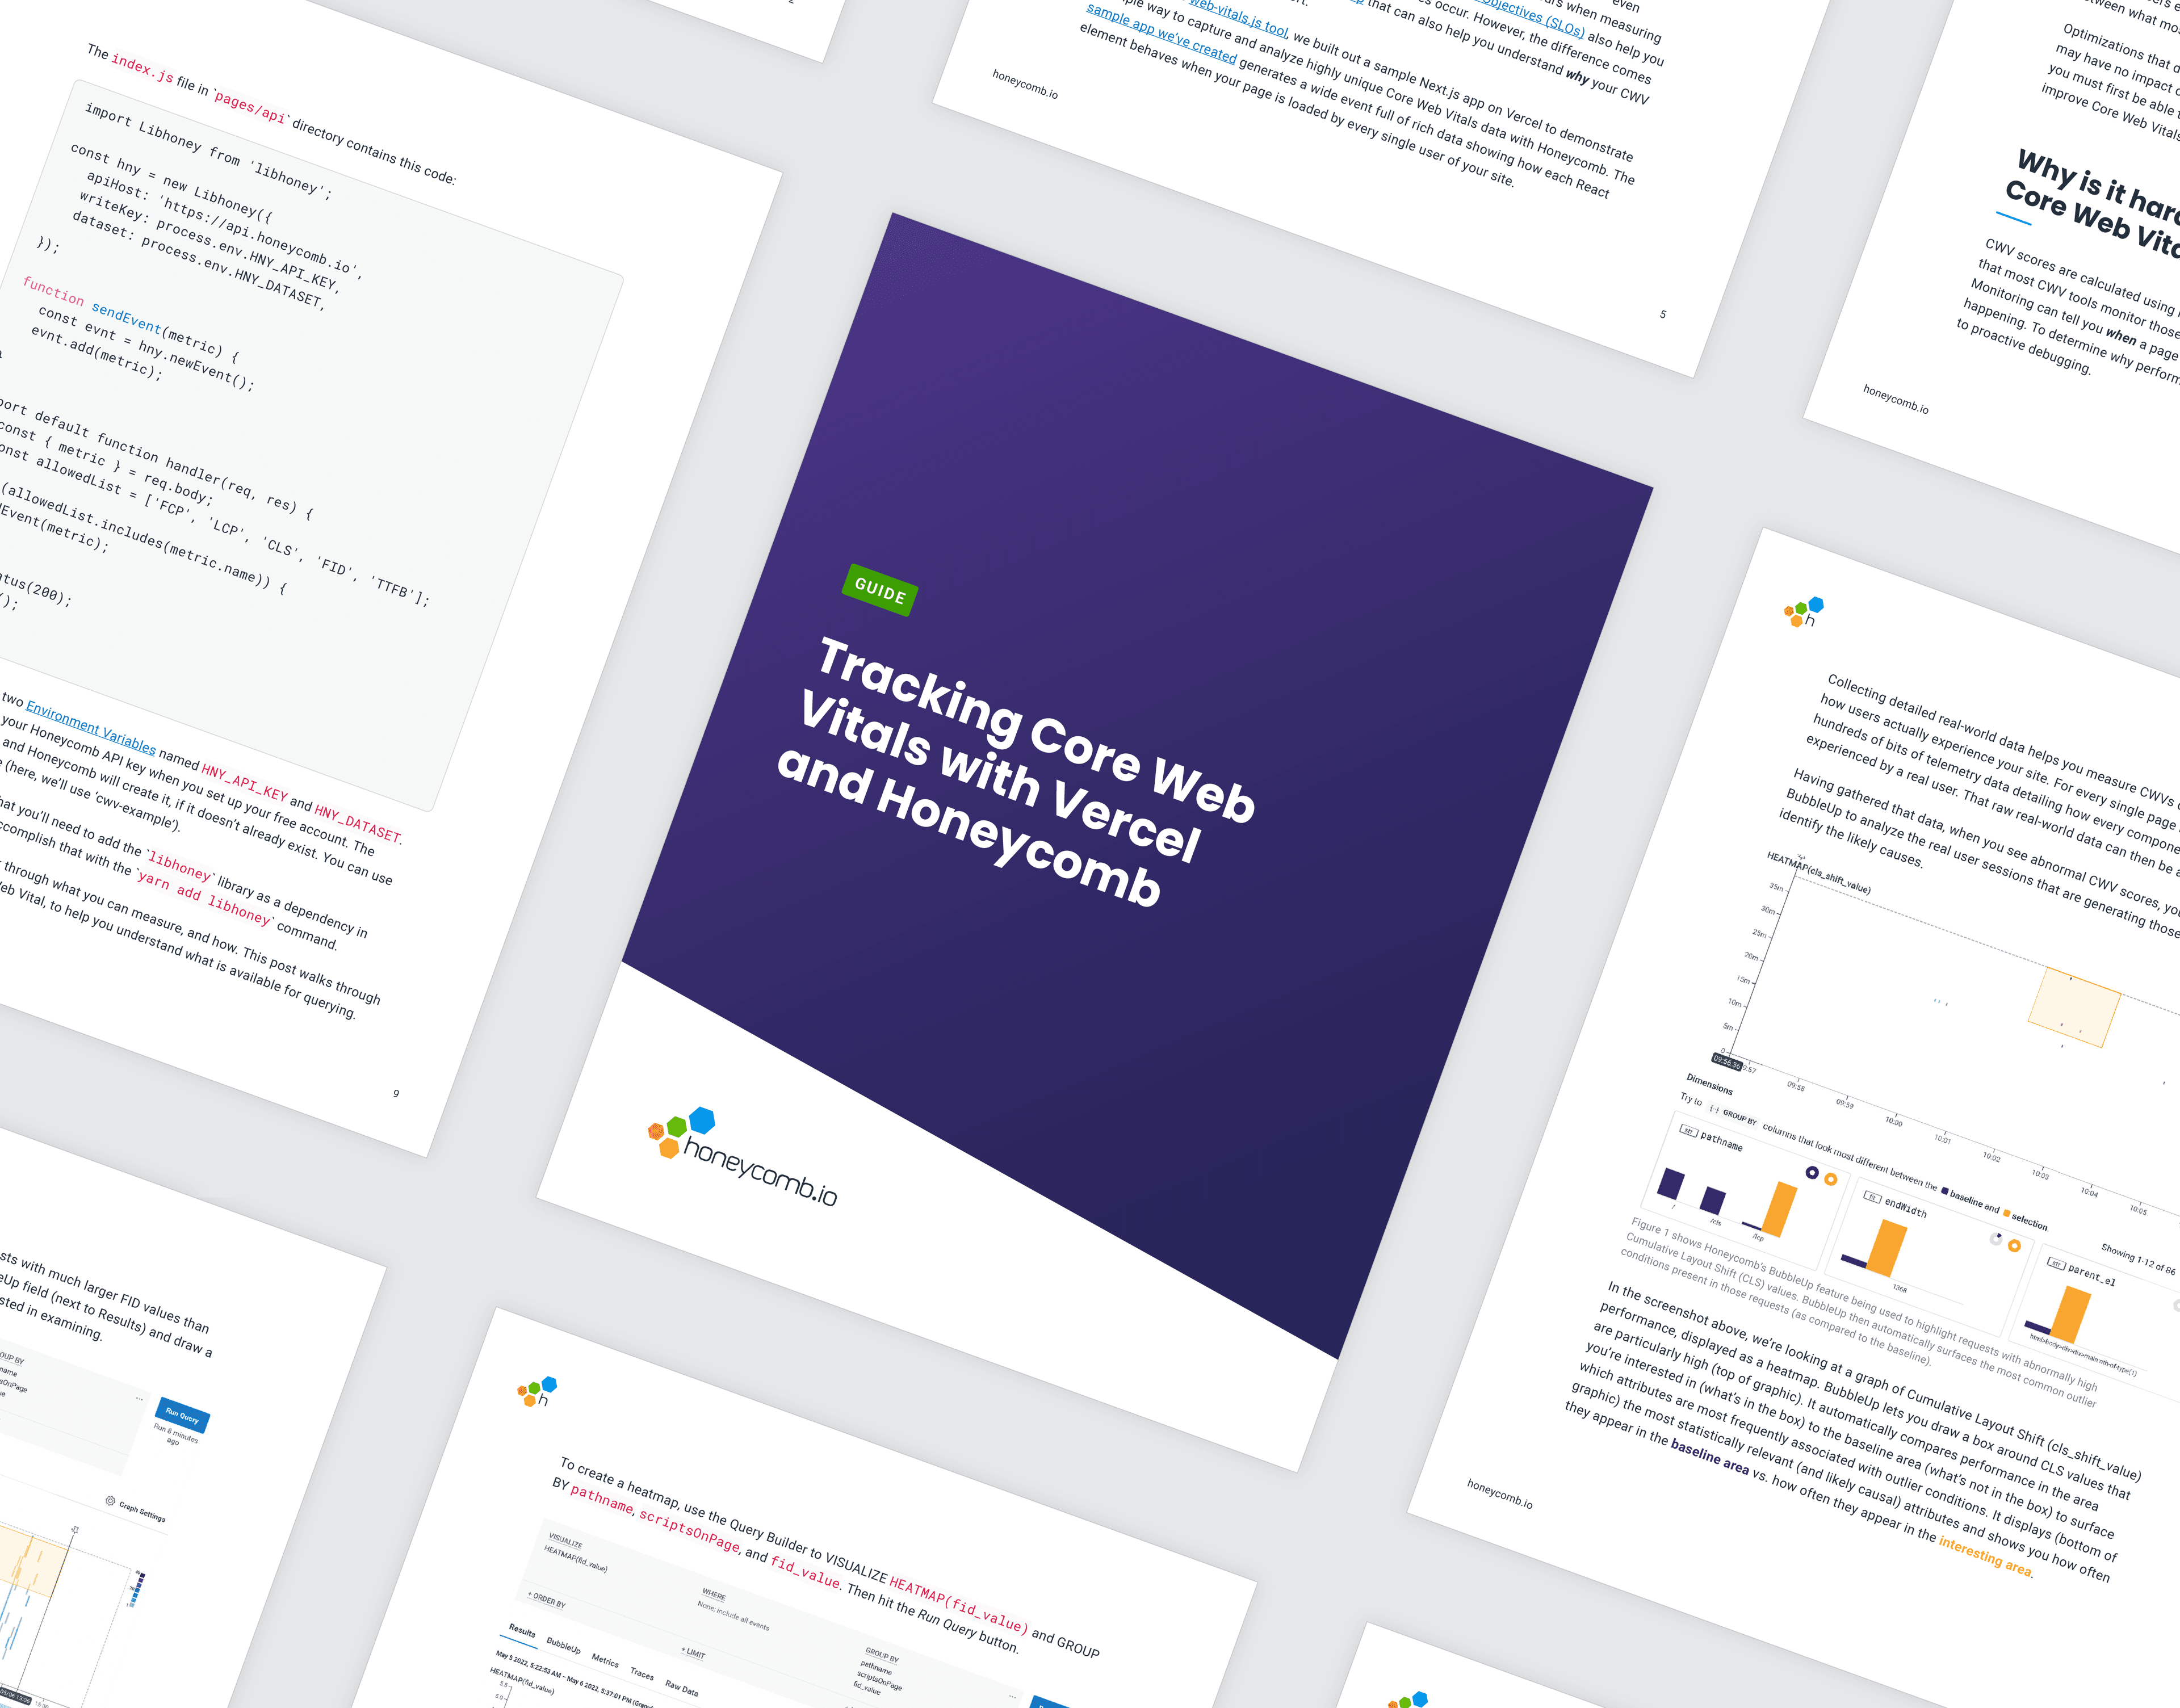
Google’s Core Web Vitals (CWV) are used to rank the performance of mobile sites or pages. It’s easy to see when your CWV scores are low, but it’s not always clear exactly why that’s happening. In Honeycomb’s new guide, Tracking Core Web Vitals with Honeycomb and Vercel, you can learn how to capture, analyze, and debug your real-world CWV performance using a free Honeycomb account.
Honeycomb
We’ve wondered, in the past, what new engineers think about how we do things at Honeycomb. This time, we asked! Meet Elliott and Reid, two of our engineers that recently hit their 90 day mark. Along with the title question, we also asked about their prior companies, how we differ, and what surprised them most about working here.
Martin Thwaites
One of the reasons that OpenTelemetry is great at doing this is that a lot of the common attributes you may find on a span are given standard names, so the systems receiving the data to visualize them don’t need to know the specifics of your system. This is really a superpower of OpenTelemetry, as it gives a level playing field for consumers of that information—meaning that you, as a developer, can forget about vendor-specific things.
Charity Majors
If you get CI/CD right, a lot of other critical functions, behaviors, and intuitions align to be comfortably successful and correct with minimal effort. If you get it wrong, you will spend countless cycles chasing pathologies. It’s like choosing to eat your vegetables every day vs choosing a diet of cake and soda for fifty years, then playing whack-a-mole with all the symptoms manifesting on your poor, moldering body.
In the same way as the business is likely ok with you writing developer-based tests (unit, automation, integration), instrumentation is the same. The conversation we need to have is that instrumentation, or knowing the system is healthy, is the work we need to do for the feature. In my opinion, it’s even more important than those.
Guest Blogger
At Intercom, we focus on customer experience above all—our service’s availability and performance is our top priority. That requires a strong culture of observability across our teams and systems. As a result, we invest a lot in the reliability of our application. But unpredictable failures are inevitable, and when they happen it’s humans that fix them.
In this blog, we’ll dive into debugging with the Core Analysis Loop, the functional requirements for a backend datastore that make this possible, and whether it makes sense to build or buy your own observability solution.
David Marchante
By giving an overview into datasets, traces, and spans, you’ll get a peek behind the curtain into how Honeycomb facilitates observability in the hopes of arriving at a place where identifying the source of errors, finding performance problems, or understanding how data flows through a large system is made easier.
Brian Langbecker
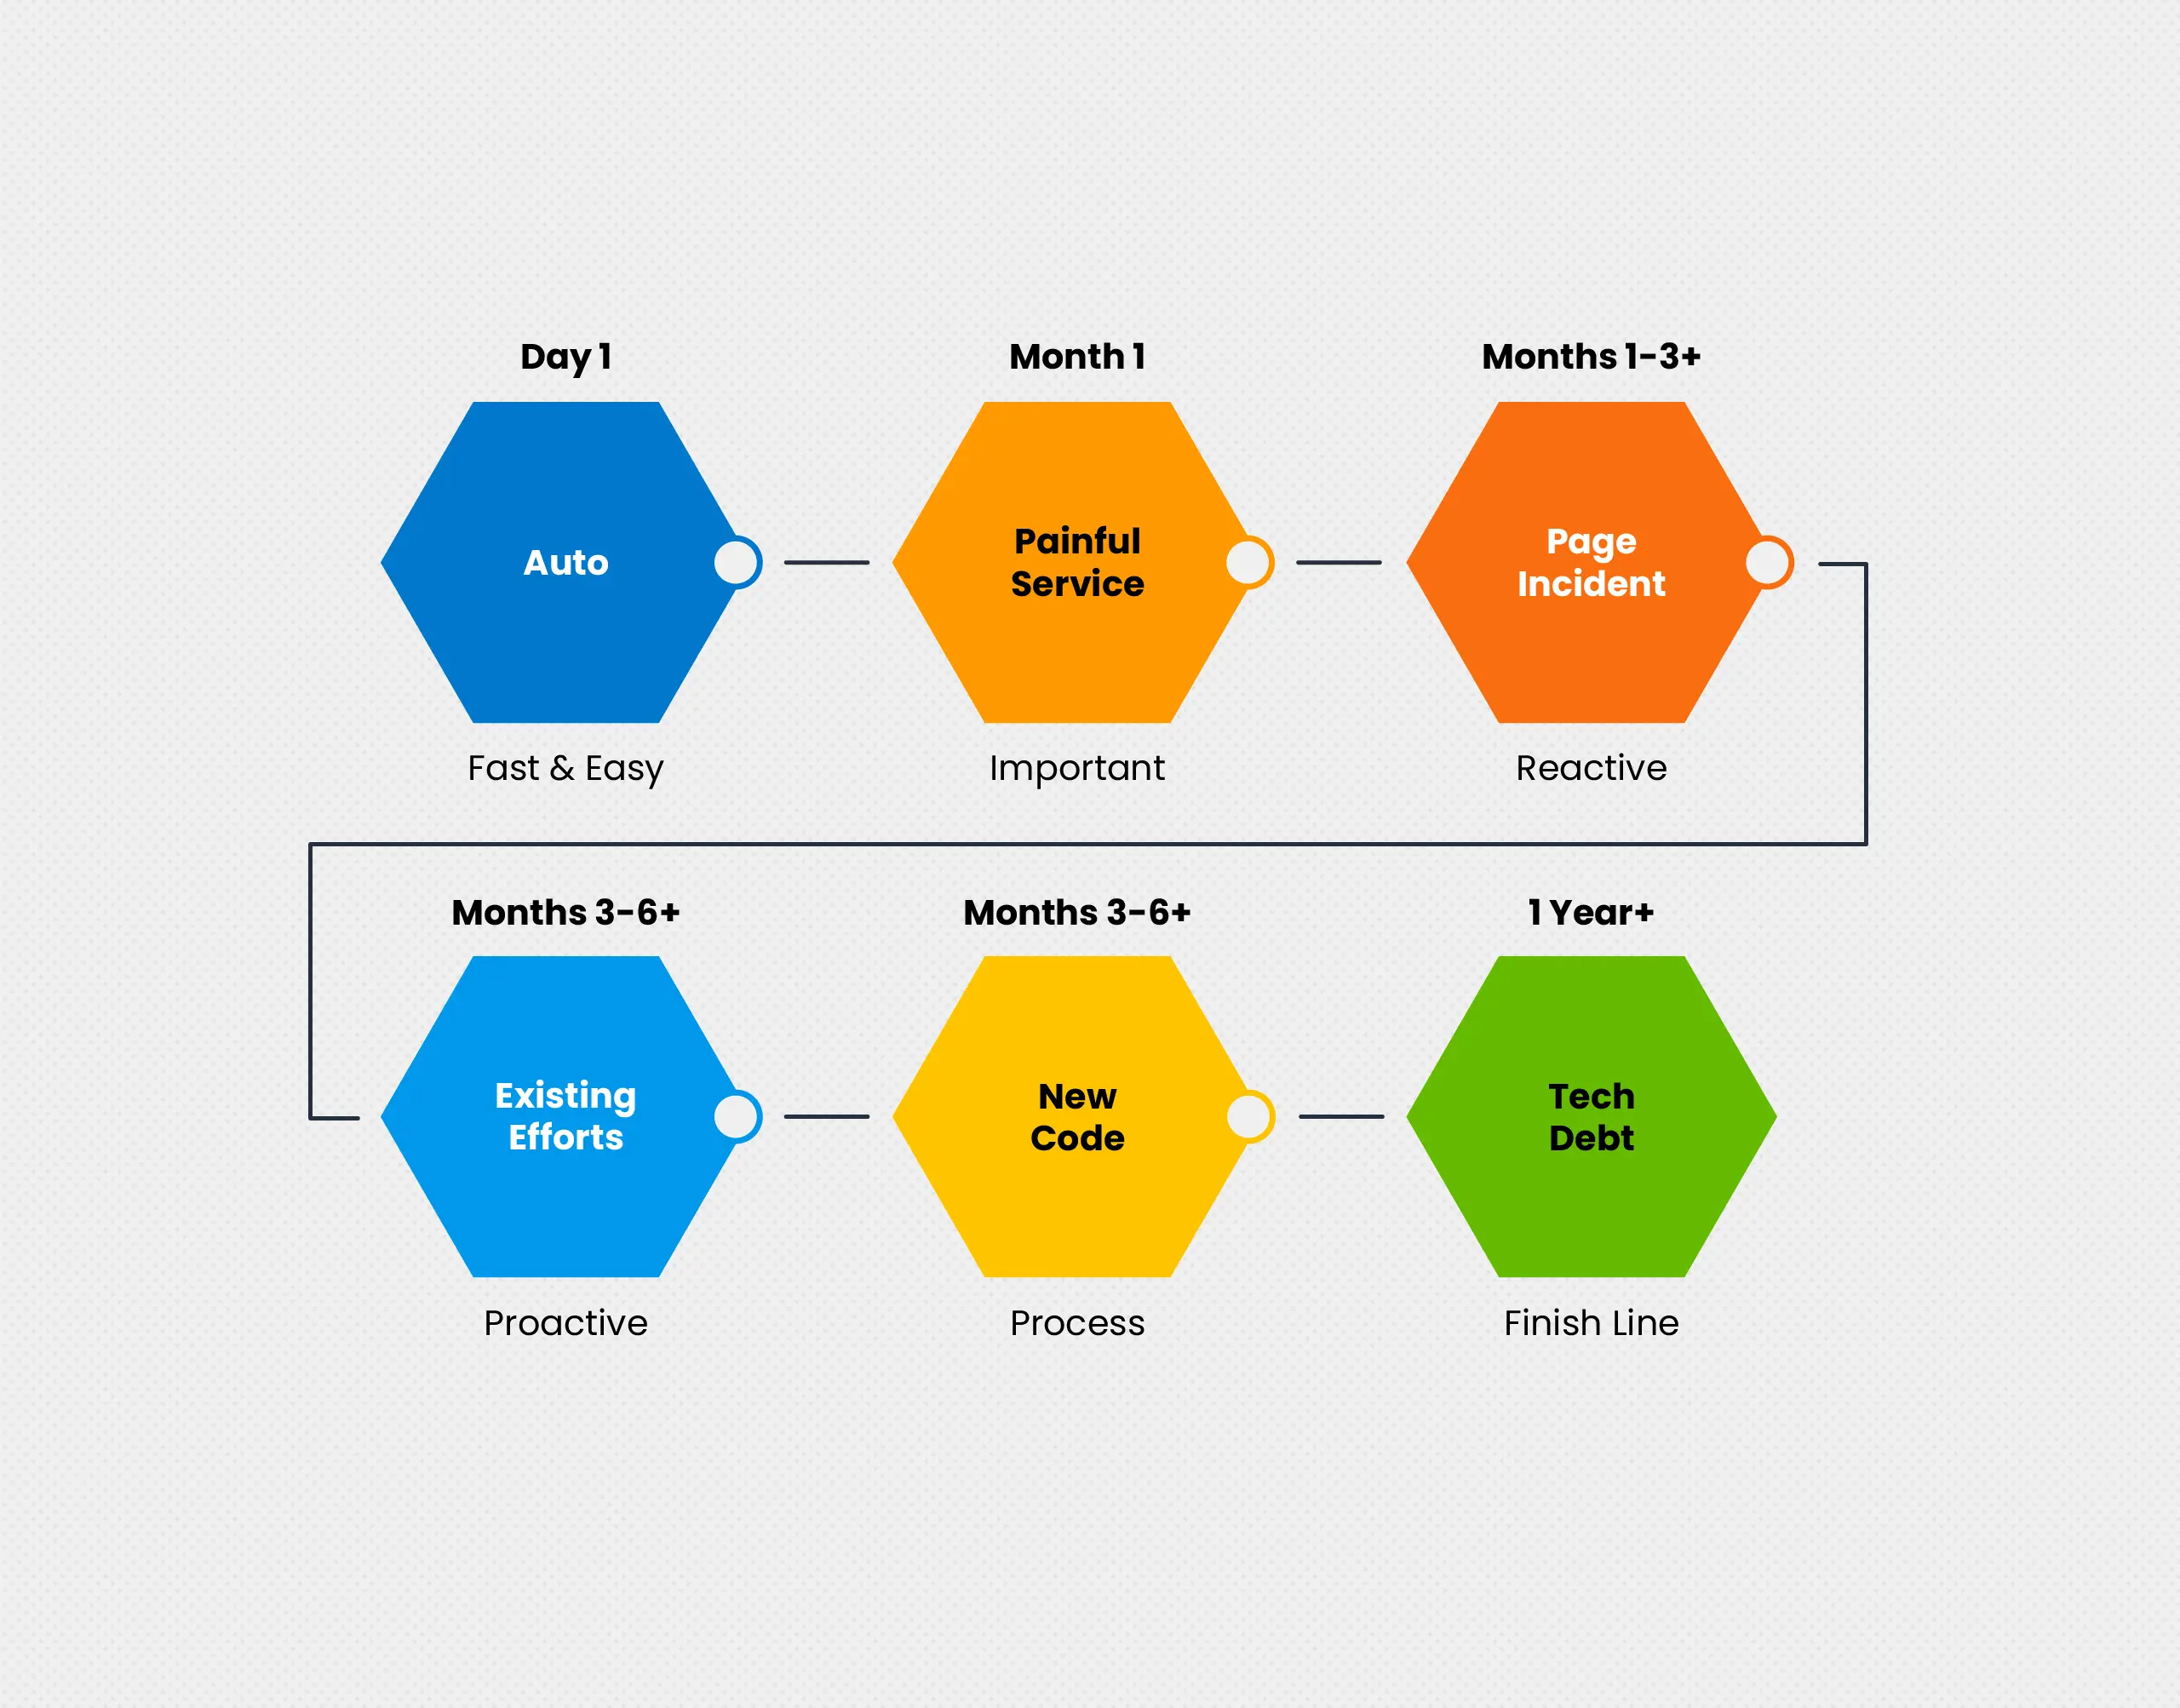
“How do I get started on instrumentation with OpenTelemetry, while also following best practices for the long-term?” This article is all about taking you from A to Z on instrumentation. Learn how to create immediate observability and see traces in your application right away, without changing code—and more!
Rynn Mancuso
Here’s what some of our customers had to say about Honeycomb features that they found value in right away.
Phillip Carter
Two of our folks went to Monitorama 2022, and they gleaned a few pearls of wisdom they’d love to share with you, including an unexpected, but surprisingly insightful talk on carbon impact reporting. Read more now.
Fred Hebert
A while ago, I wrote about how we track on-call health, and I heard from various people about how “expecting to be woken up” can be extremely unhealthy, or how tracking the number of disruptions would actually be useful. I took that feedback to heart and wanted to address the issues they raised, and also provide some numbers that explain the position I took with these metrics.
Get it delivered straight to your inbox.
By subscribing to our newsletter, you agree to Honeycomb’s Terms of Service and Privacy Notice.
Jessica Kerr (Jessitron)
In the social world, there is no outside: we participate in the systems we study. I’ve noticed this in code: when I come to an existing codebase, I get a handle on it by changing stuff. Change some text to “HELLO JESS” and see it on the screen. Break something on purpose and see what fails. Refactor and find compilation errors. After I make some real changes and shepherd them into production, then I’m integrated with the code, I come to an understanding of it.
Fahim Zaman
Are you overspending on monitoring and APM tools? Forrester’s Total Economic Impact analysis of Honeycomb identified significant ROI in customers using us to reduce spend on less efficient APM workflows. But this isn’t about…
In this webinar based on our O’Reilly book, we go over the difference between observability and monitoring – and when to use which.
Ben Hartshorne
This post will talk about using a derived column to directly connect individual customer experiences to the cost of providing that service with AWS Lambda. By leveraging these tools, we can better understand when our product is used in costly ways, and also provide tooling to better analyze and understand the cost effects of configuration changes.
“It’s expensive. It’s difficult. Our APM works just fine.” The three myths of observability can lead to being on call with under-instrumented tools. That’s exactly what happened to Paige Bernier, retired SRE. Let’s learn about her experience and see how we can avoid being in the same situation.
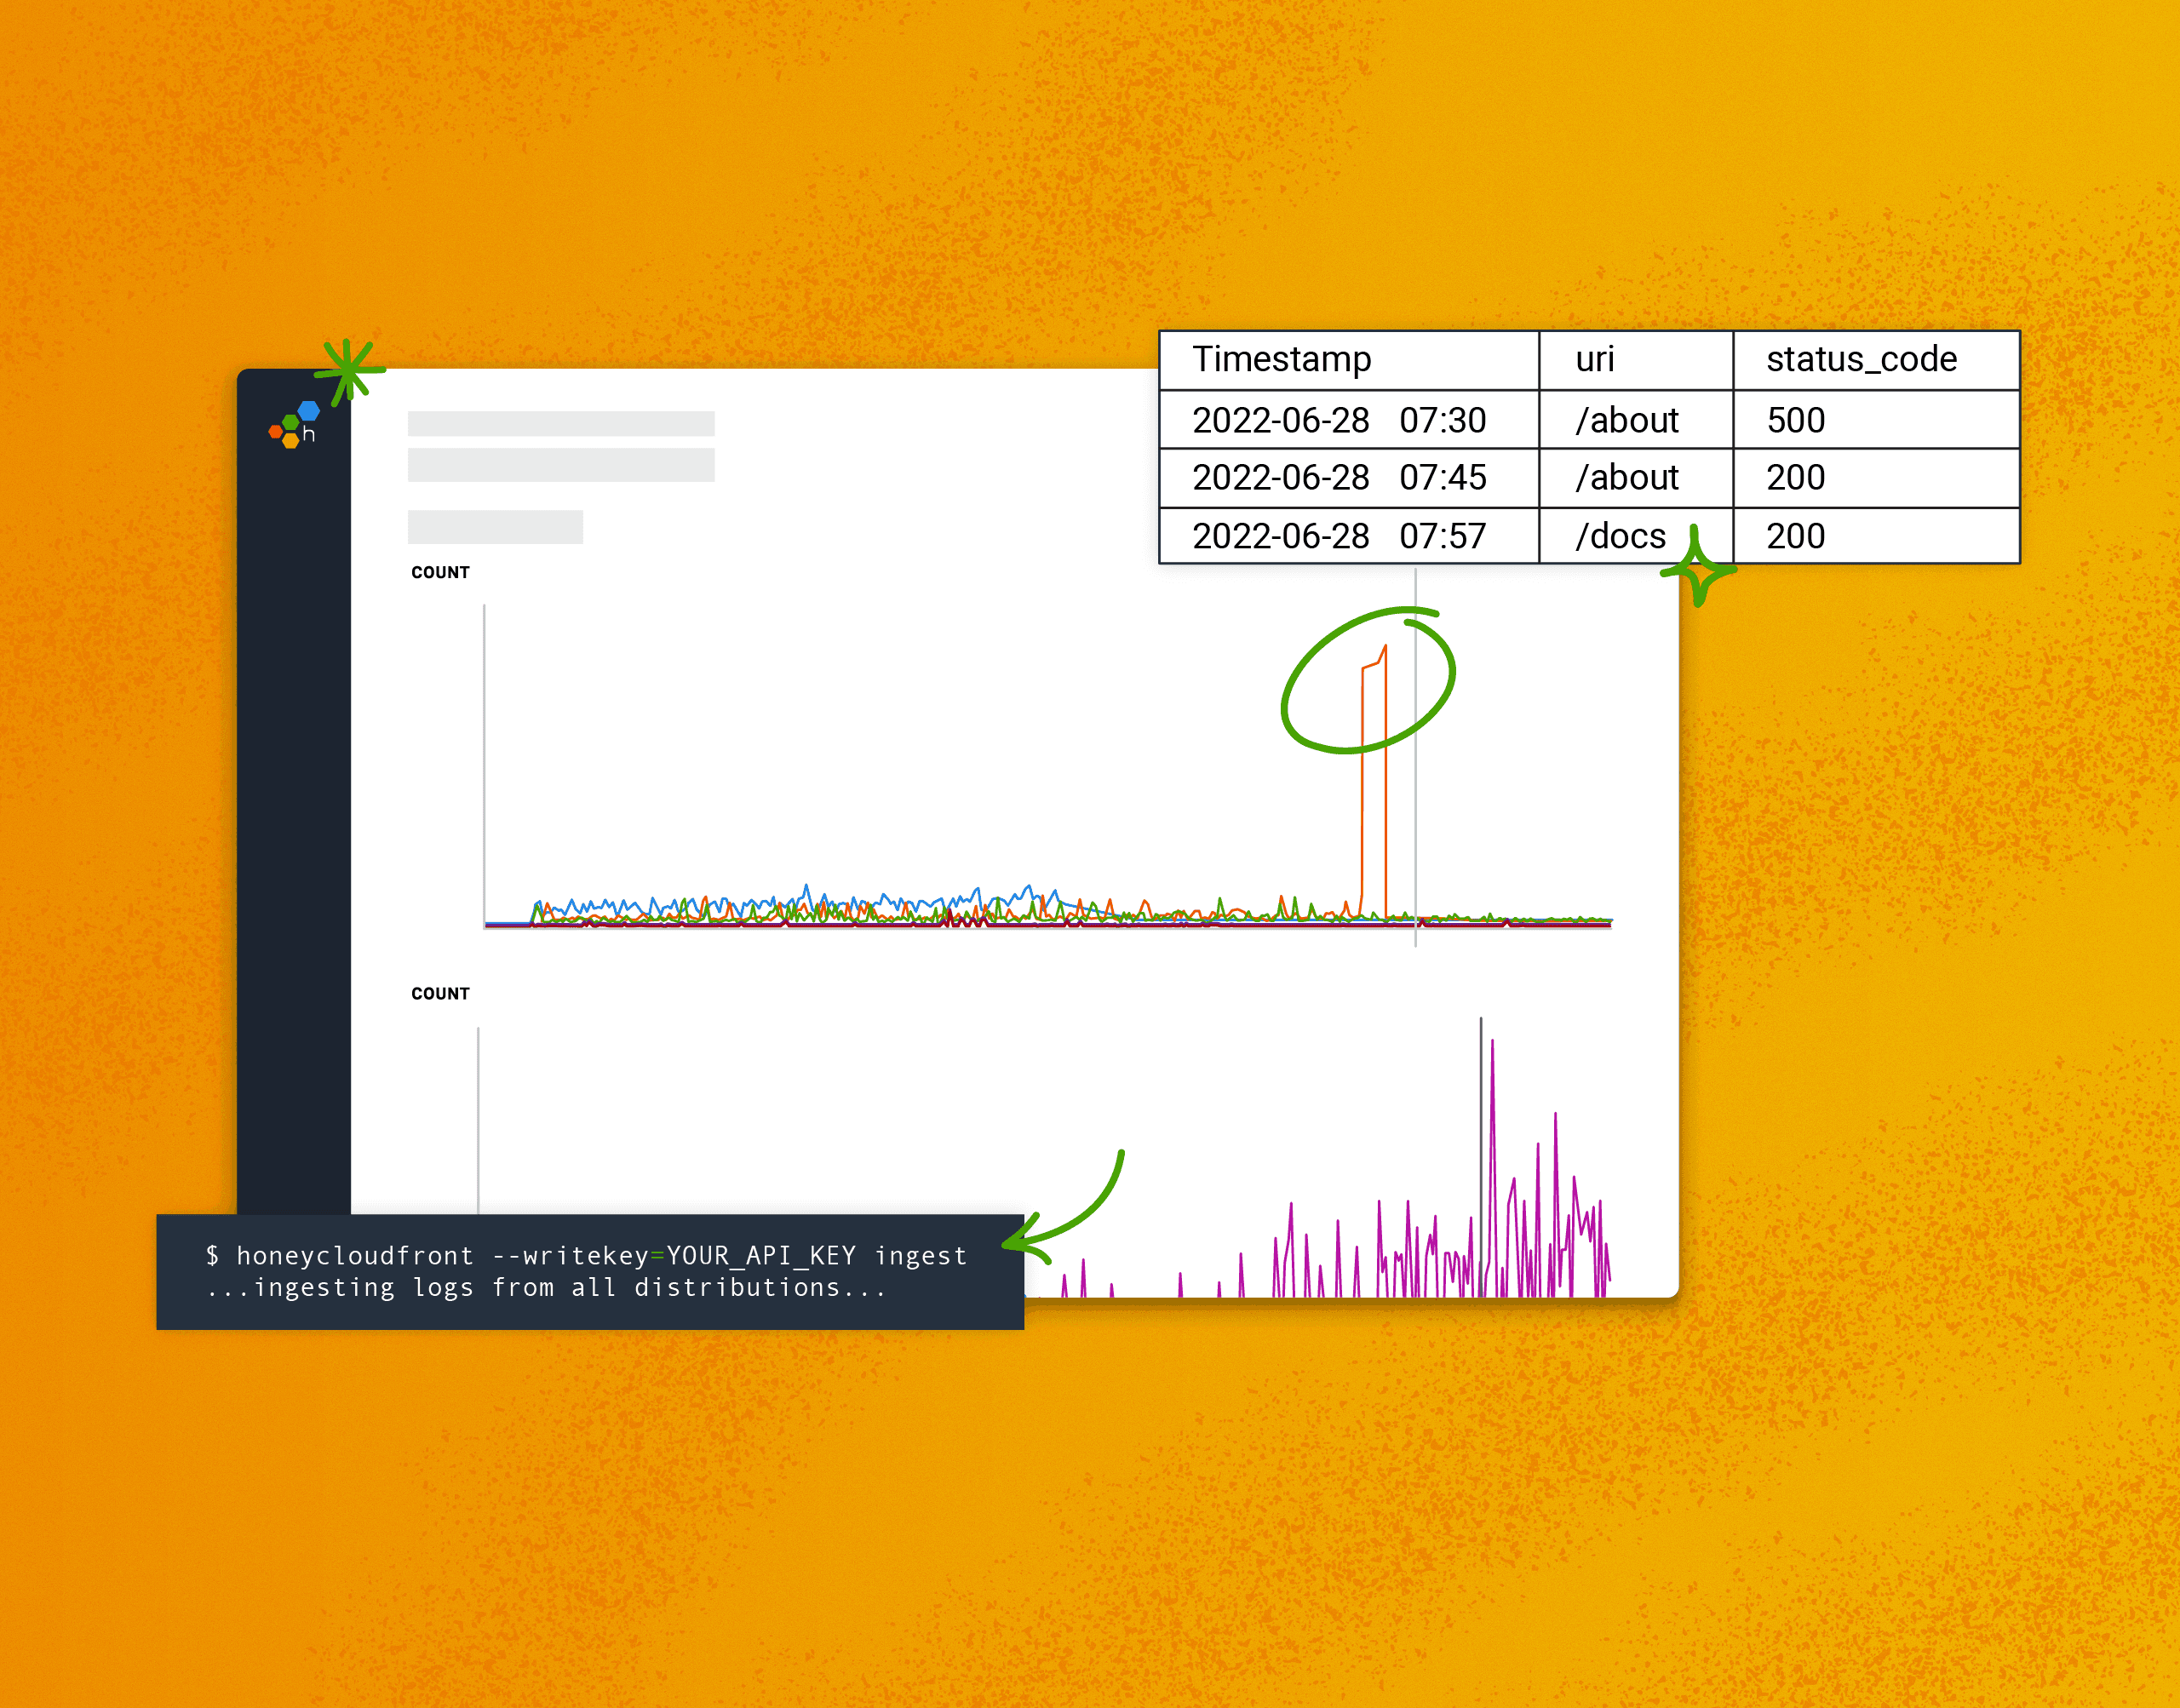
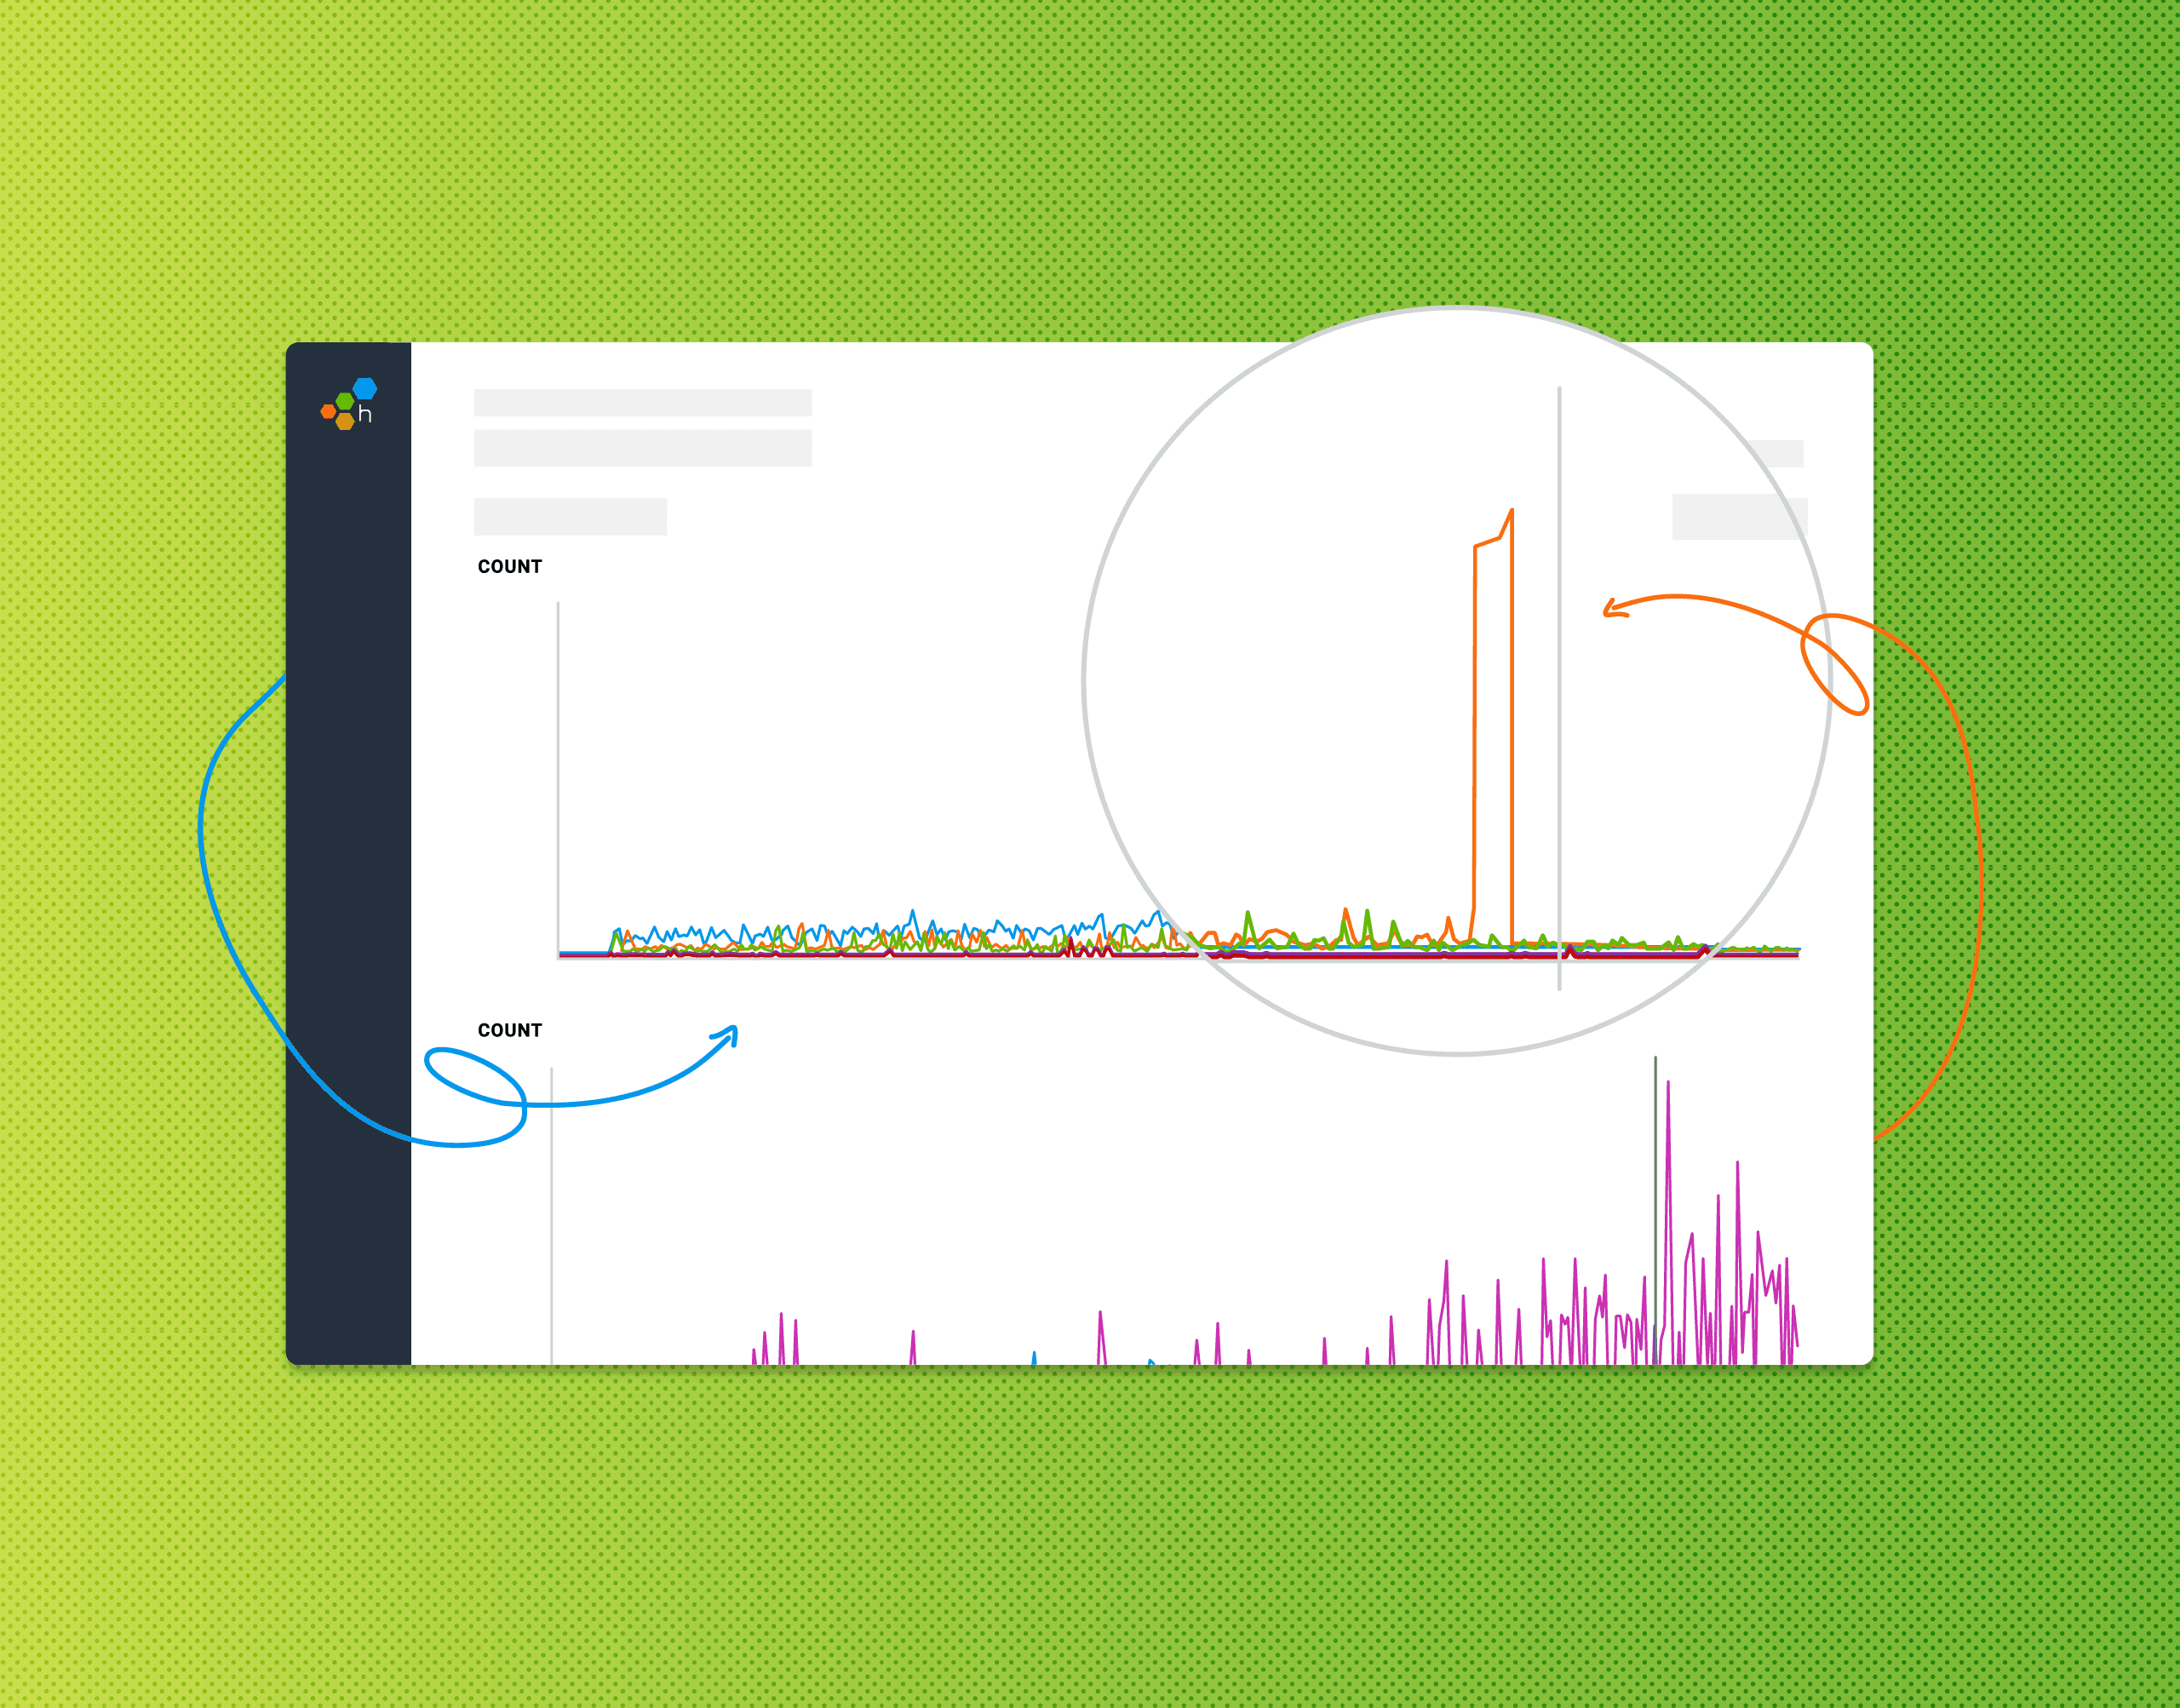
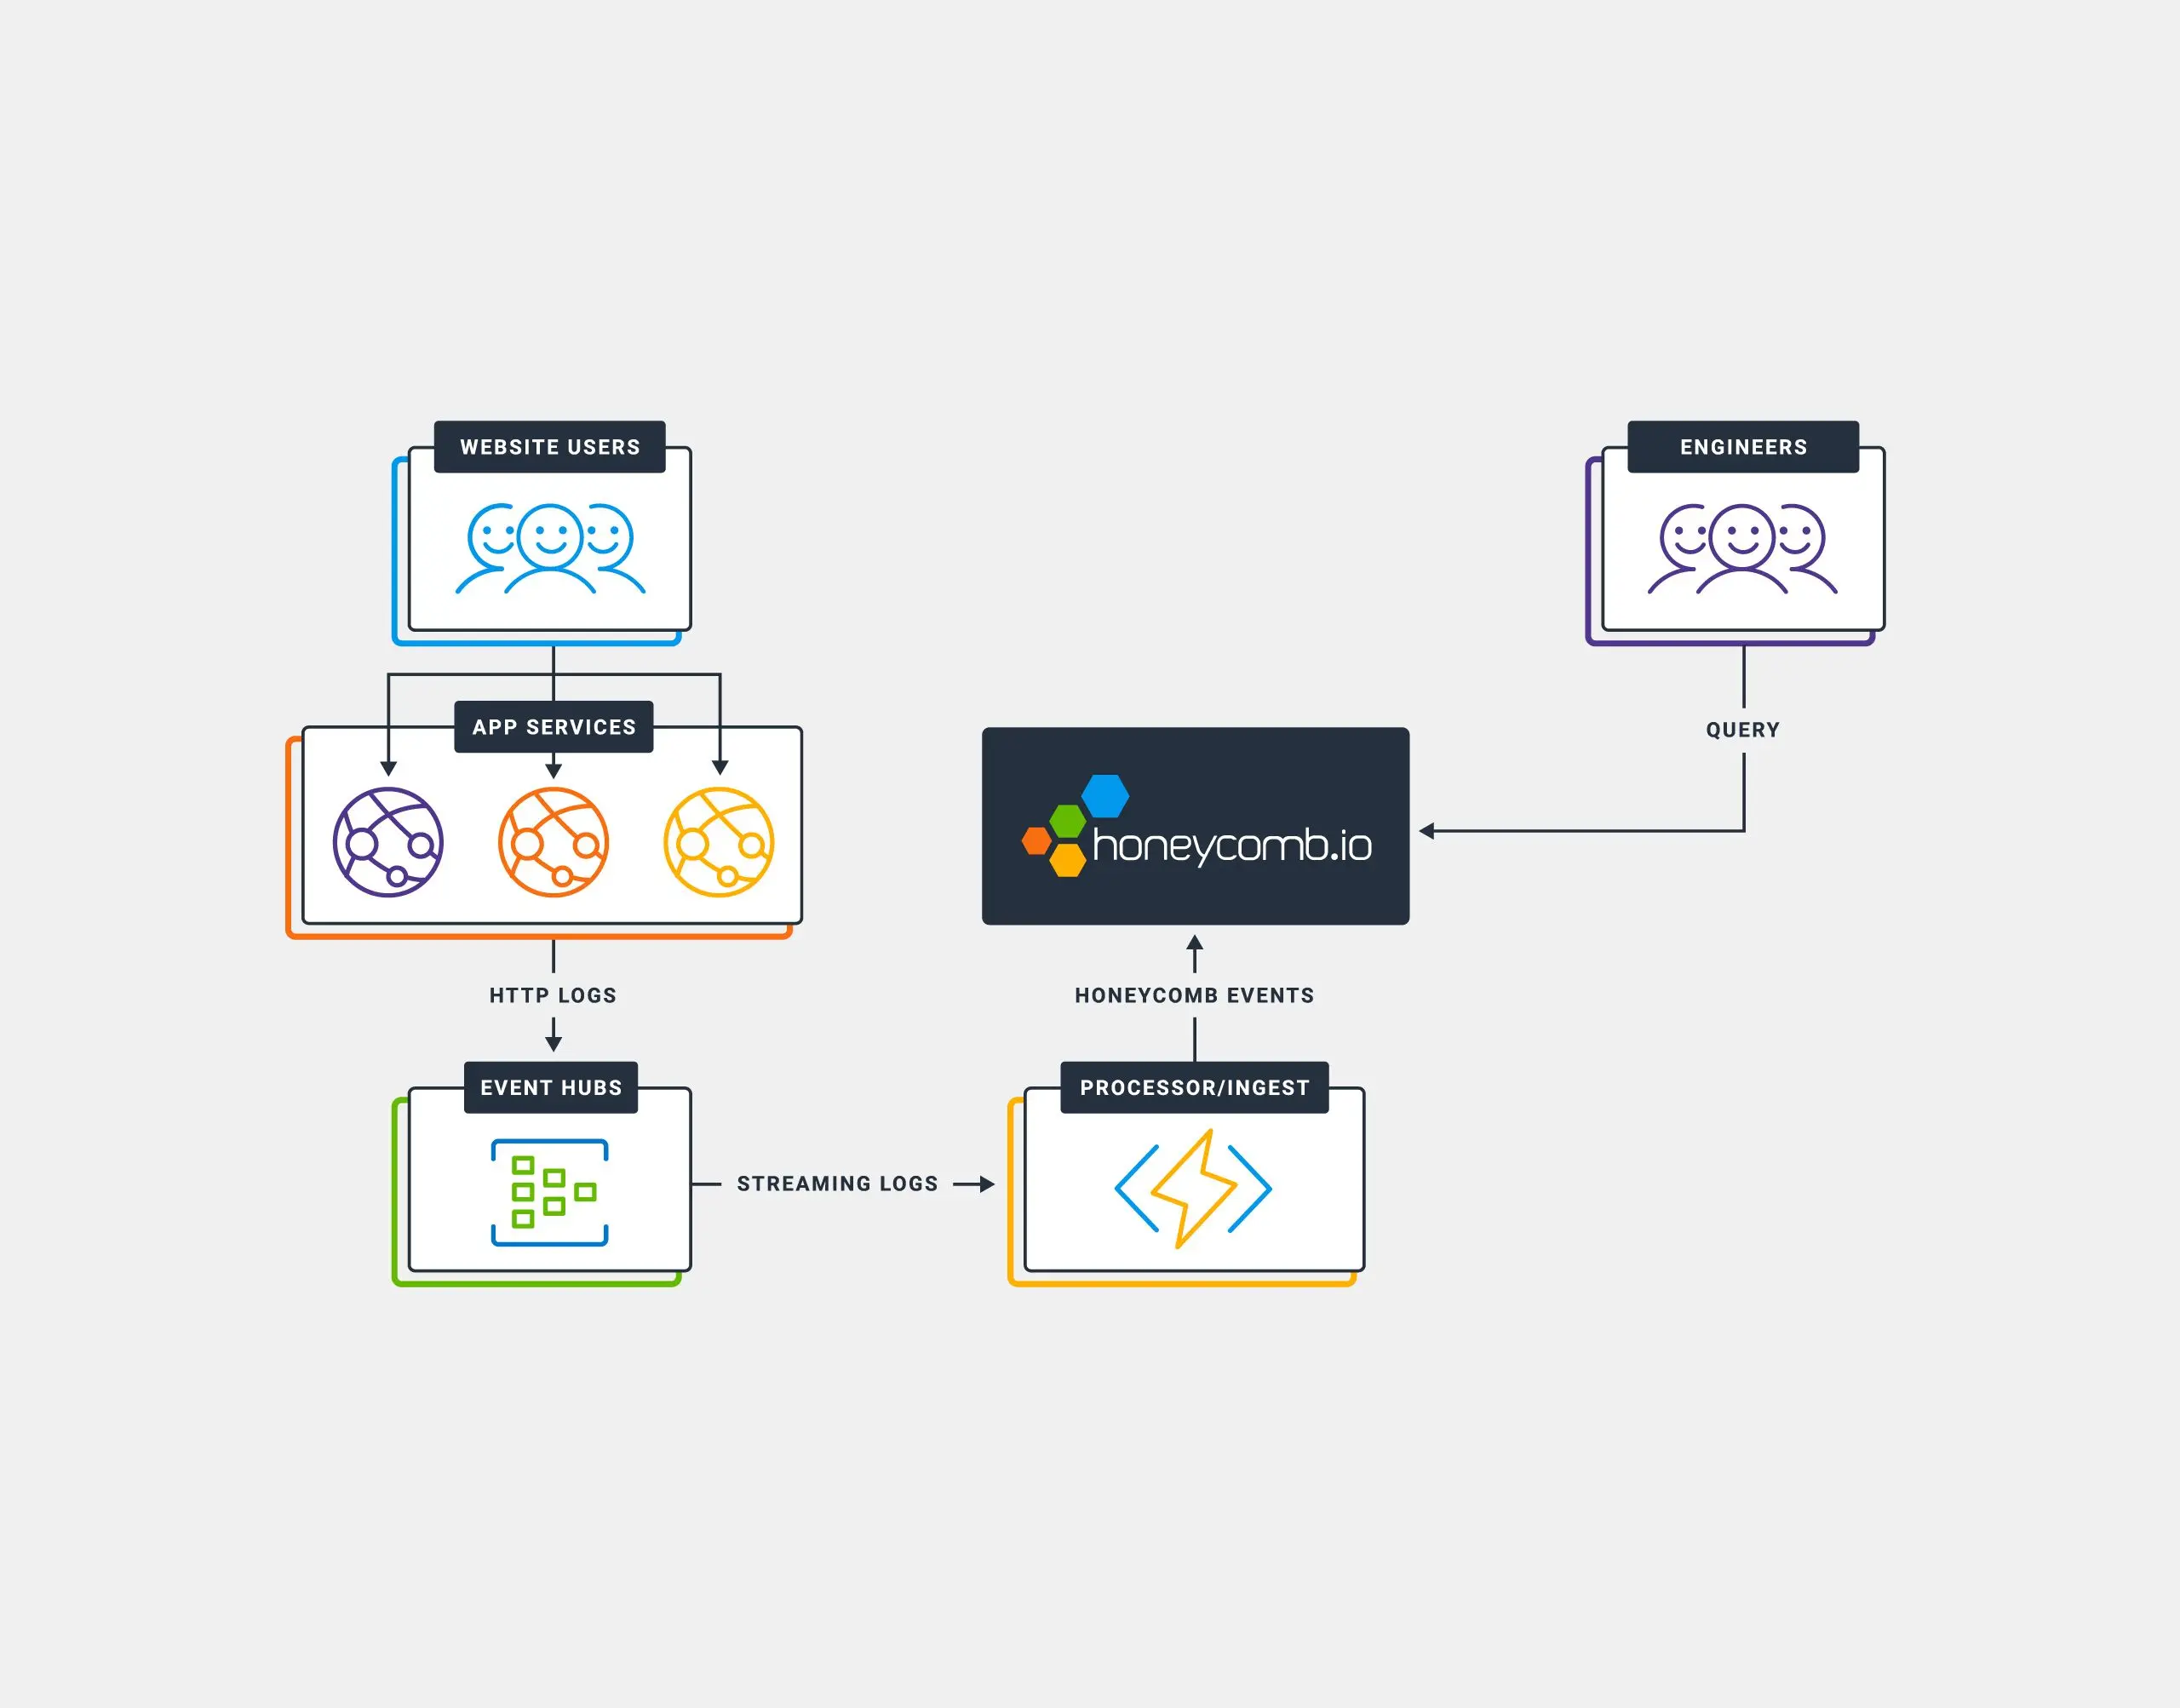
Debugging application performance in Azure AppService is something that’s quite difficult using Azure’s built-in services (like Application Insights). Among some of the issues are visualizations, and the time it takes to be able to query data. In this post, we’ll walk through the steps to ingest HTTP Access Logs from Azure AppService into Honeycomb to provide for near real-time analysis Access Logs.
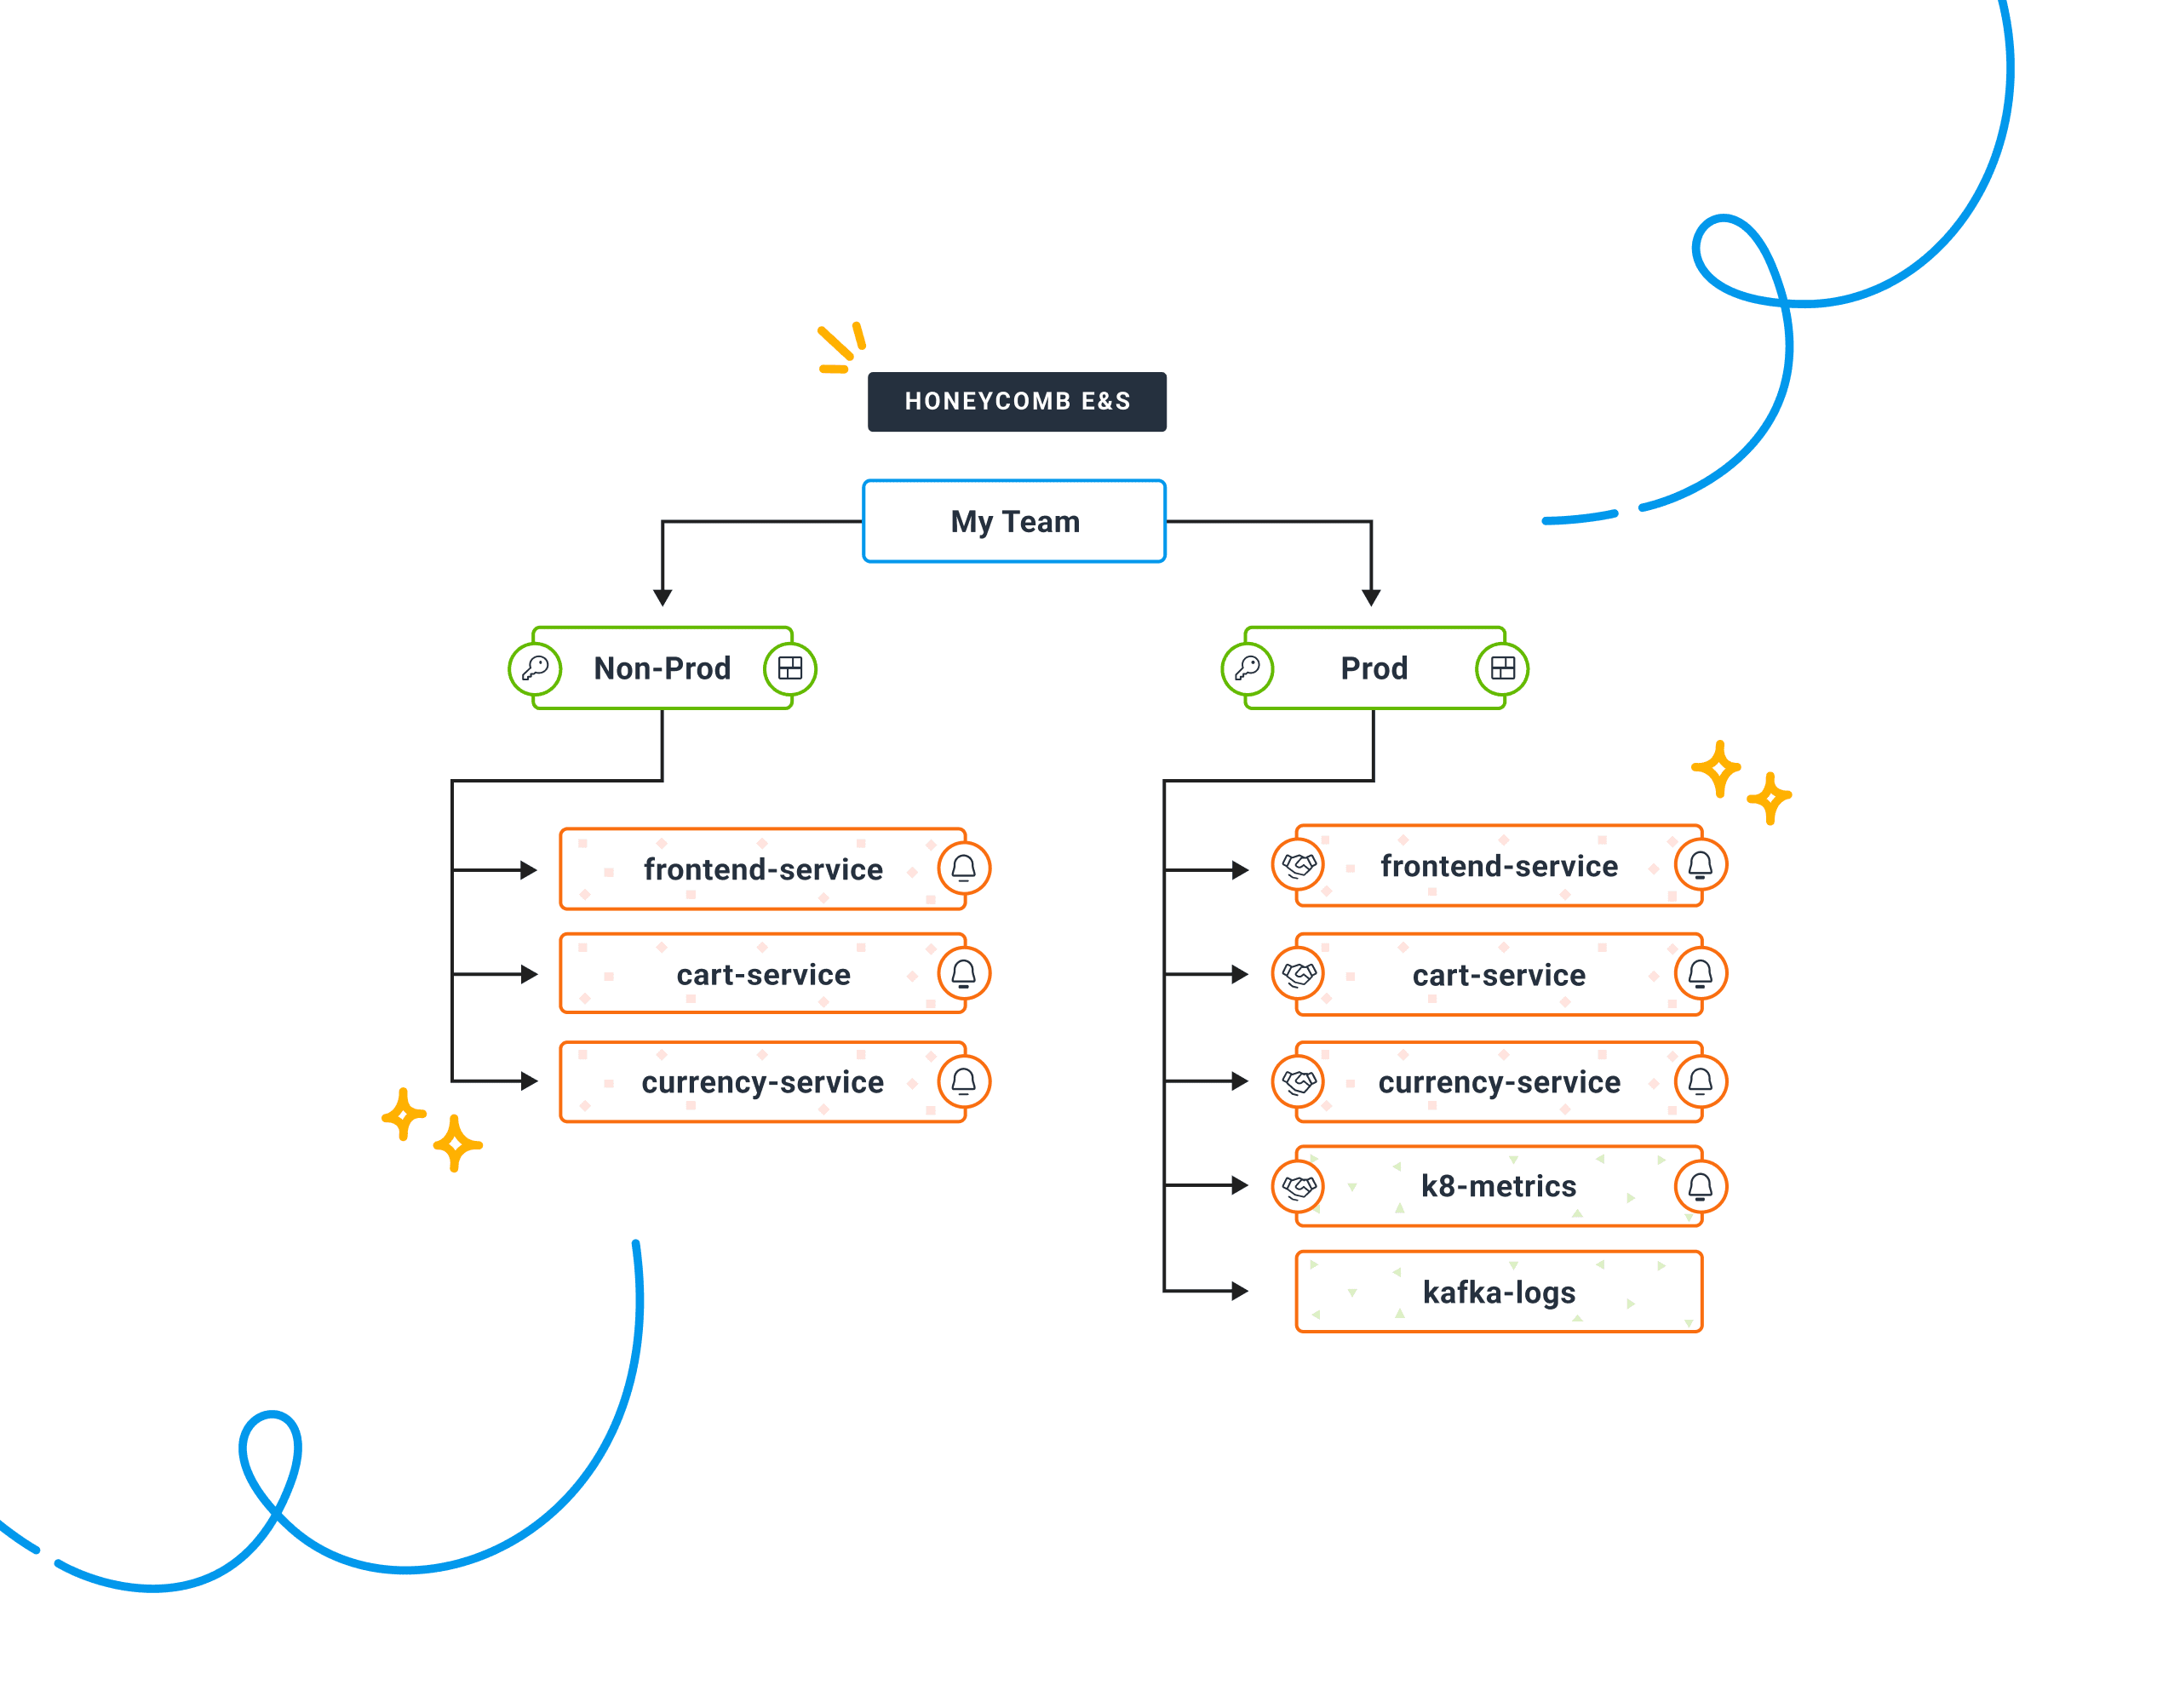
The software industry is moving toward teams that own the services they build. This concept encloses principles and possibilities from movements toward microservices, DevOps, Agile, and Project to Product. In these paradigms, a team of people delivers software that provides valued capabilities. These capabilities help customers get their work done, support business operations, or enable other software to do these. Writing code is only part of this; capabilities only work if the software is running in production. Service-ownership teams carry this responsibility. To own production, a team needs visibility into production. Honeycomb recognizes service ownership and supports it.
Liz Fong-Jones
Our Author’s Cut series takes a deep dive into our O’Reilly Observability Engineering book. Join us for this session on structured events.