Honeycomb was built for the AI era. Learn how to futureproof your software for what comes next.
Discover why Honeycomb is the better choice for your engineers, your customers, and your bottom line.
Start your journey with the definitive guide to observability. Download our complimentary ebook.
Bring observability to every software engineer.
Learn about our company, mission and values.
Come for the impact, stay for the culture.
See Honeycomb's latest press releases, media, and more
Learn more about becoming a Honeycomb partner.
Already a Honeycomb customer?
Jessica Kerr (Jessitron)
When you want to direct your observability data in a uniform fashion, you want to run an OpenTelemetry collector. If you have a Kubernetes cluster handy, that’s a useful place to run it. Helm is a quick way to get it running in Kubernetes; it encapsulates all the YAML object definitions that you need. OpenTelemetry publishes a Helm chart for the collector.
Craig Atkinson
Today, I’d like to share with you a new community-contributed integration that helps you optimize and debug your Gradle builds. This new Gradle plugin is available today, is free to use, and you can use it immediately with a free Honeycomb account.
Fred Hebert
In this incident review, we’ll cover the outage from September 8th, 2022, where our ingest system went down repeatedly and caused interruptions for over eight hours. We will first cover the background behind the incident with a high-level view of the relevant architecture, how we tried to investigate and fix the system, and finally, we’ll go over some meaningful elements that surfaced from our incident review process.
Fahim Zaman
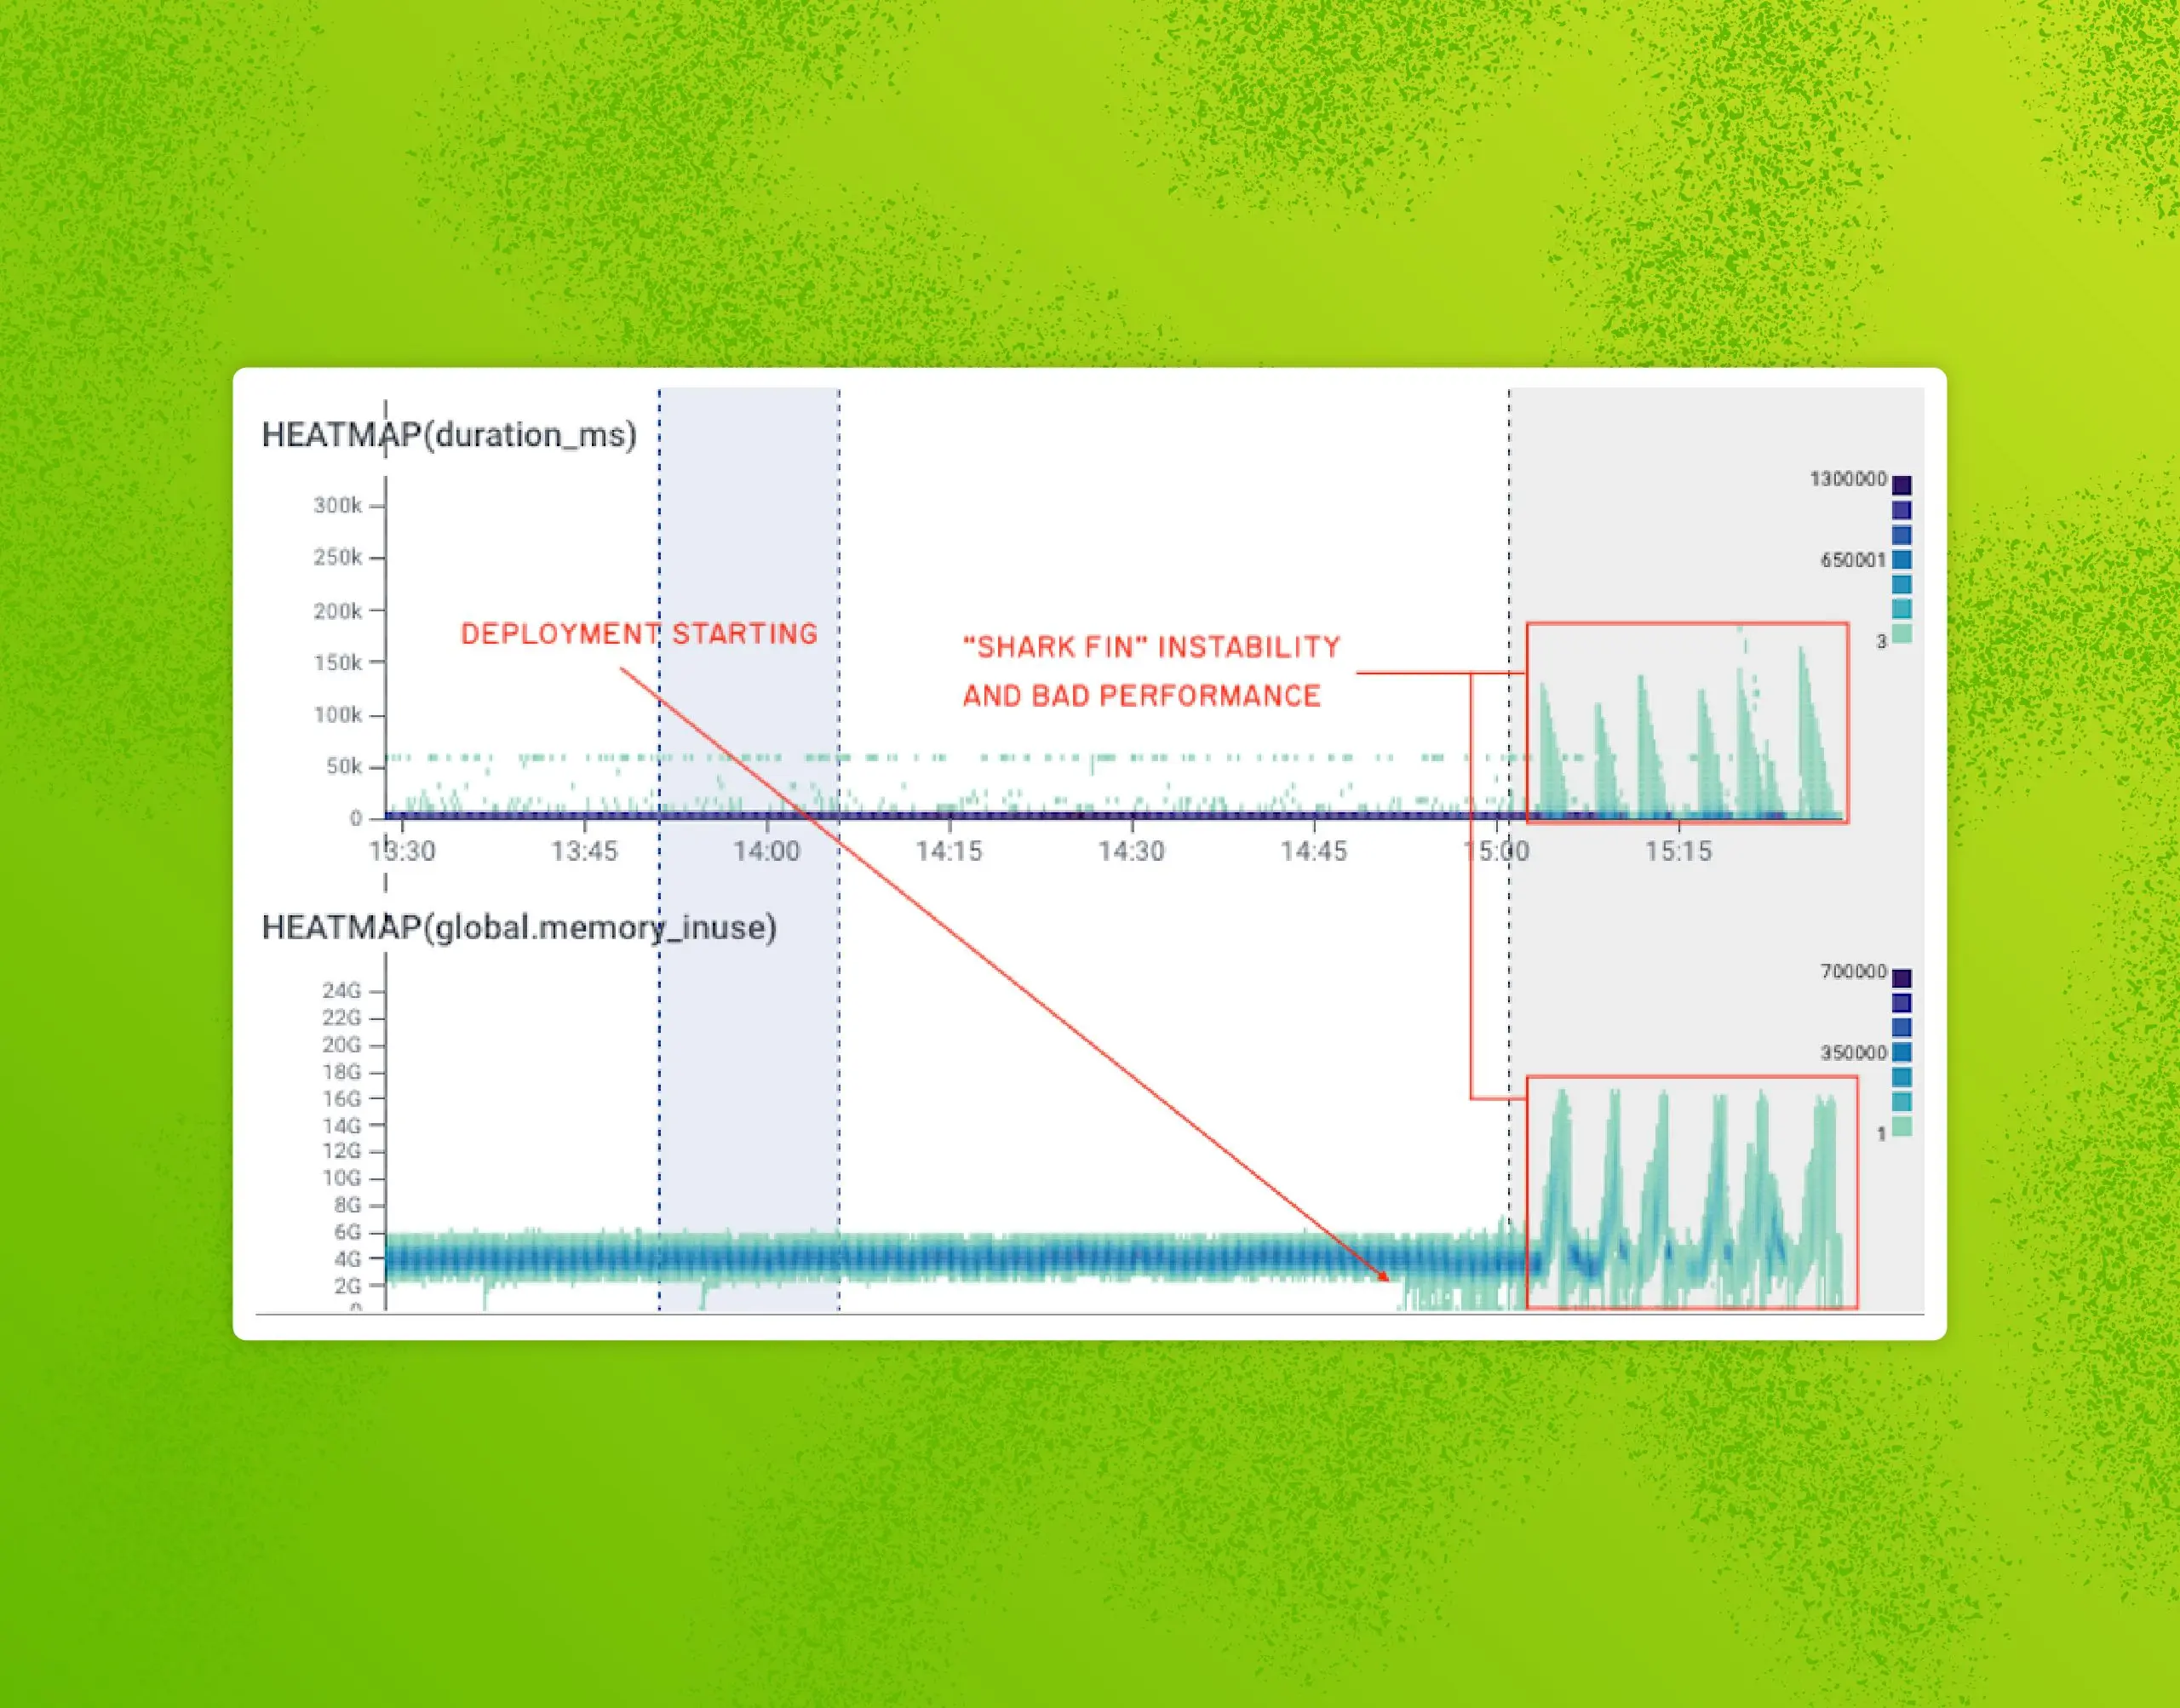
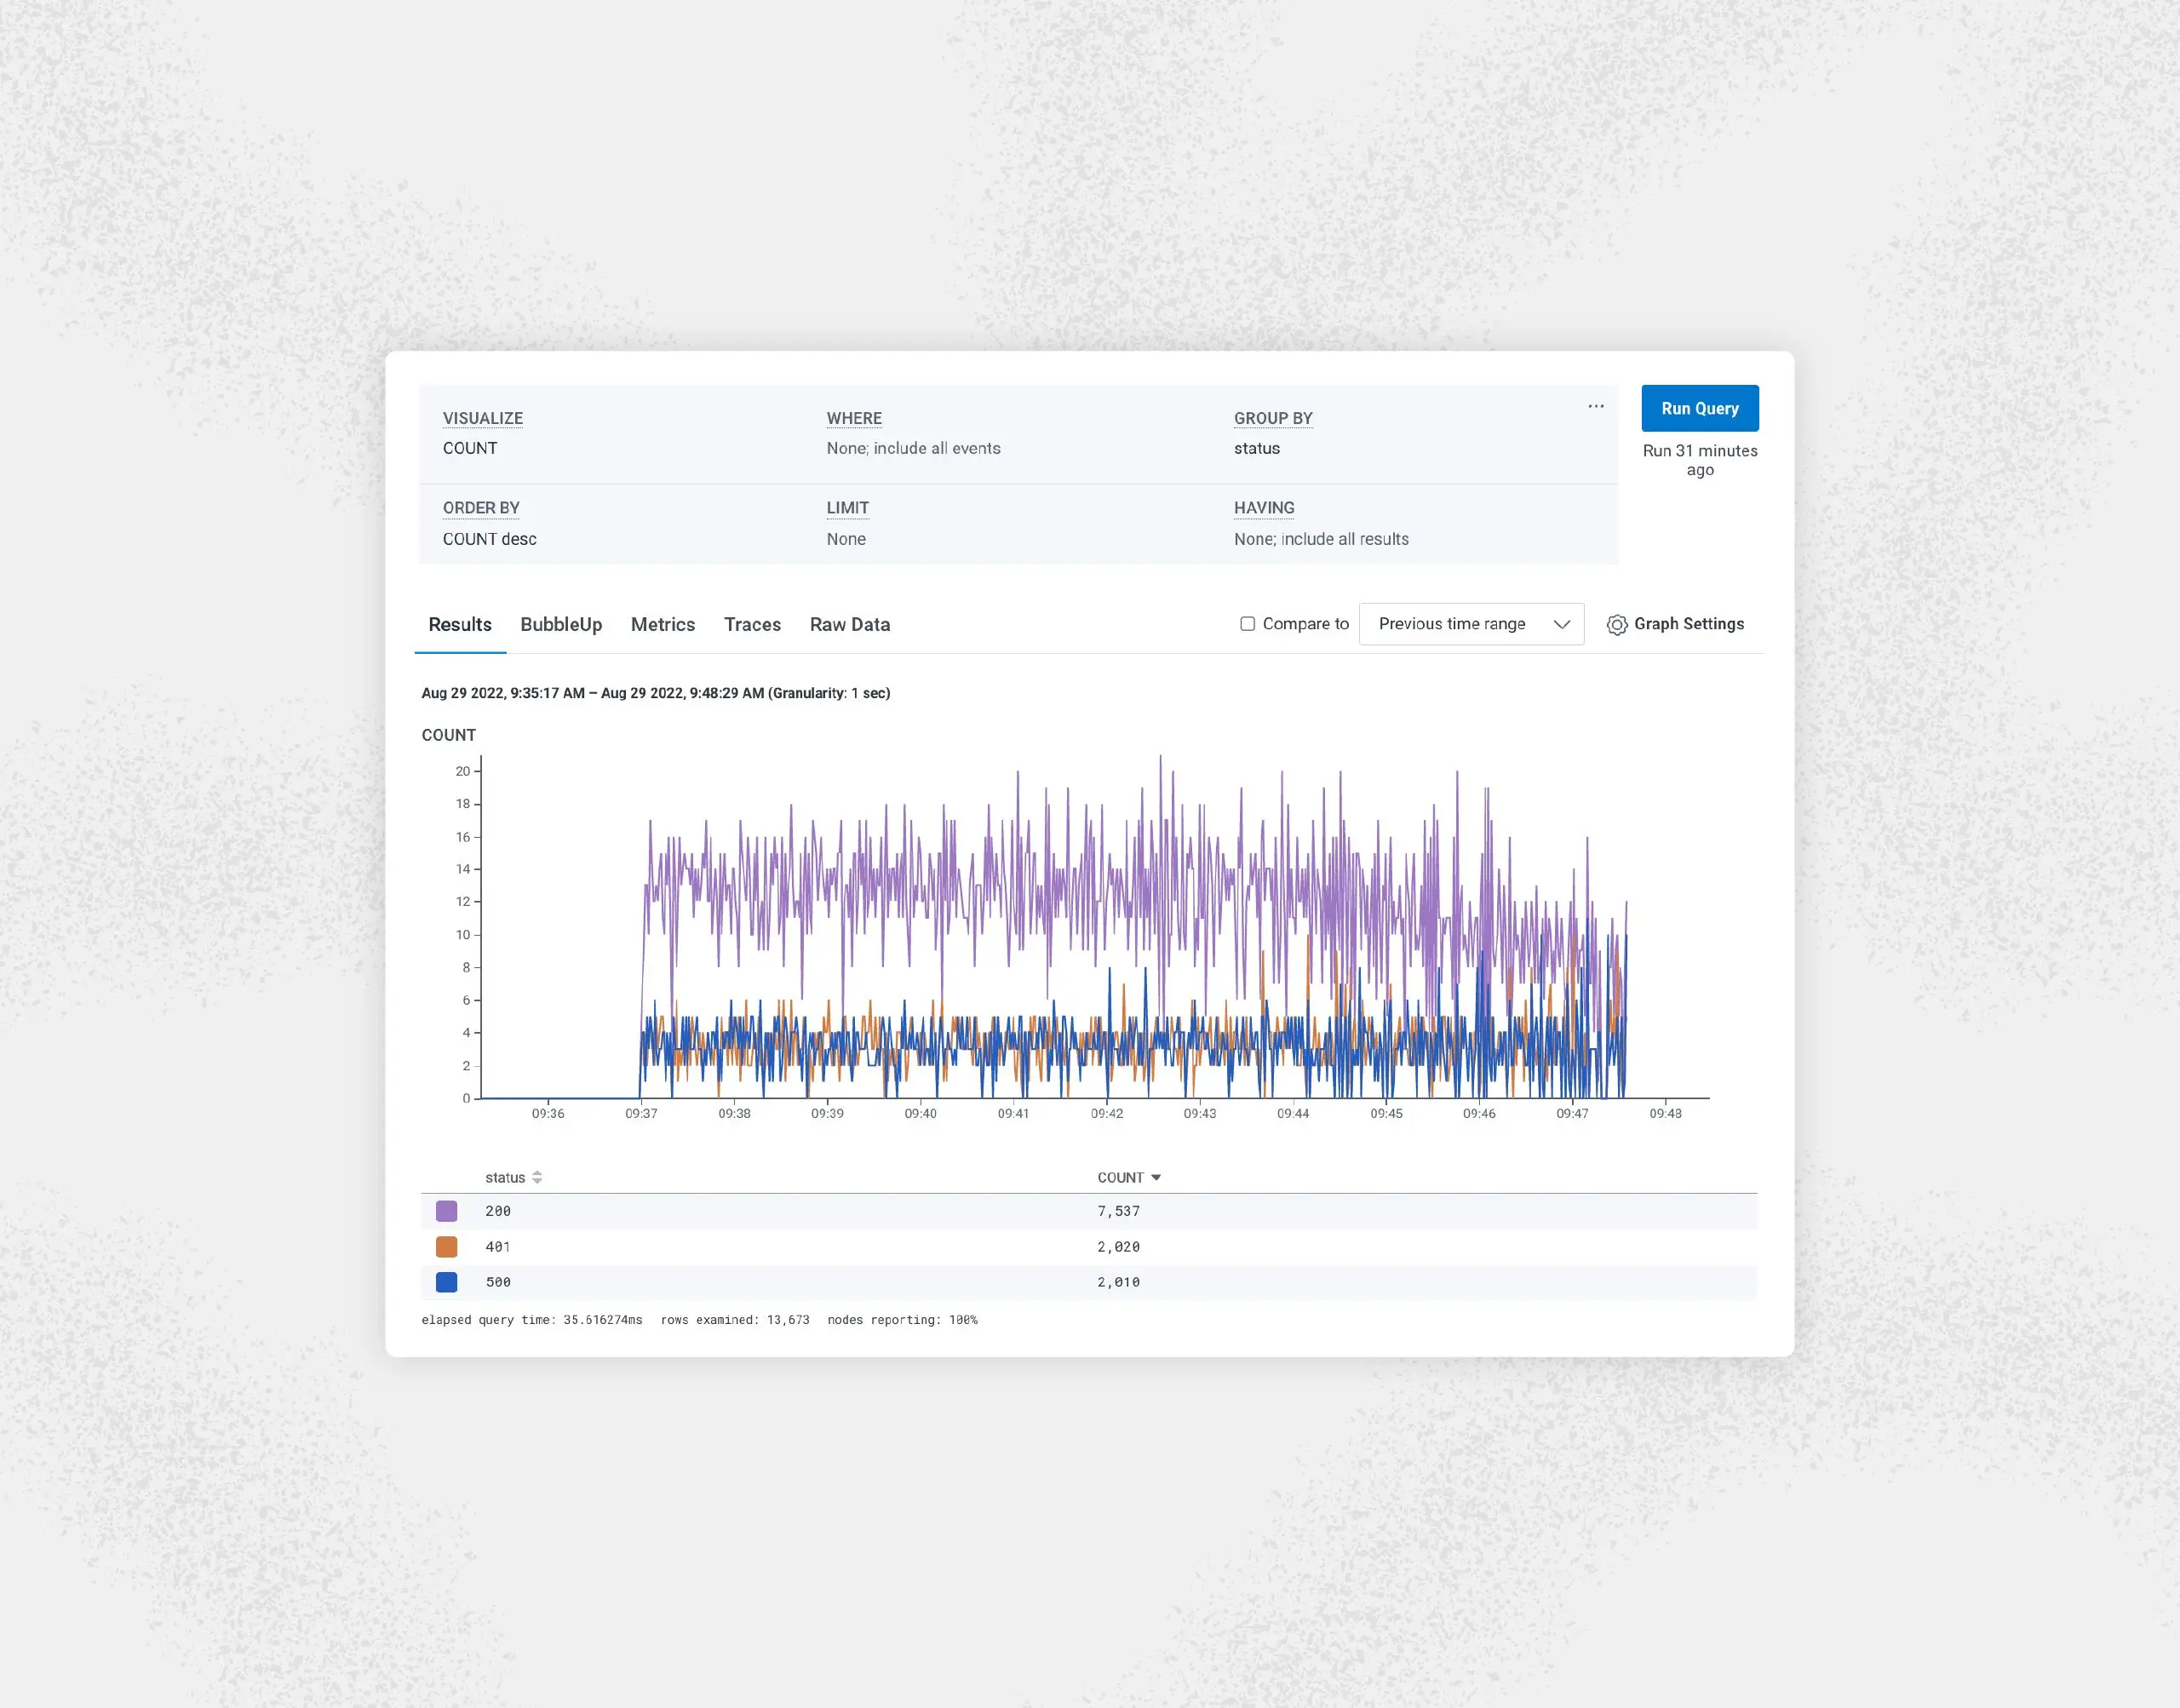
We’re thrilled to share that we’ve made significant enhancements to BubbleUp that will enable users to BubbleUp from more parts of the Honeycomb UI beyond heatmaps.
Phillip Carter
Just a few short months ago, we talked about a bunch of updates to Honeycomb’s support for OpenTelemetry. To the surprise of no one, we’ve got more updates to share!
Liz Fong-Jones
You know that old adage about not seeing the forest for the trees? In our Authors’ Cut series, we’ve been looking at the trees that make up the observability forest—among them, CI/CD pipelines, Service Level Objectives, and the Core Analysis Loop. Today, I’d like to step back and take a look at how observability fits into the broader technical and cultural shifts in technology: cloud-native, DevOps, and SRE.
Charity Majors
I am thrilled to share with you that Honeycomb now has a Field CTO: our very own Liz Fong-Jones.
George Miranda
How do you solve the people and culture problems that are necessary in making the shift to adopt observability practices? And once you instill those changes, how do measure the benefits?
Matt Morris
Today, I’d like to tell you about a new community-contributed integration that connects Honeycomb to your ServiceNow workflows. My new integration reimagines what’s possible when connecting observability tools with ITSM systems. This post explains how it works and how to get started with it.
Nick Rycar
Feature Focus: September 2022. Here’s a look at improvements we’ve made to Honeycomb in September, including: updates to a buuunch of APIs, new integrations, and Refinery upgrades.
In the beginning, there were people who wrote and ran software. At some point, we spun away ops skills from dev skills into two different professions, but that turned out to be a ginormous mistake, so along came DevOps to reunify them. Nowadays, ops as an independent profession is in the process of fading out. Companies are spinning down their ops teams left and right. Engineers who formerly identified as sysadmins or operations have turned into DevOps engineers, and soon there will just be “software people” again. This is the way of things.
Learn how Jimdo, Upgrade, and Campspot benefited from OpenTelemetry, whether in improved performance, or by avoiding vendor lock-in.
Get it delivered straight to your inbox.
By subscribing to our newsletter, you agree to Honeycomb’s Terms of Service and Privacy Notice.
Nick Travaglini
Part of understanding a complex, distributed software system as a socio-technical system means taking seriously that the signals the stewards receive aren’t just chatter.
Martin Thwaites
Let’s dig into what we mean by an Availability Check and how that maps to observability, tracing, and supporting production systems.
In this post, we’ll look at how to host the OpenTelemetry Collector in Azure Container Apps. There are a few gotchas with how it’s deployed, so hopefully this will stop you from hitting the same issues.
A few weeks ago, we had a couple of incidents that ended up impacting query performance and alerting via triggers and SLOs. These incidents were notable because of how challenging their investigation turned out to be. In this review, we’ll go over interesting patterns associated with growth, and complex systems—and how these patterns challenged our operations.
Guest Blogger
You use NGINX as a proxy for your application, and you want to leverage Honeycomb’s amazing features to help make sense of the traffic data. Have no fear: Honeycomb has a solution just for you.
Today, we’re announcing major new updates to Honeycomb’s PagerDuty integration. These updates put more of the information you need into PagerDuty notifications and allow for greater configurability. These enhancements are available to all users who leverage Honeycomb Triggers and Burn Alerts to send notifications via PagerDuty.
Just like any aspect of development, poor integration, invisible bottlenecks, and bugs can plague your CI/CD pipelines. And debugging them? Well, it’s complicated. To see what I mean, just fire up your favorite search engine to find content on “debugging CI/CD pipelines.” Look at all the different tools, studios, and blogs full of advice—it’s soul crushing.
Feature Focus: August 2022. Here’s a look at improvements we’ve made to Honeycomb in August, including: better filtering capabilities, derived columns editor, and a new copy button.