Honeycomb was built for the AI era. Learn how to futureproof your software for what comes next.
Discover why Honeycomb is the better choice for your engineers, your customers, and your bottom line.
Start your journey with the definitive guide to observability. Download our complimentary ebook.
Bring observability to every software engineer.
Learn about our company, mission and values.
Come for the impact, stay for the culture.
See Honeycomb's latest press releases, media, and more
Learn more about becoming a Honeycomb partner.
Already a Honeycomb customer?
Nathan Lincoln
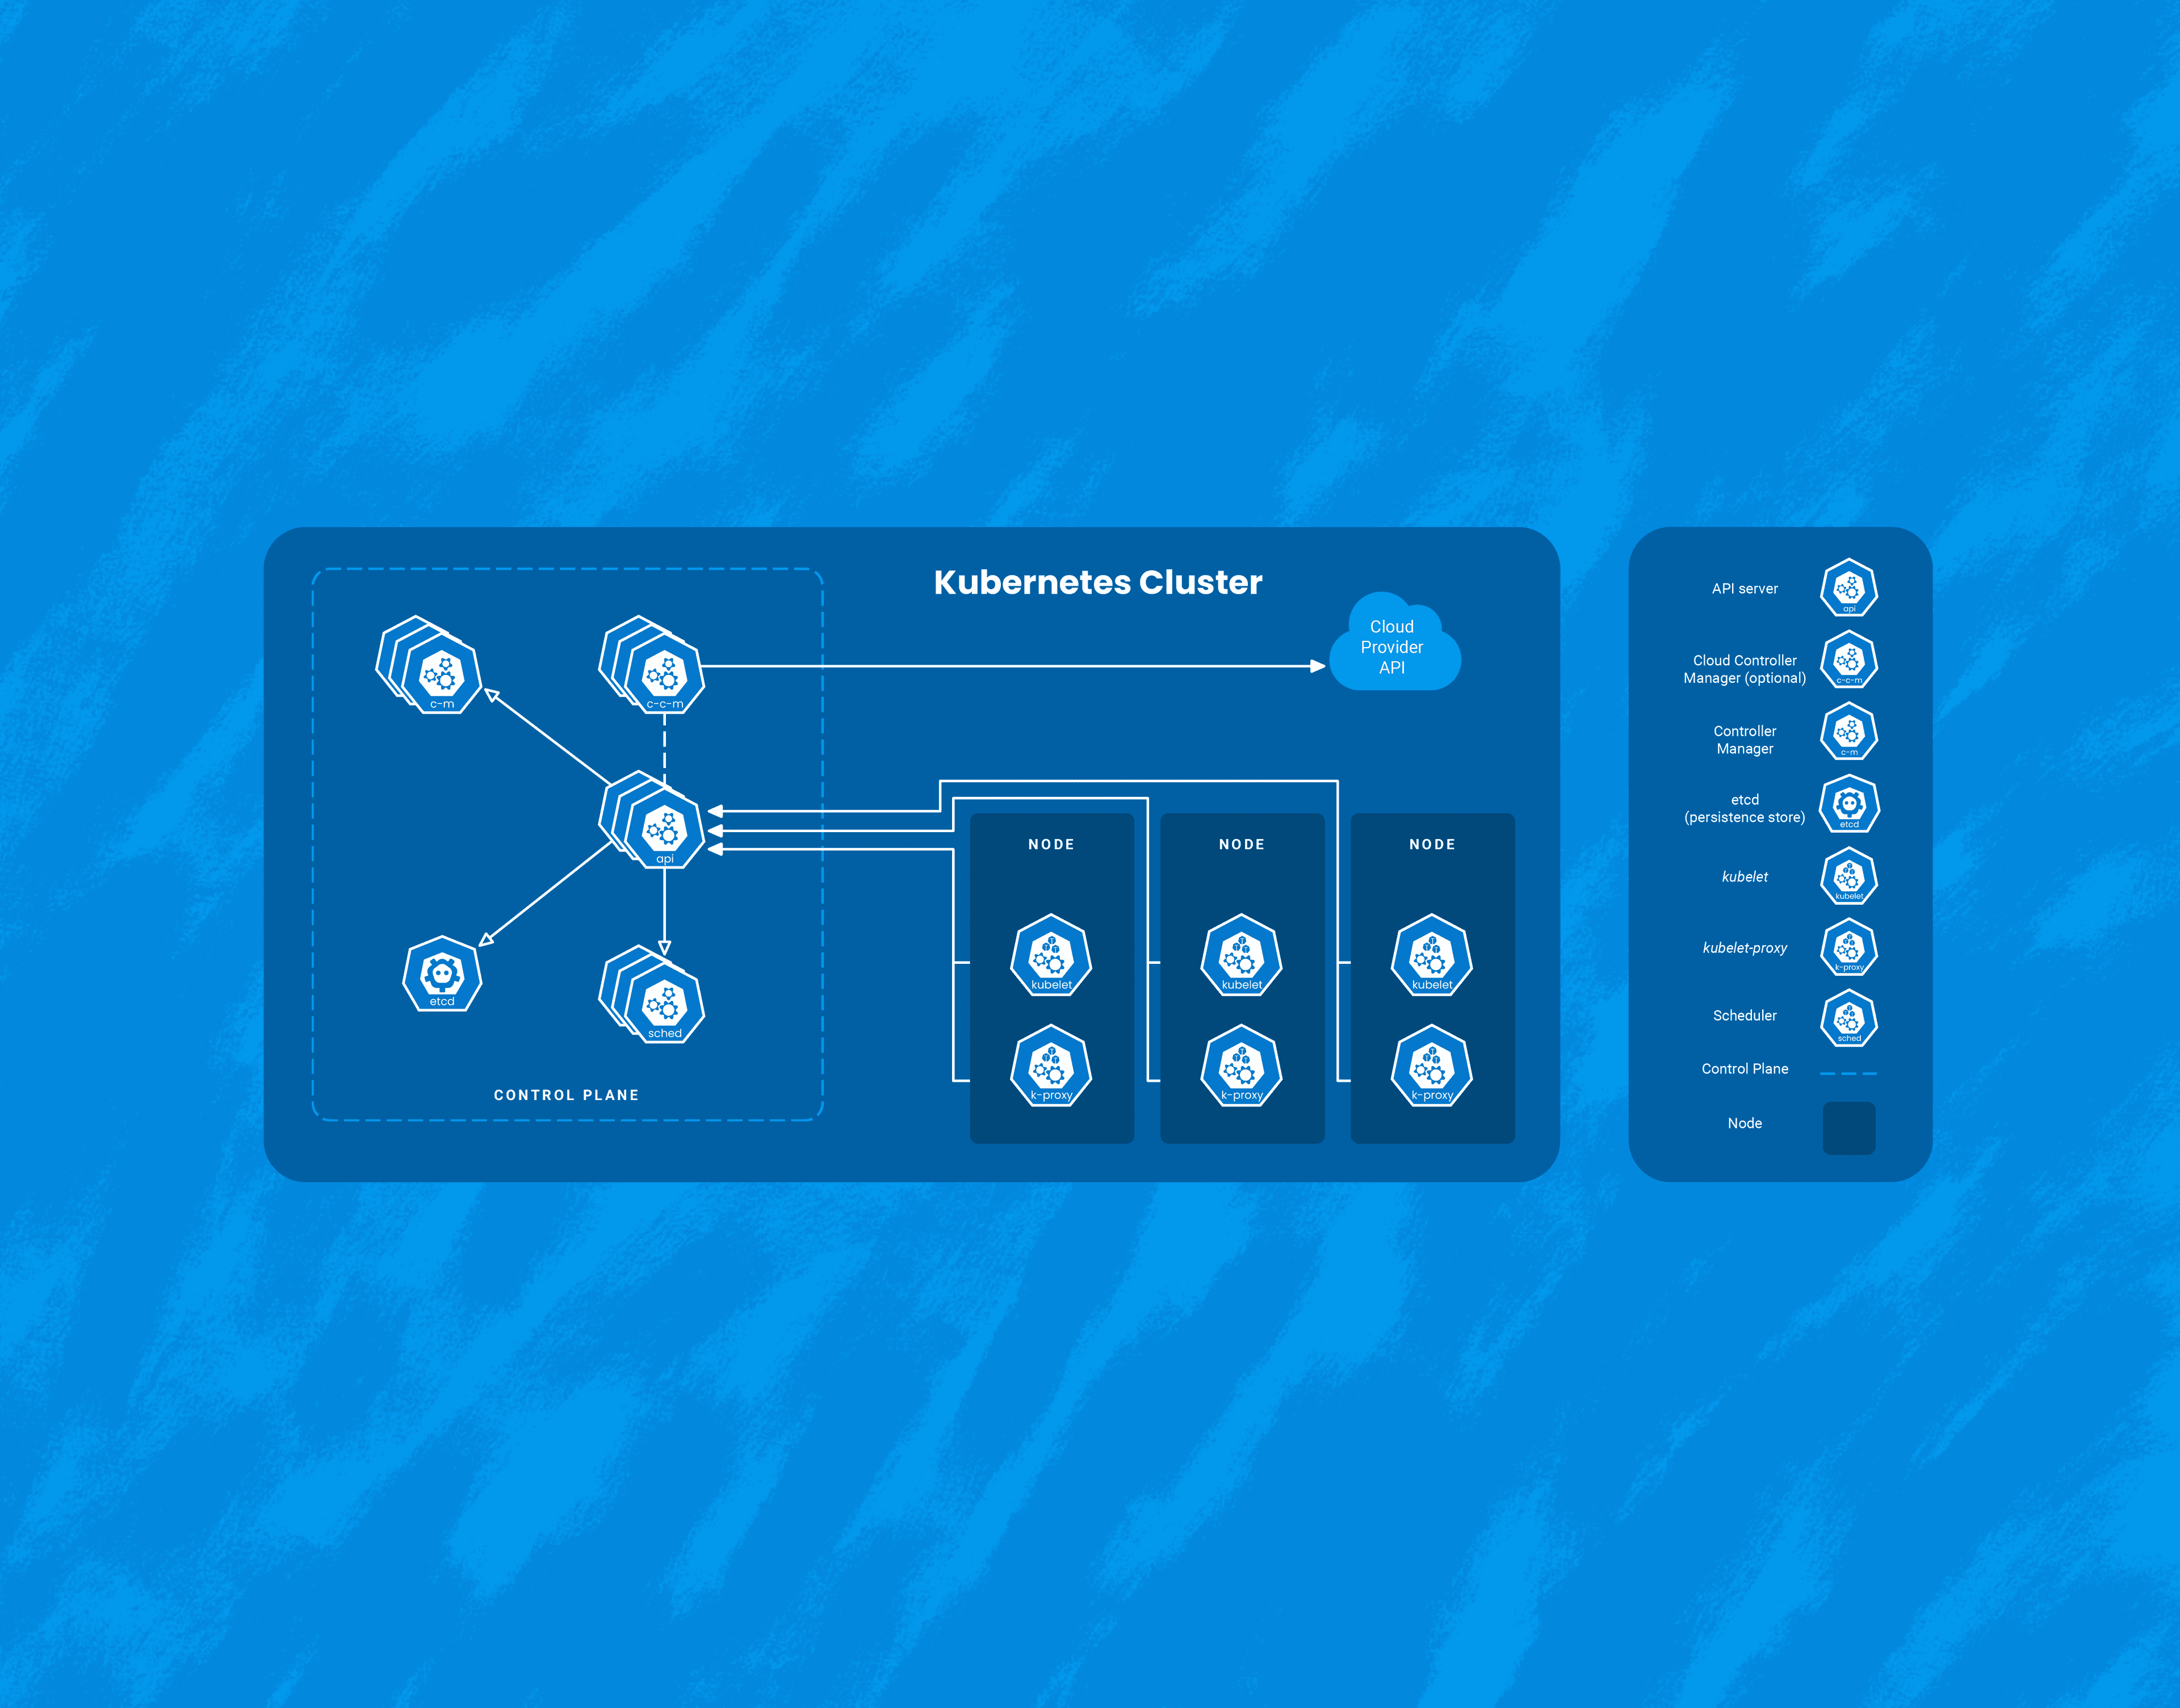
While Kubernetes comes with a number of benefits, it’s yet another piece of infrastructure that needs to be managed. Here, I’ll talk about three interesting ways that Honeycomb uses Honeycomb to get insight into our Kubernetes clusters. It’s worth calling out that we at Honeycomb use Amazon EKS to manage the control plane of our cluster, so this document will focus on monitoring Kubernetes as a consumer of a managed service.
Tyler Helmuth
Running a Kubernetes cluster isn’t easy. With all the benefits come complexities and unknowns. In order to truly understand your Kubernetes cluster and all the resources running inside, you need access to the treasure trove of telemetry that Kubernetes provides. With the right tools, you can get access to all the events, logs, and metrics of all the nodes, pods, containers, etc. running in your cluster. So which tool should you choose? Since we are all in on OpenTelemetry, we think the best solution is the OpenTelemetry Collector.
Tyler Wilson
Frontend observability is a tricky problem. No website is free of errors or slowdowns; sites break down in weird ways for all kinds of reasons. Accounting for every possible combination of platform, browser, extensions, and (sometimes baffling) user behavior would be an impossible task. How do we decide which errors are important? One useful framework for making these frontend development decisions is customer-centric observability.
Rebecca Carter
Modern software development—where code is shipped fast and fixed quickly—simply can’t happen without building observability in before deployments happen. Teams need to see inside the code and CI/CD pipelines before anything ships, because finding problems early makes them easier to fix. And don’t take “easier to fix” lightly: incidents found late not only impact the customer experience (and perhaps their loyalty), but they also hit developer productivity and job satisfaction hard.
Nir Gazit
At Traceloop, we’re solving the single thing engineers hate most: writing tests for their code. More specifically, writing tests for complex systems with lots of side effects, such as this imaginary one, which is still a lot simpler than most architectures I’ve seen.
Phillip Carter
There’s a lot of hype around AI, and in particular, Large Language Models (LLMs). To be blunt, a lot of that hype is just some demo bullshit that would fall over the instant anyone tried to use it for a real task that their job depends on. The reality is far less glamorous: it’s hard to build a real product backed by an LLM.
Jessica Kerr (Jessitron)
Honeycomb recently released our Query Assistant, which uses ChatGPT behind the scenes to build queries based on your natural language question. It’s pretty cool. While developing this feature, our team (including Tanya Romankova and Craig Atkinson) built tracing in from the start, and used it to get the feature working smoothly.
Tesha Richardson
The Honeycomb design team began work on Lattice in early 2021. Over several months, we worked to clean up and optimize typography, color, spacing, and many other product experience areas. We conducted an extensive audit of all components, documenting design inconsistencies and laying the foundation for a sustainable design system. However, a more extensive evaluation and audit were necessary before updating or developing components.
Jamie Danielson
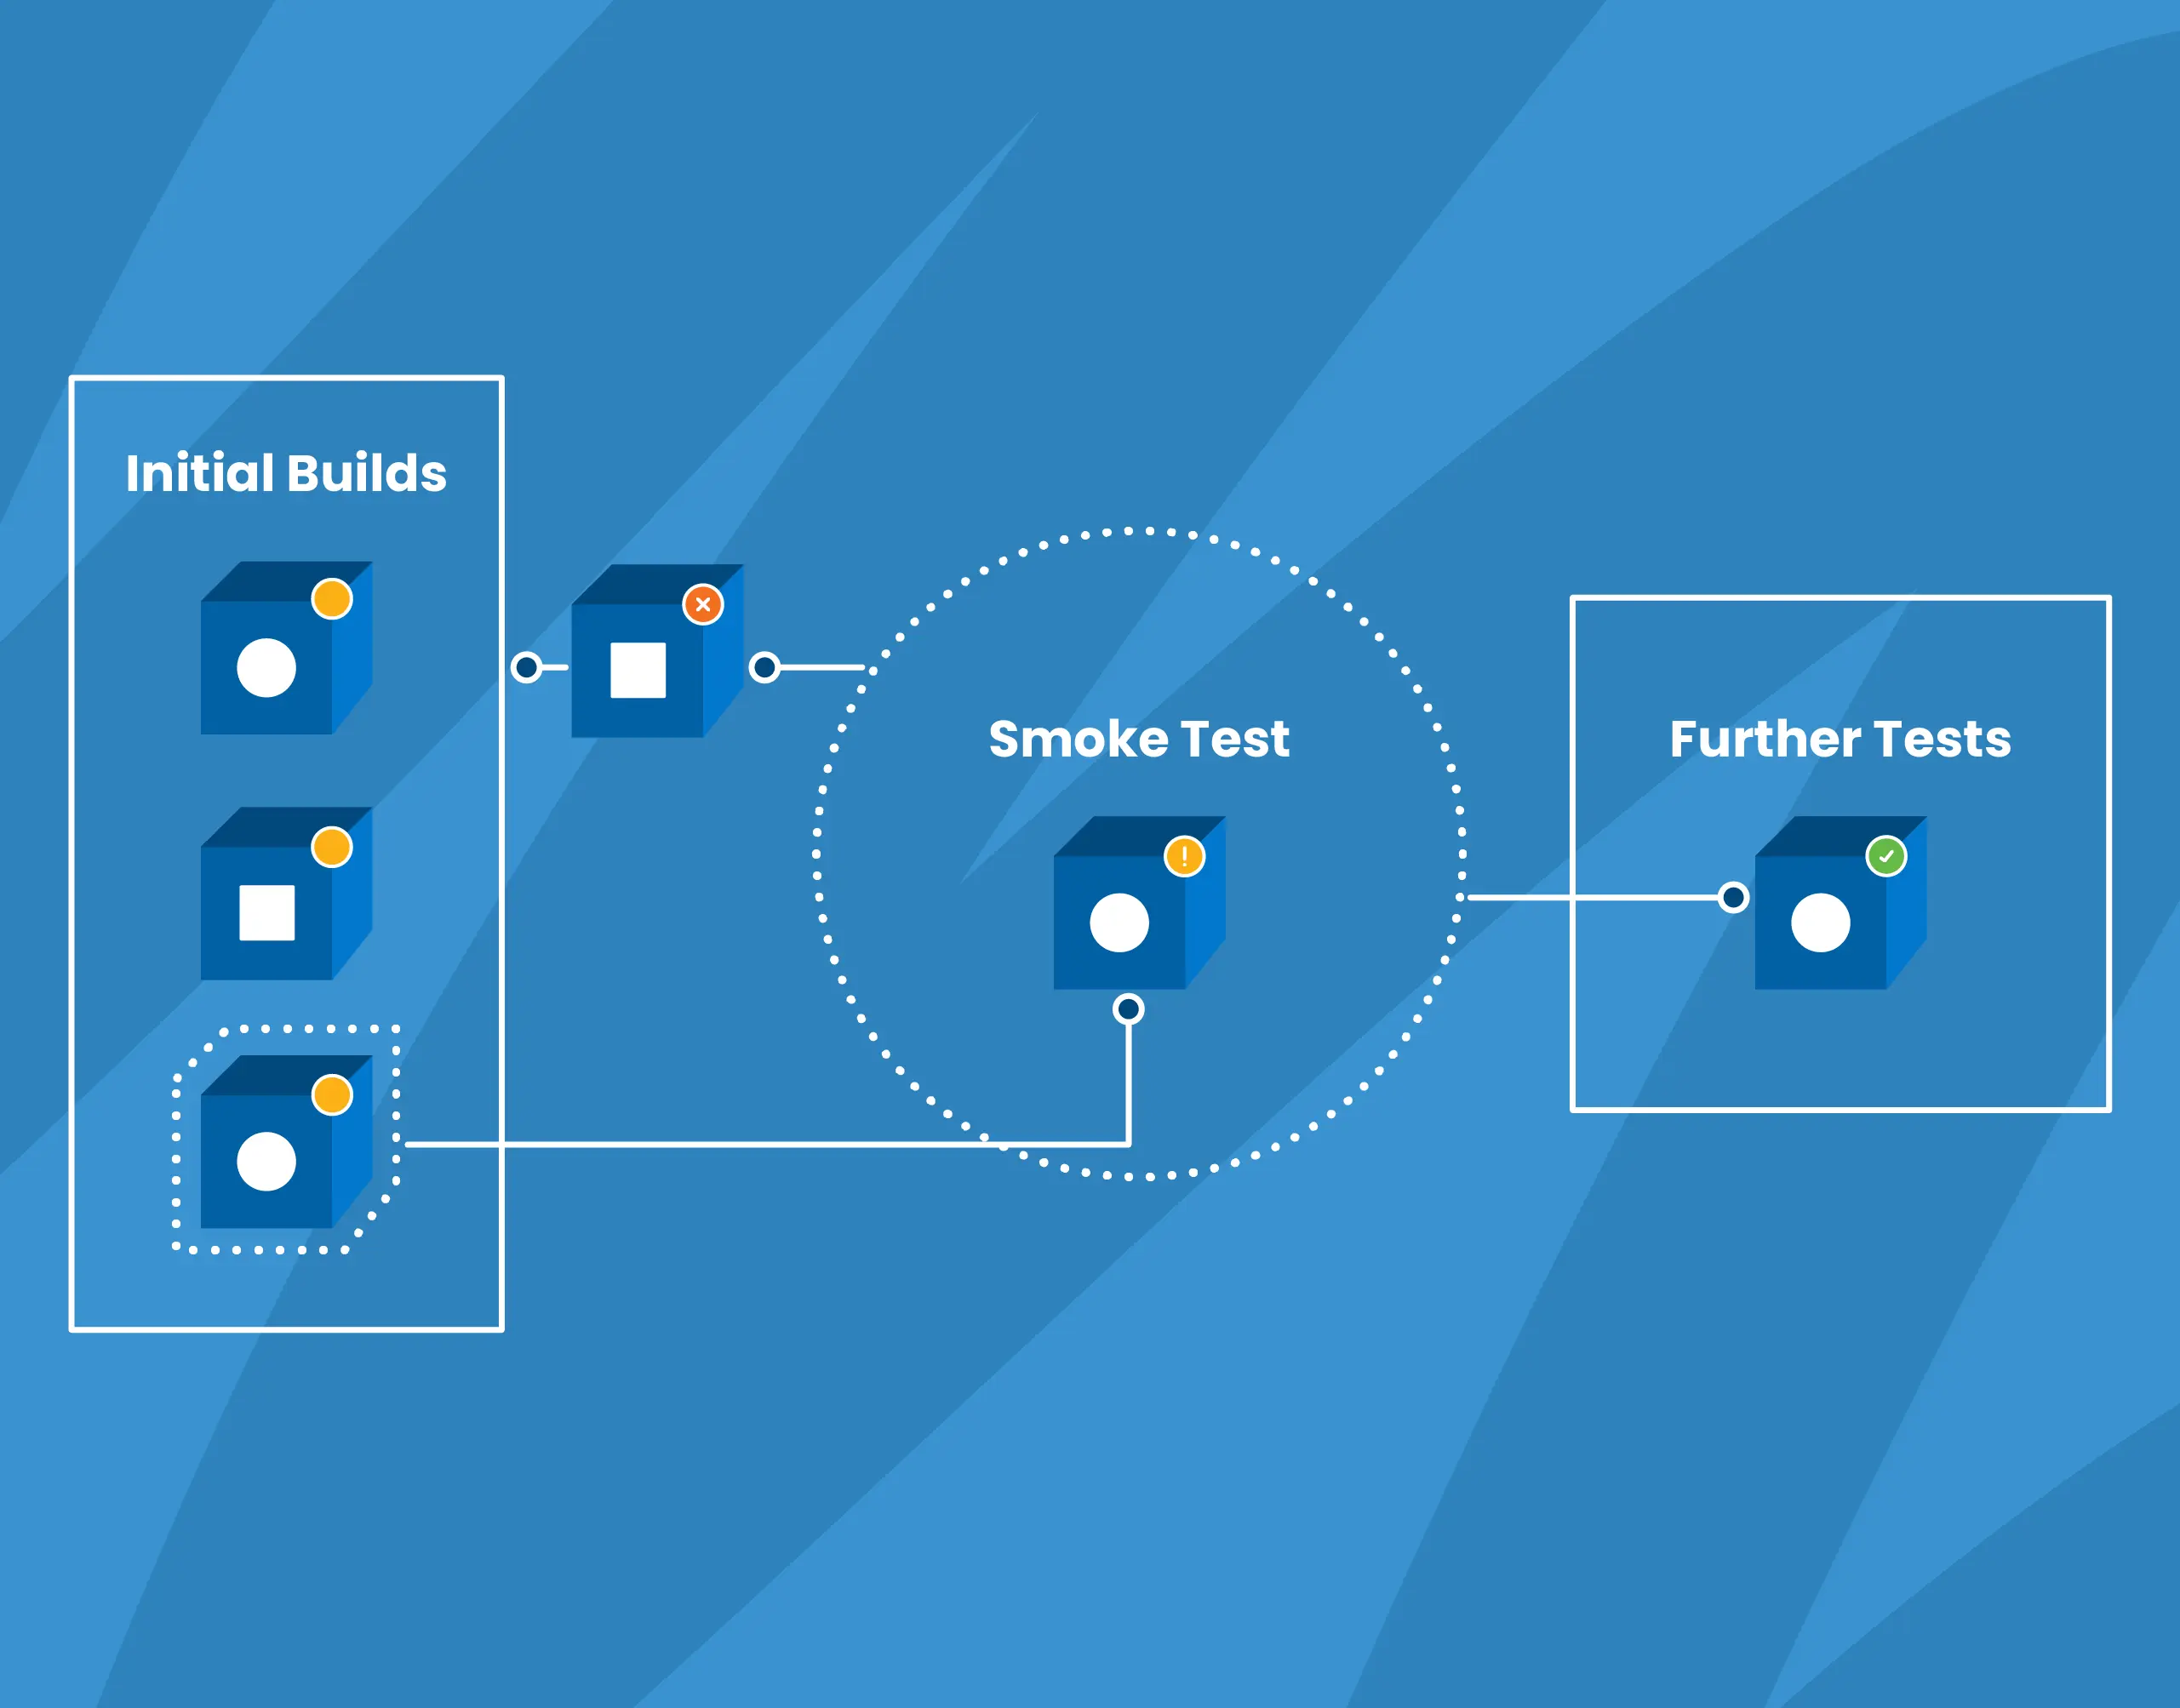
Also known as confidence testing, smoke testing is intended to focus on some critical aspects of the software that are required as a baseline. The term originates in electronic hardware testing; as my colleague Robb Kidd stated, “We want to apply power and see if smoke comes out.” If a smoke test fails, there is almost definitely a problem to address. If it passes, it doesn’t necessarily mean there is no problem, but we can feel confident that the major functionality is okay.
Michael Wilde
A while ago, we added Metrics to our observability platform so teams could easily see system information right next to their application observability data—no tool or team switching required. So how can teams get the most out of metrics in an observability platform? We’re glad you asked! We had this conversation with experts at Heroku. They’ve successfully blended metrics and observability and understand what is most helpful to know. Here are three strategies to maximize the benefits of Honeycomb Metrics.
Martin Thwaites
Dear Miss O11y, I remember reading quite interesting opinions from you about usage of metrics and traces in an application. Did you elaborate on those points in a blog post somewhere, so I can read your arguments to forge some advice for myself? I must admit that I was quite puzzled by your stance regarding the (un)usefulness of metrics compared to traces in apps in some contexts (debugging).
Nick Rycar
You know the old saying, I’m sure: “April deploys bring May joys.” Okay, maybe it doesn’t go exactly like that, but after reading what we’ve been up to for the past month, I think…
Get it delivered straight to your inbox.
By subscribing to our newsletter, you agree to Honeycomb’s Terms of Service and Privacy Notice.
Engineers know best. No machine or tool will ever match the context and capacity that engineers have to make judgment calls about what a system should or shouldn’t do. We built Honeycomb to augment human intuition, not replace it.
Rox Williams
Heatmaps are a beautiful thing. So are charts. Even better is that sometimes, they end up producing unintentional—or intentional, in the case of our happy o11ydays experiment—art.
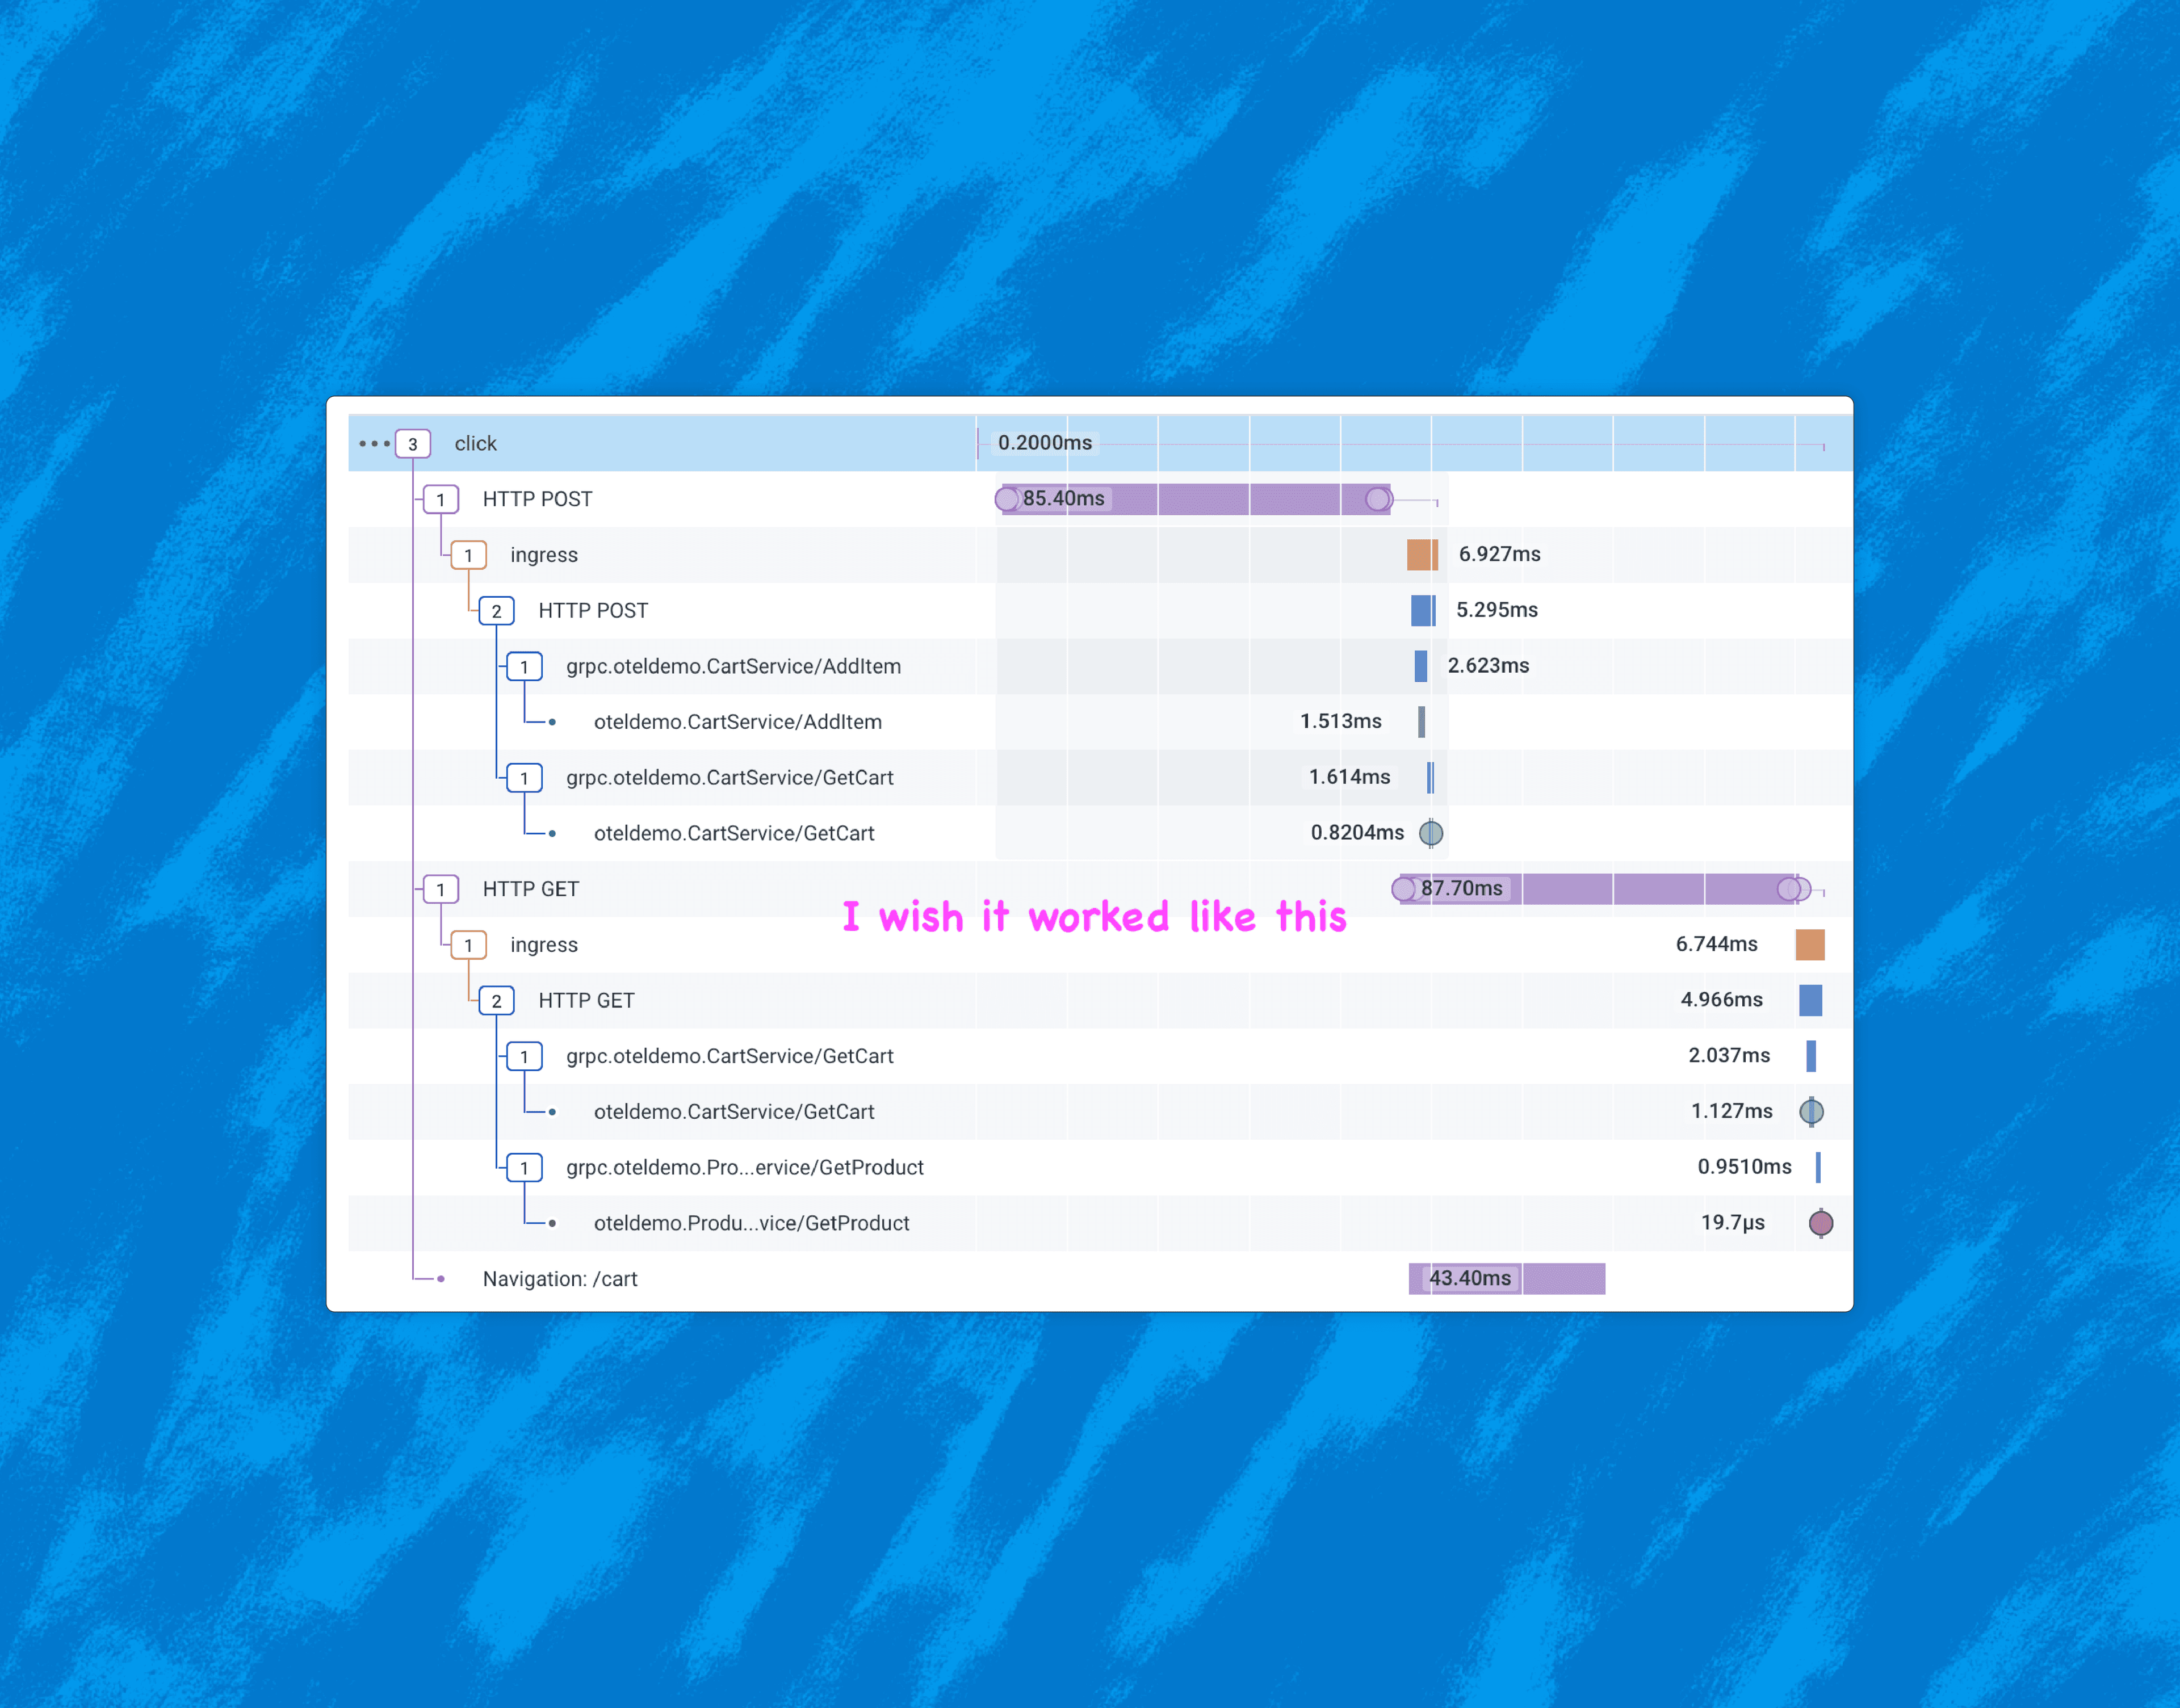
The modern standard for observability in backend systems is: distributed traces with OpenTelemetry, plus dynamic aggregations over these events. This works very well in the world of web servers. But what about the web client?
Lex Neva
At a recent training session, Jeli spent a great deal of time covering incident retrospectives and what makes an incident worthy of studying. My colleague Ben Hartshorne asked a fascinating question, which I’ll paraphrase here: We’ve been talking about what makes an incident interesting, but what about the reverse? Are there aspects of an incident that would make you say, “We probably shouldn’t bother doing a retrospective on this one?”
When your alerts cover systems owned by different teams, who should be on call? We get this question a lot when talking about SLOs. We believe that great SLOs measure things that are close to the user experience. However, it becomes difficult to set up alerting on that SLO, because in any sufficiently complex system, the SLO is going to measure the interaction between multiple services owned by different teams. Therefore, the question becomes: who gets woken up at night when an SLO is burning through its error budget?
George Miranda
Honeycomb’s Deployment Protection Rule for GitHub Actions quickly enables canary deployments by letting you use Honeycomb query results to prevent deploying to your next target environment.
Irving Popovetsky
Refinery, Honeycomb’s tail-based dynamic sampling proxy, often makes sampling feel like magic. This applies especially to dynamic sampling, because it ensures that interesting and unique traffic is kept, while tossing out nearly-identical “boring” traffic. But like any sufficiently advanced technology, it can feel a bit counterintuitive to wield correctly, at first.
We’re in Amsterdam for the week of Kubecon EU. Come by our booth to learn more about how you can gain complete observability into your Kubernetes clusters with Honeycomb and OpenTelemetry. In the meantime, enjoy this OTel update!