Honeycomb was built for the AI era. Learn how to futureproof your software for what comes next.
Discover why Honeycomb is the better choice for your engineers, your customers, and your bottom line.
Start your journey with the definitive guide to observability. Download our complimentary ebook.
Bring observability to every software engineer.
Learn about our company, mission and values.
Come for the impact, stay for the culture.
See Honeycomb's latest press releases, media, and more
Learn more about becoming a Honeycomb partner.
Already a Honeycomb customer?
Fred Hebert
There are limits to what individuals or teams on the ground can do, and while counting fires or their acreage can be useful to know the burden or impact they have, it isn’t a legitimate measure of success. Knowing whether your firefighters or whether your prevention campaigns are useful can’t rely on these high-level observations, because they’ll be drowned in the noise of a messy unpredictable world.
Harrison Calato
George Miranda, Liz Fong-Jones, and Charity Majors, held a series of live discussions called the Authors’ Cut to bring core concepts of the book to life by applying them to real-world use cases. Now that the series is complete, we thought it would be helpful to combine all of the discussion recaps for your viewing pleasure. Each blog post below takes key concepts from chapters in the book and makes them more digestible.
Nick Rycar
We’re here to show you three ways you can jumpstart a distributed tracing effort, starting small and expanding as it makes sense. These examples involve only a little code and perhaps a bit of a mindset change. Starting small with distributed tracing can even be fun, because who doesn’t like getting customized results without much work?
George Miranda
In this post, we’re moving from the foundations of observability to things that become critical when you start practicing observability at scale. Tools like sampling and telemetry pipelines are useful at any size, but when your trickle of observability data suddenly becomes a torrential flood, these tools are essential.
As 2022 draws to a close, the Honeycomb team is getting ready to take some time to recharge our collective batteries and get ready for the new year. For some of us, that means spending some well-earned time away from our keyboards. For others, it means we get to spend our computer time doing something just for fun.
Guest Blogger
Bugs can remain dormant in a system for a long time, until they suddenly manifest themselves in weird and unexpected ways. The deeper in the stack they are, the more surprising they tend to be. One such bug reared its head within our columnar datastore in May this year, but had been present for more than two years before detection.
Today, we’re announcing the expansion of Honeycomb integrations with various AWS services. This update now covers a much wider swath of AWS services, makes it easier than ever to integrate your AWS stack with Honeycomb, and with our new BubbleUp enhancements, you’ll be identifying and debugging hidden issues in your AWS stack faster than ever.
Lex Neva
I joined Honeycomb as a Staff Site Reliability Engineer (SRE) midway through September, and it’s been a wild ride so far. One thing I was especially excited about was the opportunity to see Honeycomb’s incident retrospective process from the inside. I wasn’t disappointed!
Nathan Lincoln
With the introduction of Environments & Services, we’ve seen a dramatic increase in the creation of new datasets. These new datasets are smaller than ones created with Honeycomb Classic, where customers would typically place all of their services under a single, large dataset. This change has presented some interesting scaling challenges, which I’ll detail in this post, along with the solution we used, and how we leveraged Honeycomb’s own telemetry to scale Honeycomb.
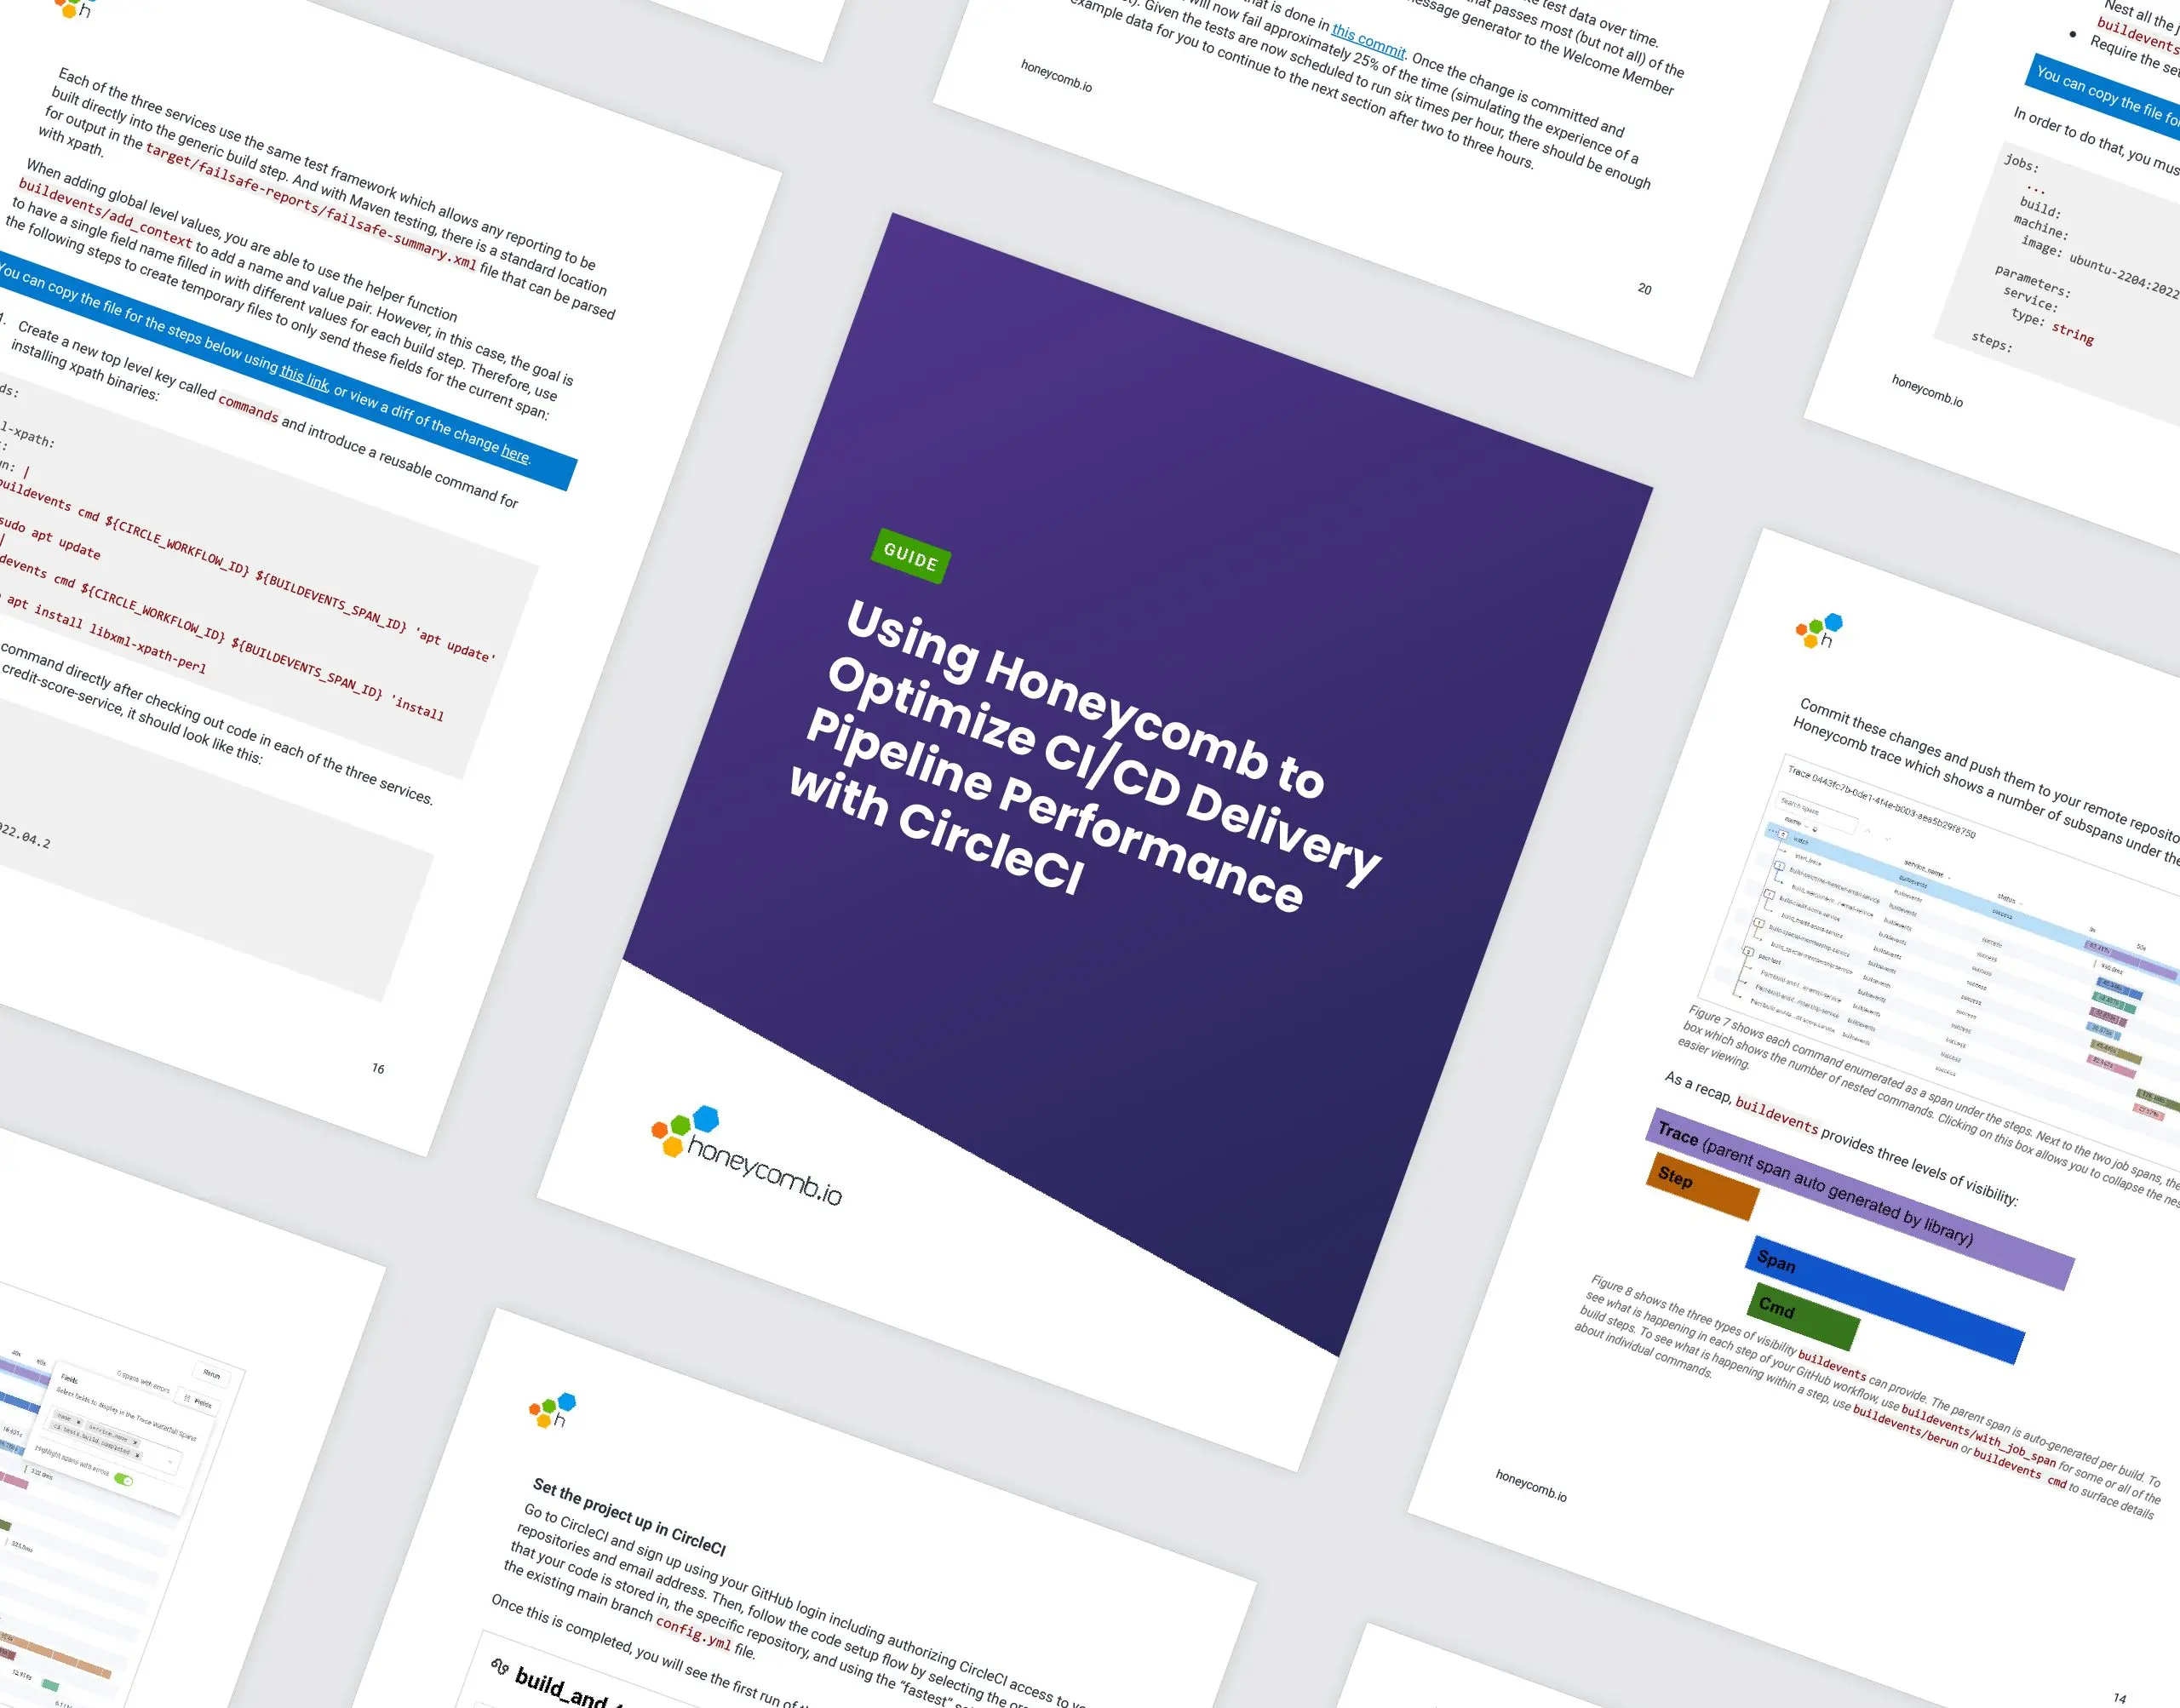
If you’re writing software today, then you likely use a CI/CD pipeline to build and test your code before deploying it to production. Having a fast and efficient build pipeline saves you development time, shortens feedback loops, and helps you ship features faster. Conversely, slow and unreliable build pipelines are full of lost productivity and sadness.
In our Feature Focus October 2022, we’ve updated documentation and derived columns, provided guides to make CI/CD easier, and more.
Reid Savage
One of the things that struck me upon joining Honeycomb was the seemingly laissez-faire approach we took towards internal SLOs. From my own research (beginning with the classic SRE book, following Google’s example), I came to these conclusions: -SLOs are strict. They aren’t as binding as an SLA, but burning through your error budget is bad. -SLOs/SLIs need to be documented somewhere, with a formal specification, and approved by stakeholders. -SLOs should drive customer-level SLAs. -Teams should be mandated to create a minimum number of SLOs for the services they own.
Get it delivered straight to your inbox.
By subscribing to our newsletter, you agree to Honeycomb’s Terms of Service and Privacy Notice.
Martin Thwaites
In the last few years, the usage of databases that charge by request, query, or insert—rather than by provisioned compute infrastructure (e.g., CPU, RAM, etc.)—has grown significantly. They’re popular for a lot of the same reasons that serverless compute functions are, as the cost will scale with your usage. No one is using your site? No problem: you’re not charged.
Wren Walker
It may surprise you to hear, but Honeycomb doesn’t currently have a platform team. We have a platform org, and my title is Director of Platform Engineering. We have engineers doing platform work. And, we even have an SRE team and a core services team. But a platform team? Nope. I’ve been thinking about what it might mean to build a platform team up from scratch—a situation some of you may also be in—and it led me to asking crucial questions.
Liz Fong-Jones
Recently, Honeycomb held a roundtable discussion (available on demand) with Camal Cakar, Senior Site Reliability Engineer at Jimdo; Pierre Lacerte, Director of Software Development at Upgrade; and Kristin Smith, DevOps Engineer at Campspot. We talked about using OpenTelemetry and explained some important lessons the panelists learned—and are still learning in some cases. Here are five best practices based on these lessons and Honeycomb’s own experience with OpenTelemetry.
Christine Yen
As long as humans have written software, we’ve needed to understand why our expectations (the logic we thought we wrote) don’t match reality (the logic being executed). To that end, we developed techniques to help measure reality—logging text strings, or capturing aggregated metrics—and persevered, seeking out newer and fancier logging or monitoring solutions over the intervening decades.
Today, we’re announcing the launch of Honeycomb Service Map. This isn’t your grandparent’s version of a service map. This feature reimagines what it is that you want to know or investigate when looking at visualizations of how your services communicate with one another.
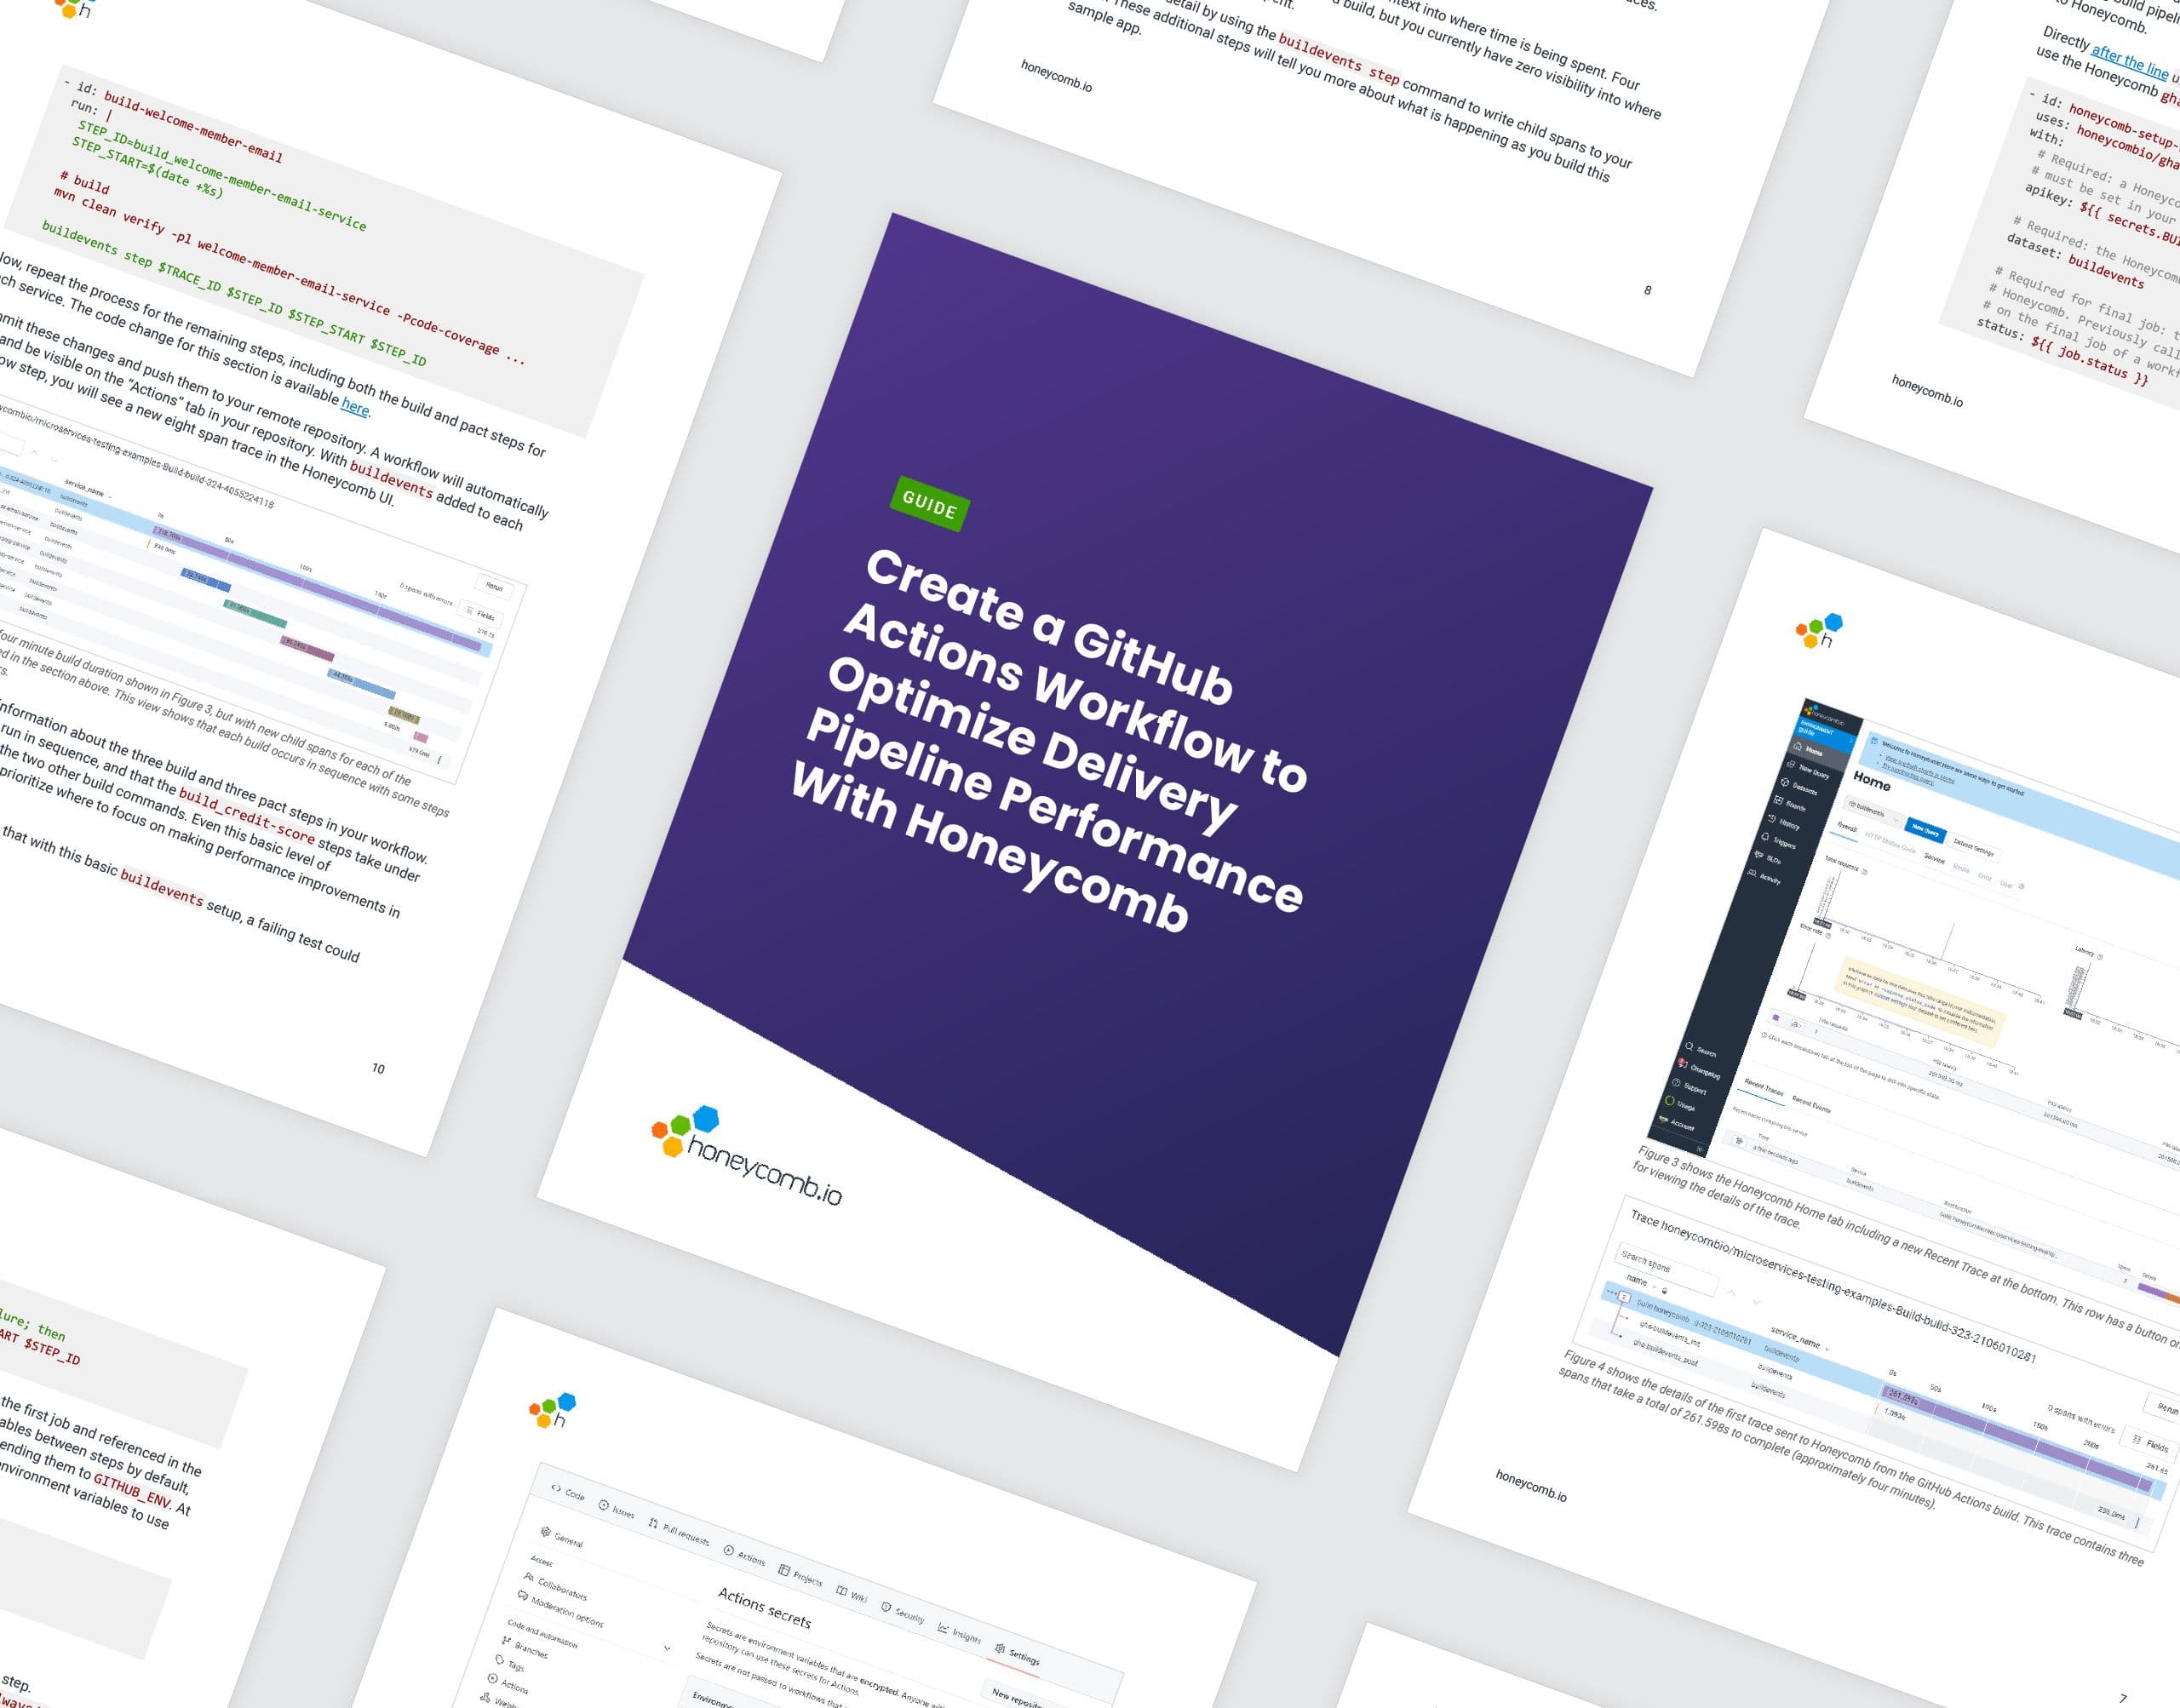
If you build or maintain code in GitHub, the Honeycomb Buildevents Action can help you optimize the performance of your build pipelines in GitHub Actions. This blog introduces you to the gha-buildevents Action and a new hands-on quickstart guide that will show you the inner workings of GitHub Actions workflows, the buildevents tool, and the Honeycomb UI.
Michael Sickles
Getting existing telemetry into Honeycomb just got easier! With the release of the Datadog APM Receiver, you can send your Datadog traces to the OpenTelemetry Collector, and from there, to any OpenTelemetry-compatible endpoint.
Matt Ransford
Network topology can get very complicated in the cloud, especially when you’re sending data to external SaaS providers. You will likely need to configure gateways and firewalls and keep close tabs on those points of egress. However, if your infrastructure exists within AWS, there’s a much simpler way and that’s through an AWS PrivateLink endpoint.