Honeycomb was built for the AI era. Learn how to futureproof your software for what comes next.
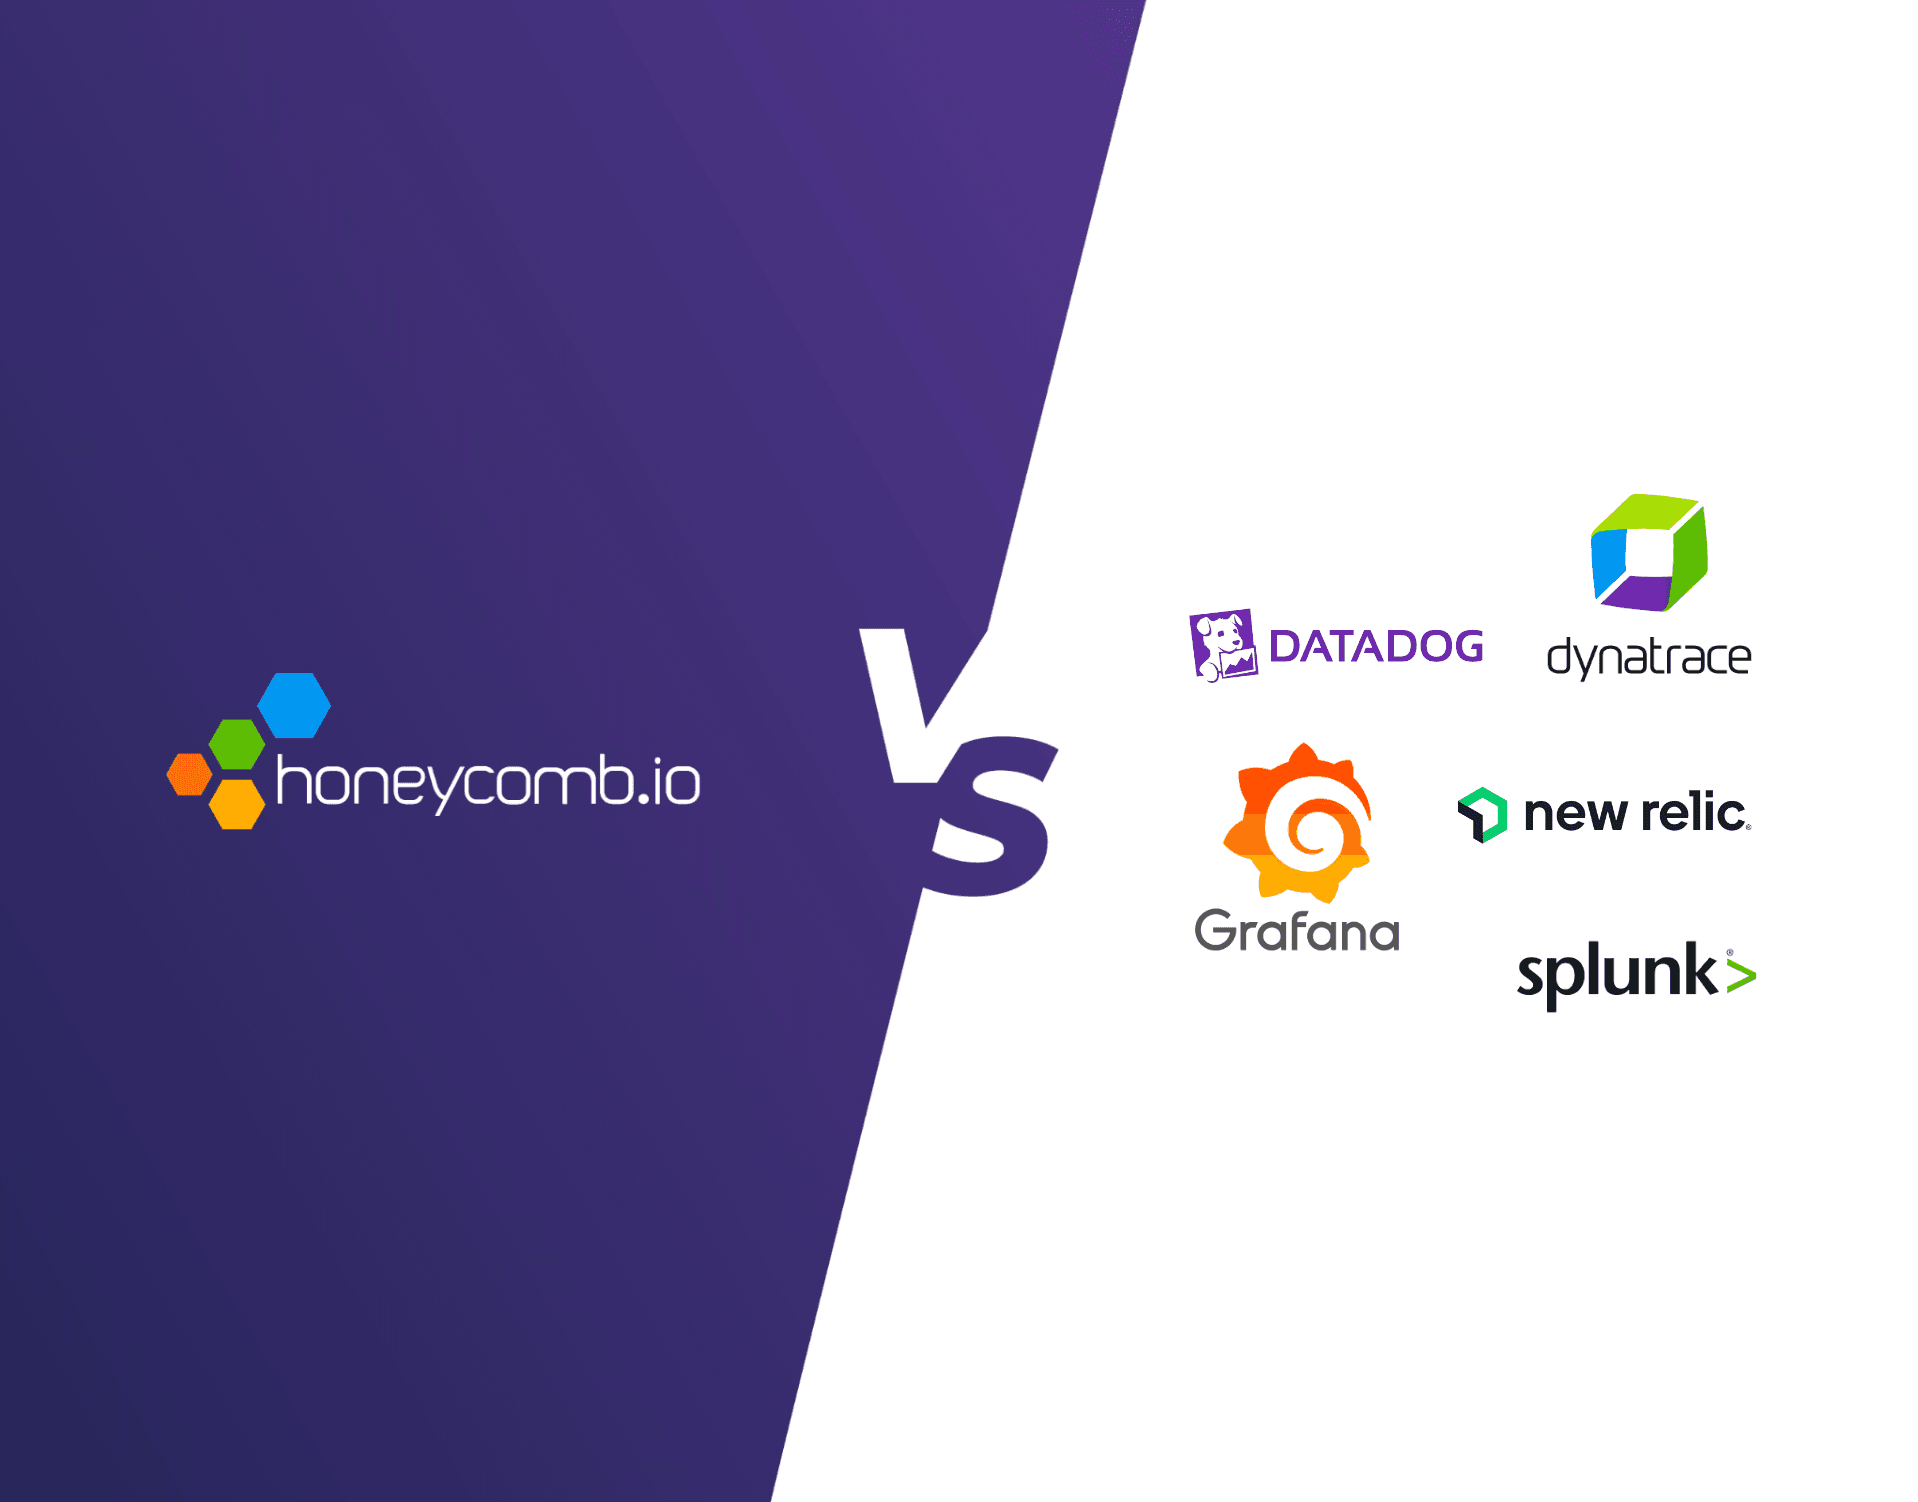
Discover why Honeycomb is the better choice for your engineers, your customers, and your bottom line.
Start your journey with the definitive guide to observability. Download our complimentary ebook.
Bring observability to every software engineer.
Learn about our company, mission and values.
Come for the impact, stay for the culture.
See Honeycomb's latest press releases, media, and more
Learn more about becoming a Honeycomb partner.
Already a Honeycomb customer?
Martin Thwaites
Naming things, and specifically consistently naming things, is still one of the most useful pieces of work you can do in telemetry. It’s often overlooked as something that will just happen naturally and won’t cause too much of an issue—but it doesn’t happen naturally, it does cause issues, and you end up having to fix the data in pipelines or your backend tool.
Chris Lasher
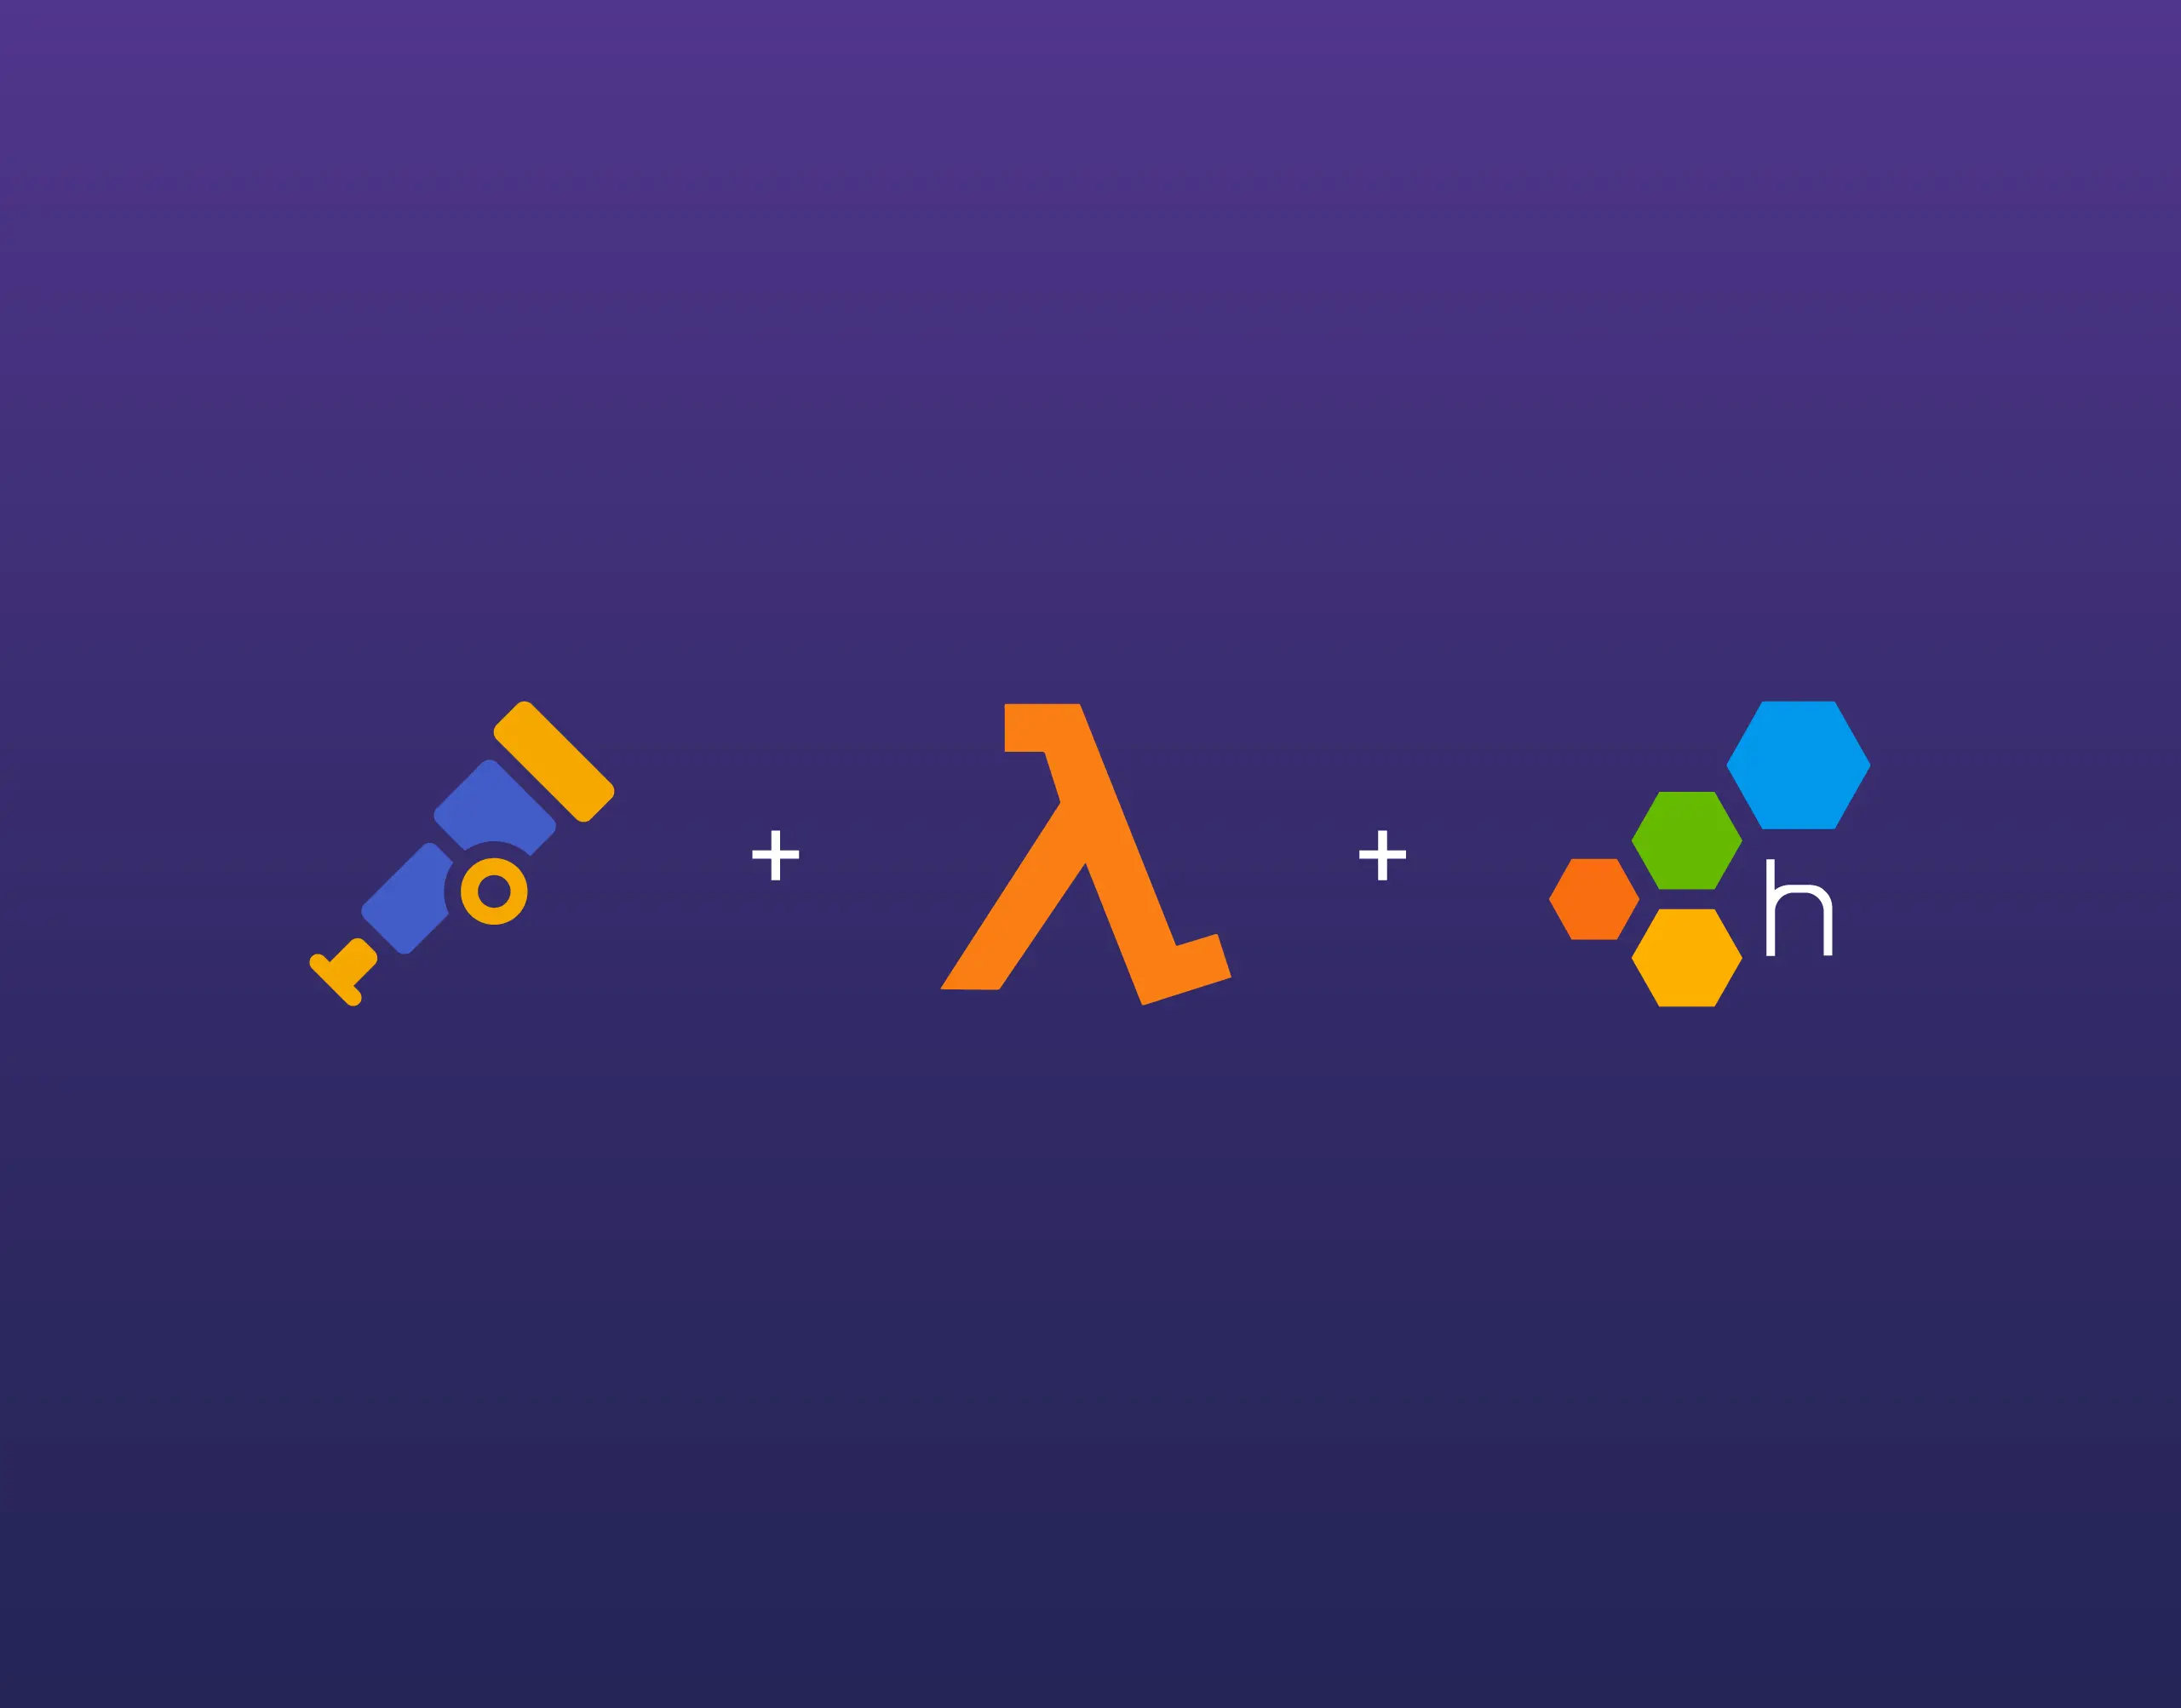
In this post, Chris describes how to send OpenTelemetry (OTel) data from an AWS Lambda instance to Honeycomb.
Fred Hebert
There are countless challenges around incident investigations and reports. Aside from sensitive situations revolving around blame and corrections, tricky problems come up when having discussions with multiple stakeholders. The problems I’ll explore in this blog—from the SRE perspective—are about time pressures (when to ship the investigation) and the type of report people expect.
Alex Boten
There is so much good work that OpenTelemetry has done in the software industry, specifically around the domain of observability, in the last five years. Bringing users and vendors together to define the future of telemetry? Check! Unify logs, traces, and metrics under a completely vendor-neutral API? Check! Deprecate other standards by bringing their collaborators to the table to ensure their use cases are met? CHECK!
Jessica Kerr (Jessitron)
In twenty years of software development, I did not have the privilege of being on call, of tending to my software in production. I’ve never understood what “APM” means. Anybody can tell me what it stands for—Application Performance Monitoring (or sometimes, the M means Management)—but what does it mean? What do people use APM for? Now, I work at an observability company—and still, no one can give me a satisfying definition of “APM.” So I did some research, and now the use of APM makes sense from a few angles.
Phillip Carter
Back in May 2023, I helped launch my first bona fide feature that uses LLMs in production. It was difficult in lots of different ways, but one thing I didn’t elaborate in several blog posts was how lucky I was to have a coherent way to get the data I needed to make the feature useful for users.
Jason Harley
We’re delighted to introduce our new Ingest API Keys, a significant step toward enabling all Honeycomb customers to manage their observability complexity simply, efficiently, and securely. Ingest Keys are currently available for Environment & Services customers, with Classic support and programmatic key management capabilities under development and coming soon!
Austin Parker
In today’s economic and regulatory environment, data sovereignty is increasingly top of mind for observability teams. The rules and regulations surrounding telemetry data can often be challenging to interpret, leaving many teams in the dark about what kind of data they can capture, how long it can be stored, and where it has to reside.
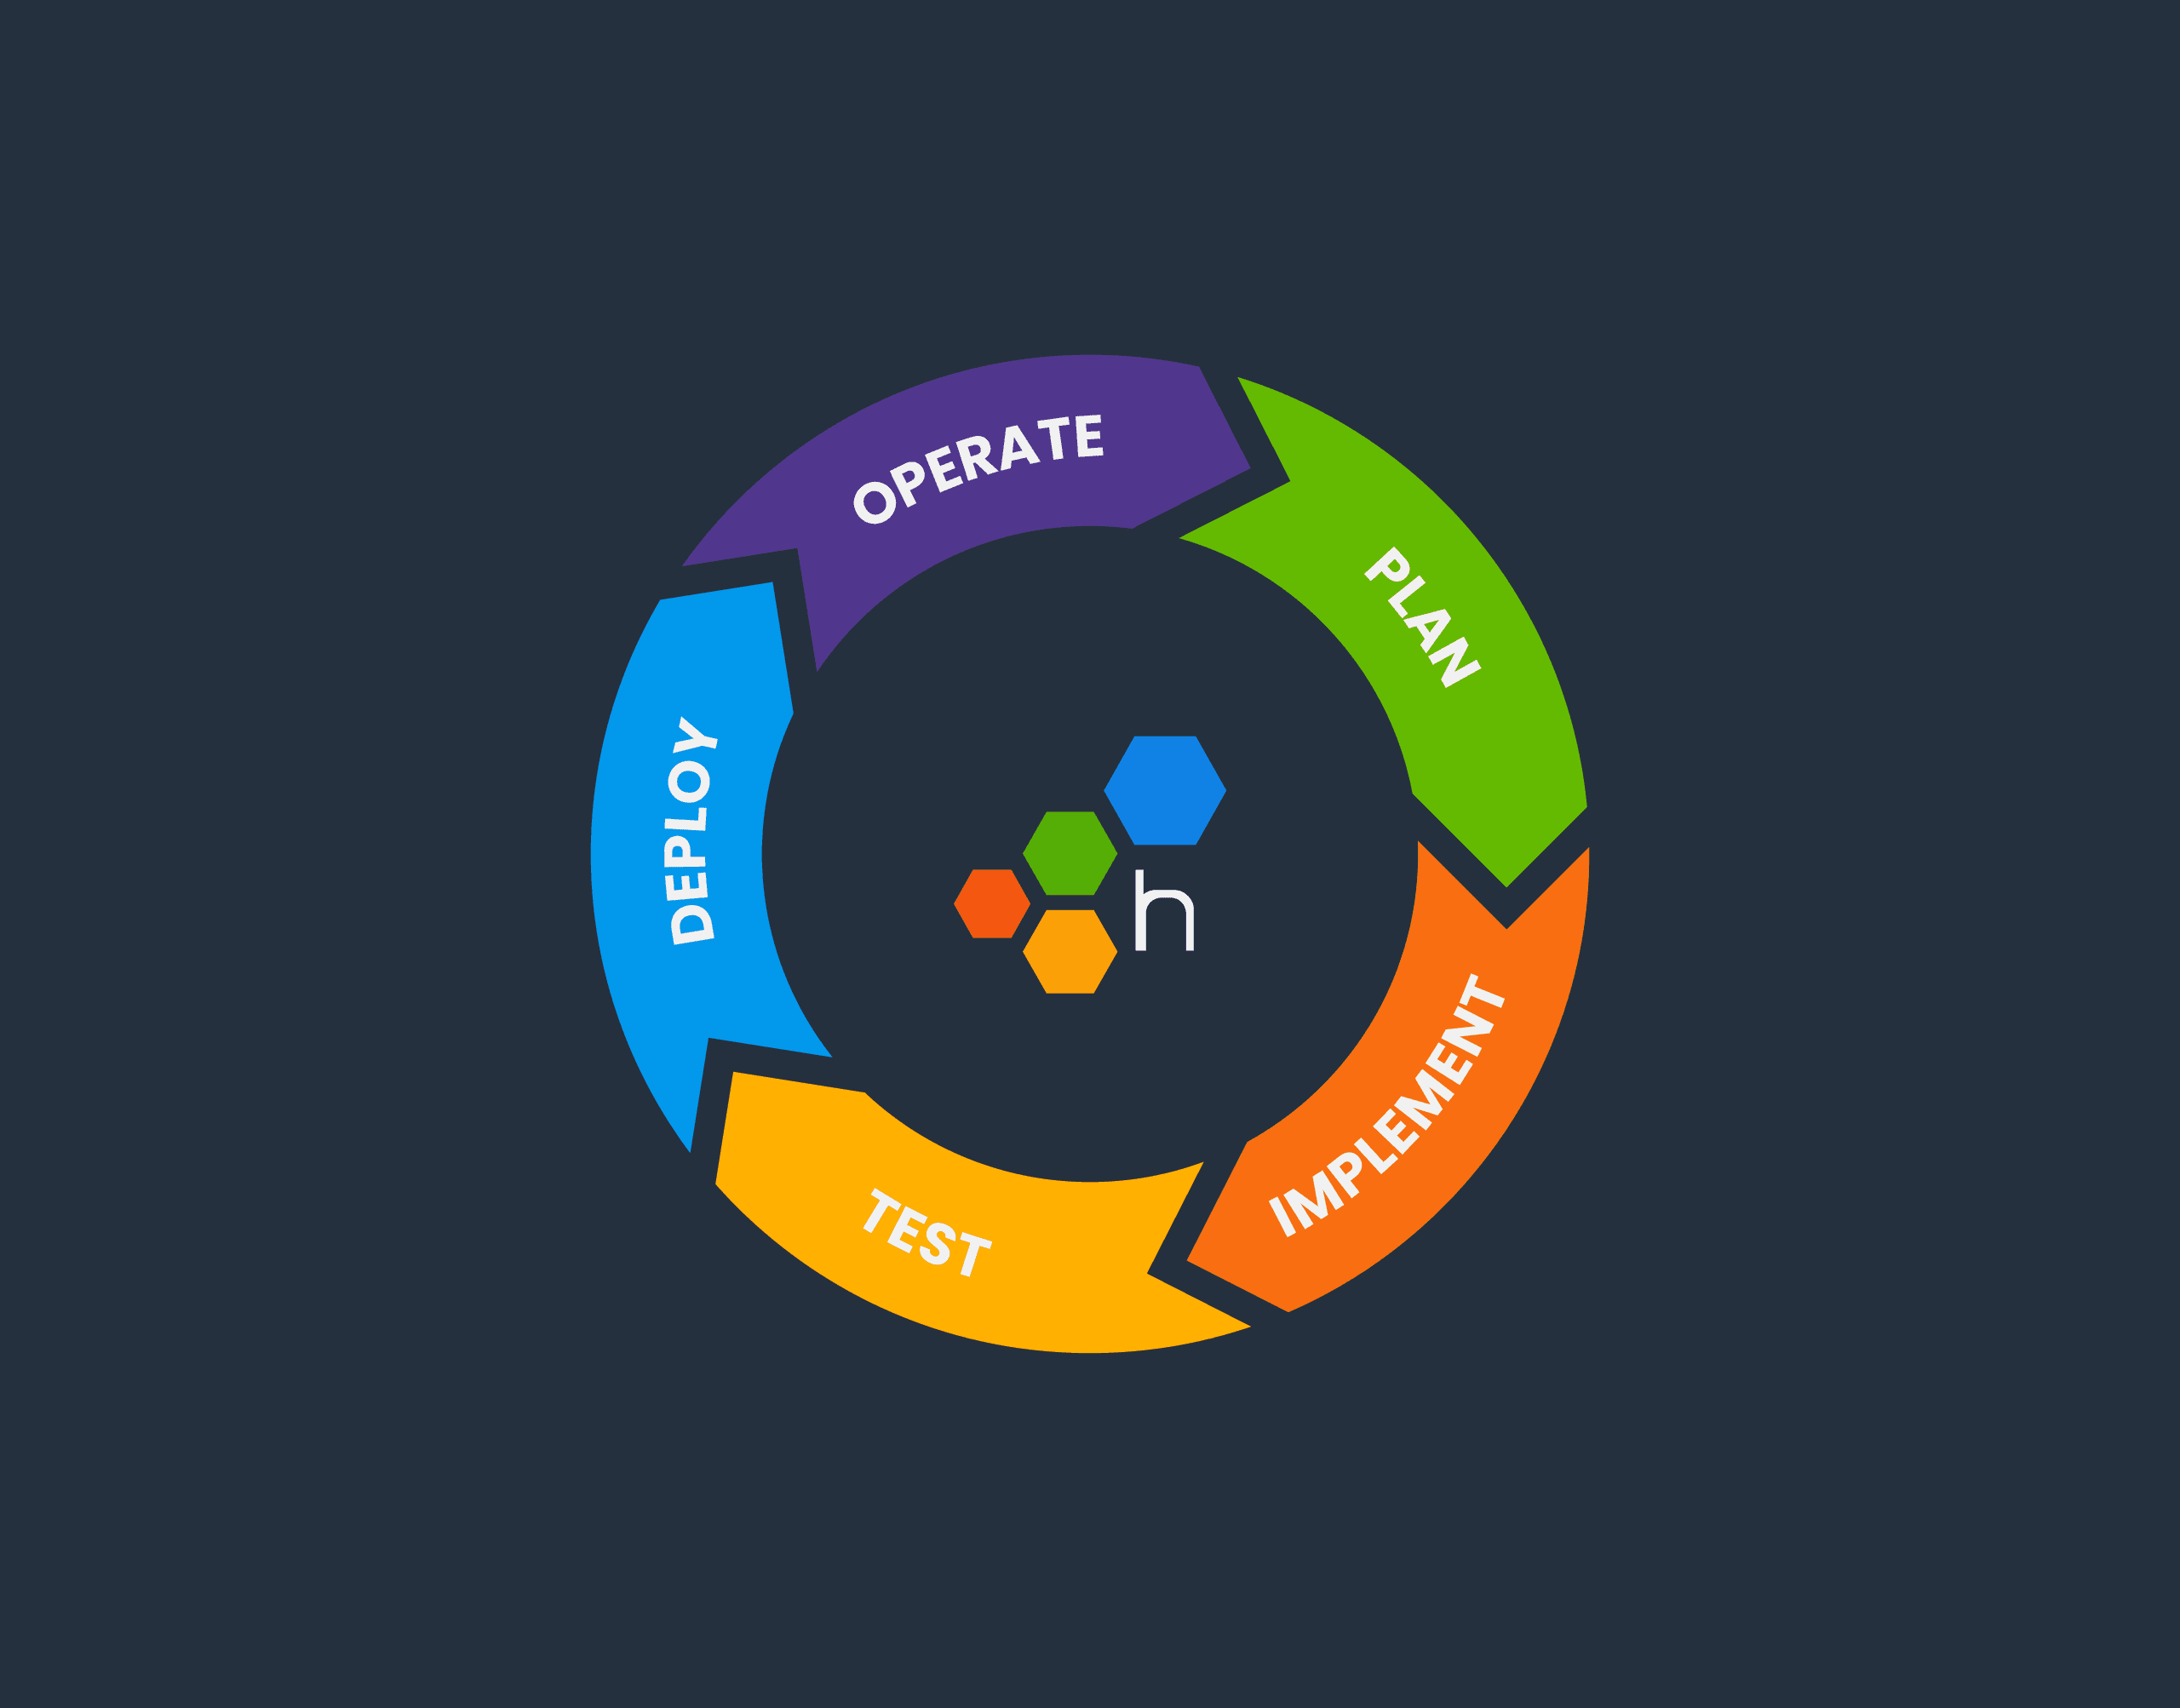
The software development lifecycle (SDLC) is always drawn as a circle. In many places I’ve worked, there’s no discernable connection between “5. Operate” and “1. Plan.” However, at Honeycomb, there is.
Mike Terhar
When you have questions about your software, telemetry data is there for you. Over time, you make friends with your data, learning what queries take you right to the error you want to see, and what graphs reassure you that your software is serving users well. You build up alerts based on those errors. You set business goals as SLOs around those graphs. And you find the balance of how much telemetry to sample, retaining the shape of important metrics and traces of all the errors, while dropping the rest to minimize costs.
Rox Williams
At Honeycomb, we are very concerned about privacy and data sovereignty—it’s something we take very seriously, and in an effort to serve our customers better, we’re thrilled to announce that we now offer data residency in Europe.
Charity Majors
The cost of services is on everybody’s mind right now, with interest rates rising, economic growth slowing, and organizational budgets increasingly feeling the pinch. But I hear a special edge in people’s voices when it comes to their observability bill, and I don’t think it’s just about the cost of goods sold. I think it’s because people are beginning to correctly intuit that the value they get out of their tooling has become radically decoupled from the price they are paying.
Get it delivered straight to your inbox.
By subscribing to our newsletter, you agree to Honeycomb’s Terms of Service and Privacy Notice.
Good alerting hygiene consists of a few components: chasing down alert conditions, reflecting on incidents, and thinking of what makes a signal good or bad. The hope is that we can get our alerts to the stage where they will page us when they should, and they won’t when they shouldn’t. However, the reality of alerting in a socio-technical system must cater not only to the mess around the signal, but also to the longer term interpretation of alerts by people and automation acting on them. This post will expand on this messiness and why Honeycomb favors an iterative approach to setting our alerts.
Jeremy Blythe
There’s plenty of literature on the mechanics of instrumenting code with OpenTelemetry and delivering it to Honeycomb. However, I’ve not found many guides on the craft of instrumenting code in order to have a good observability experience in your system. A lot of focus is placed on automatic instrumentation—which is great, particularly if you’re new to observability or retrofitting—but it misses the power of good instrumentation at the application level.
Cat Litten
Picture this: It’s 2 p.m. and you’re sipping on coffee, happily chugging away at your daily routine work. The security team shoots you a message saying the latest pentest or security scan found an issue that needs quick remediation. On the surface, that’s not a problem and can be considered somewhat routine, given the pace of new CVEs coming out. But what if you look at your tooling and find it lacking when you start remediating the issue?
The OpenTelemetry Collector is a core part of telemetry pipelines, which makes it one of the parts of your infrastructure that must be as secure as possible. The general advice from the OpenTelemetry teams is to build a custom Collector executable instead of using the supplied ones when you’re using it in a production scenario. However, that isn’t an easy task, and that prompted me to build something.
Fahim Zaman
For developers, understanding the performance of shipped code is crucial. Through the last decade, a tablestake function in software monitoring and observability solutions has been to save and track app metrics. Engineers love tools that get out of your way and just work, and the appeal of today’s best-in-class application performance monitoring (APM) suites lies in a seamless day zero experience with drop-in agent installs, button click integrations, and immediate metrics collection. However, the success of no-hassle metrics comes with a caveat—the internet is replete with examples of premiere application monitoring costs spiraling beyond expectations.
Winston Hearn
I’ve been thinking about a risk that—if I’m not careful—could severely hinder my team’s ability to ship on time, celebrate success, and continue work after launch: burnout. I don’t see burnout mentioned often when the work of product management is discussed, but I believe it should be taken much more seriously.
In a keynote at AI.Dev, Robert Nishihara (CEO, Anyscale) described the shift: A year ago, the people working with ML models were ML experts. Now, they’re developers. A year ago, the process was to experiment with building a model, then put a product on top of it. Now, it’s ship a product, find the market fit, then create customized models.
Natalie Friedman
Today marks an exciting milestone at Honeycomb, and we’re thrilled to share it with you. We officially launched our integration with Microsoft Teams, a step forward in our continuous effort to streamline and enhance your observability experience. Teams now joins our growing list of over 100 Honeycomb integrations.