Honeycomb was built for the AI era. Learn how to futureproof your software for what comes next.
Discover why Honeycomb is the better choice for your engineers, your customers, and your bottom line.
Start your journey with the definitive guide to observability. Download our complimentary ebook.
Bring observability to every software engineer.
Learn about our company, mission and values.
Come for the impact, stay for the culture.
See Honeycomb's latest press releases, media, and more
Learn more about becoming a Honeycomb partner.
Already a Honeycomb customer?
Phillip Carter
Learn how Jimdo, Upgrade, and Campspot benefited from OpenTelemetry, whether in improved performance, or by avoiding vendor lock-in.
Nick Travaglini
Part of understanding a complex, distributed software system as a socio-technical system means taking seriously that the signals the stewards receive aren’t just chatter.
Martin Thwaites
Let’s dig into what we mean by an Availability Check and how that maps to observability, tracing, and supporting production systems.
In this post, we’ll look at how to host the OpenTelemetry Collector in Azure Container Apps. There are a few gotchas with how it’s deployed, so hopefully this will stop you from hitting the same issues.
Fred Hebert
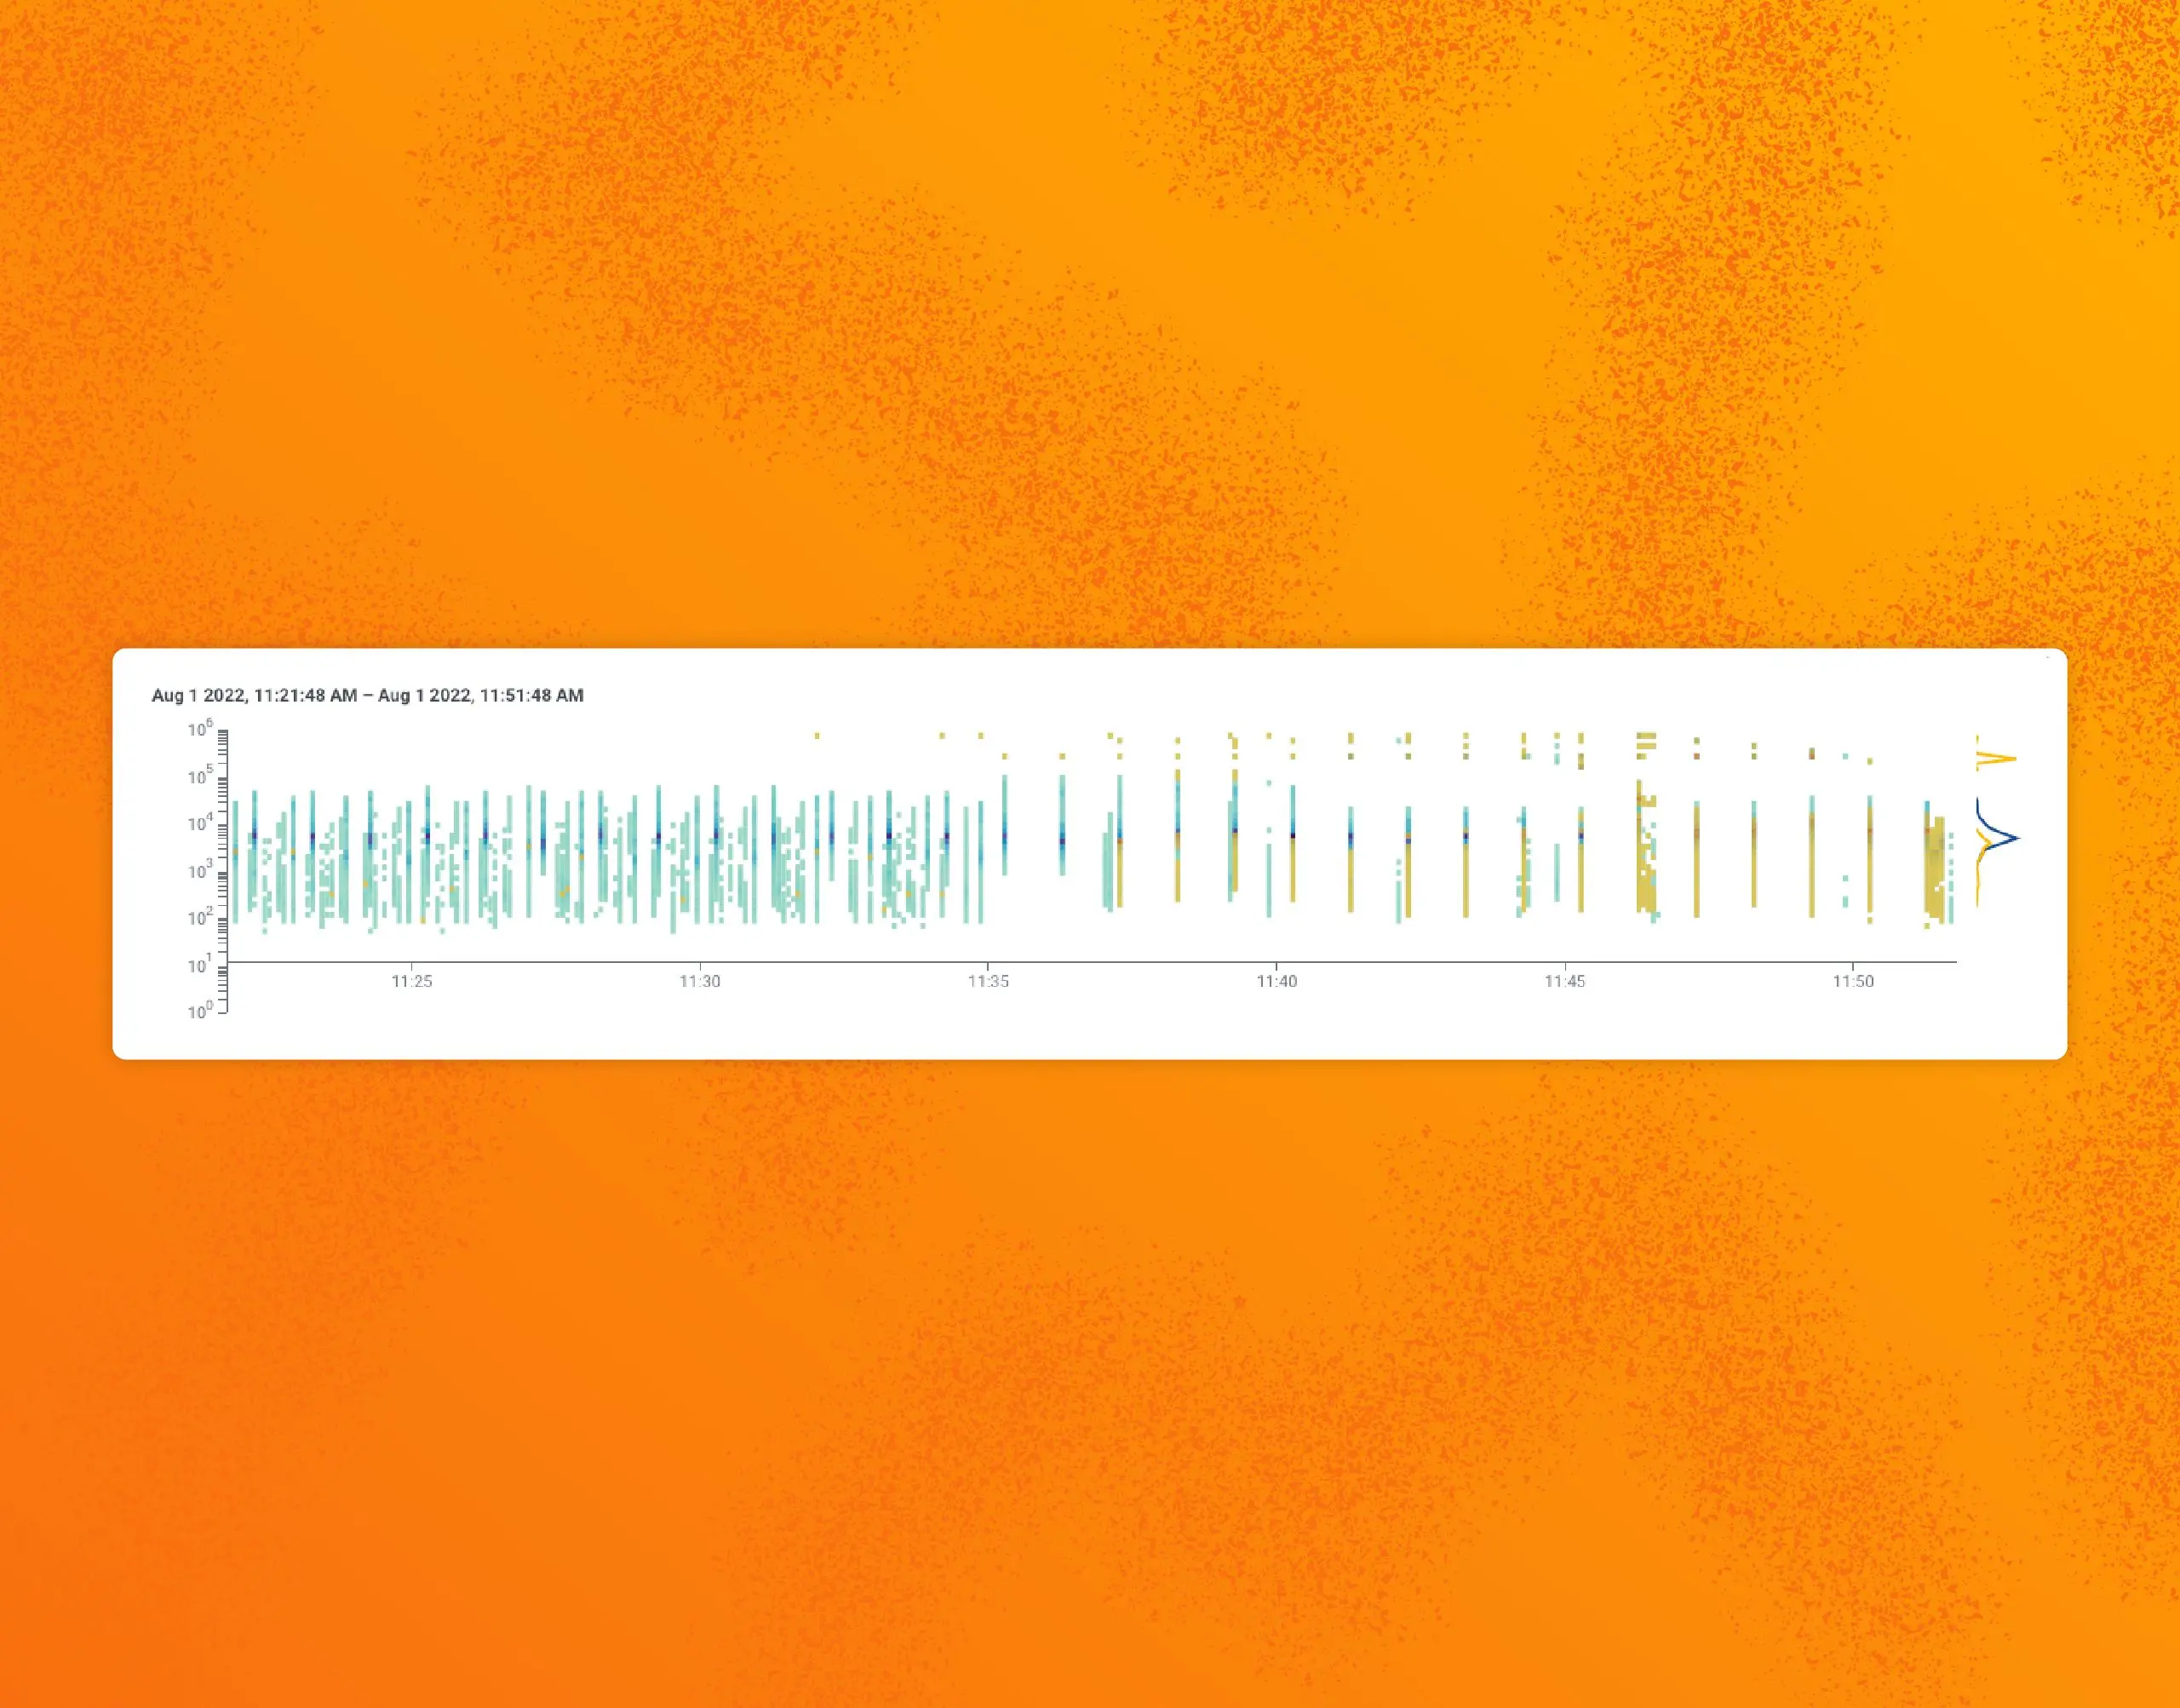
A few weeks ago, we had a couple of incidents that ended up impacting query performance and alerting via triggers and SLOs. These incidents were notable because of how challenging their investigation turned out to be. In this review, we’ll go over interesting patterns associated with growth, and complex systems—and how these patterns challenged our operations.
Guest Blogger
You use NGINX as a proxy for your application, and you want to leverage Honeycomb’s amazing features to help make sense of the traffic data. Have no fear: Honeycomb has a solution just for you.
George Miranda
Today, we’re announcing major new updates to Honeycomb’s PagerDuty integration. These updates put more of the information you need into PagerDuty notifications and allow for greater configurability. These enhancements are available to all users who leverage Honeycomb Triggers and Burn Alerts to send notifications via PagerDuty.
Liz Fong-Jones
Just like any aspect of development, poor integration, invisible bottlenecks, and bugs can plague your CI/CD pipelines. And debugging them? Well, it’s complicated. To see what I mean, just fire up your favorite search engine to find content on “debugging CI/CD pipelines.” Look at all the different tools, studios, and blogs full of advice—it’s soul crushing.
Nick Rycar
Feature Focus: August 2022. Here’s a look at improvements we’ve made to Honeycomb in August, including: better filtering capabilities, derived columns editor, and a new copy button.
Jessica Kerr (Jessitron)
“Dear Miss O11y, I’ve been following Honeycomb for a long time, and I understand where the insights from observability fit in. But larger orgs haven’t experienced this yet. When you’re talking to a C-level executive or director, how do you speak to this? What success stories do you cite that have traction at this level?”
We’ve got a lot of OpenTelemetry-flavored honey to send your way, ranging from OpenTelemetry SDK distribution updates to protocol support. We now support OpenTelemetry logs, released a new SDK distribution for OpenTelemetry Go, and have some updates around OpenTelemetry + Honeycomb to share. Let’s see what all the buzz is about this time!
Sasha Sharma
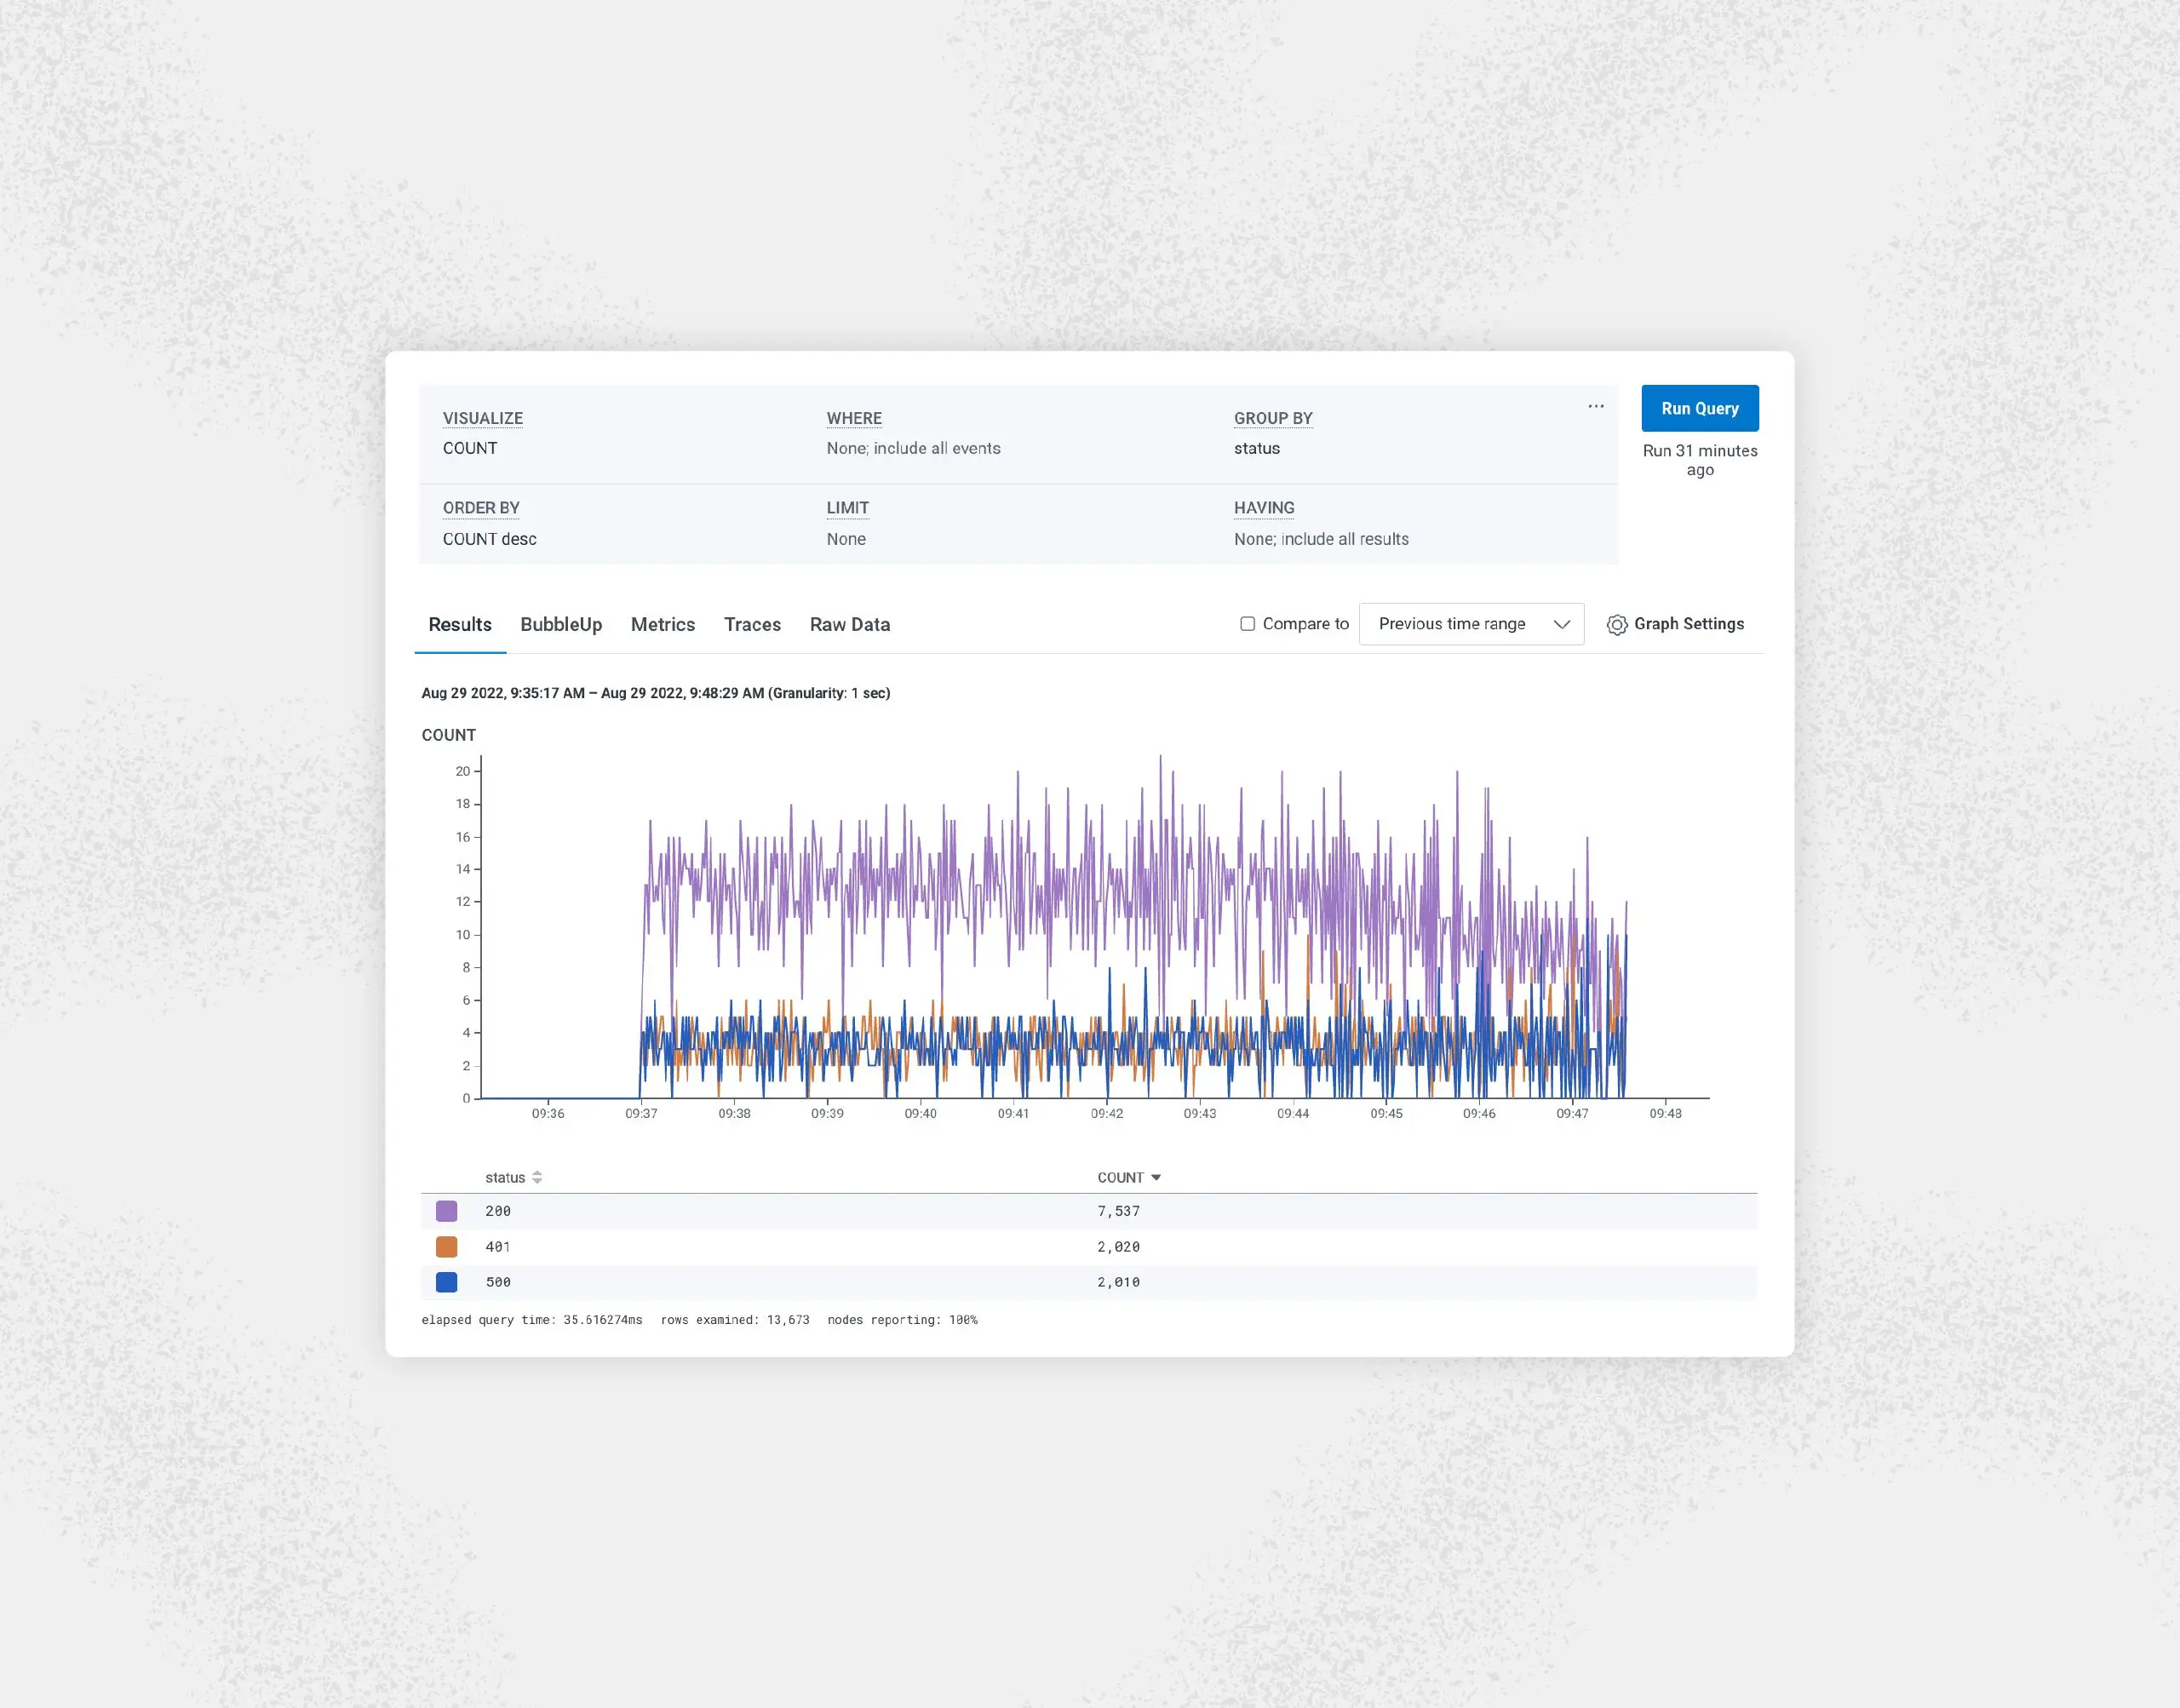
Someone once described dashboards to me as “expensive TV for software engineers.” At first, I stood there quietly shocked—dashboards had informed many root cause analyses (RCAs) in my life as a developer. Dashboards can be expensive TV—and sometimes even harmful false cocoons of safety (“Uh, p90 looks okay 🤷♀️!”) —but, approached instead with an analytical lens, they should be a pulse check for overall system health and a jumping-off point for investigations.
Get it delivered straight to your inbox.
By subscribing to our newsletter, you agree to Honeycomb’s Terms of Service and Privacy Notice.
Pierre Tessier
SLOs—or Service Level Objectives—can be pretty powerful. They provide a safety net that helps teams identify and fix issues before they reach unacceptable levels and degrade the user experience. But SLOs can also be intimidating. Here’s how a lot of teams feel about them: We know we want SLOs, we’re not sure how to really use them, and we don’t know how to debug SLO-based alerts.
In this post, we’ll look at how you can use OpenTelemetry to monitor your unit tests and send that data to Honeycomb to visualize. It’s important to note that you don’t need to adopt Honeycomb, or even OpenTelemetry, in your production application to get the benefit of tracing. This example uses OpenTelemetry purely in the test project and provides great insights into our customer’s code.
Emily Nakashima
So many of the best and most promising managers I know have left management roles for senior IC roles since 2018, and as someone who has to hire managers, this creates a supply problem for me. Sincerely though, I also observe that a truly staggering number of Honeycomb’s most effective, most admired senior ICs are former managers, and while they seem quite happy and I wouldn’t wish them back to their old roles, the fact that all of these smart, thoughtful, driven, emotionally intelligent people all chose to leave the same high-paying, respectable role must mean something.
The scenario: you want to see distributed traces, maybe for your web app. You’ve set up an OpenTelemetry collector to receive OTLP traces in JSON over HTTP, and send those to Honeycomb (how to do that is another post, and we’ll link it here when it’s up). The question: does it work? Let’s test the collector and its connection to Honeycomb by sending a test span.
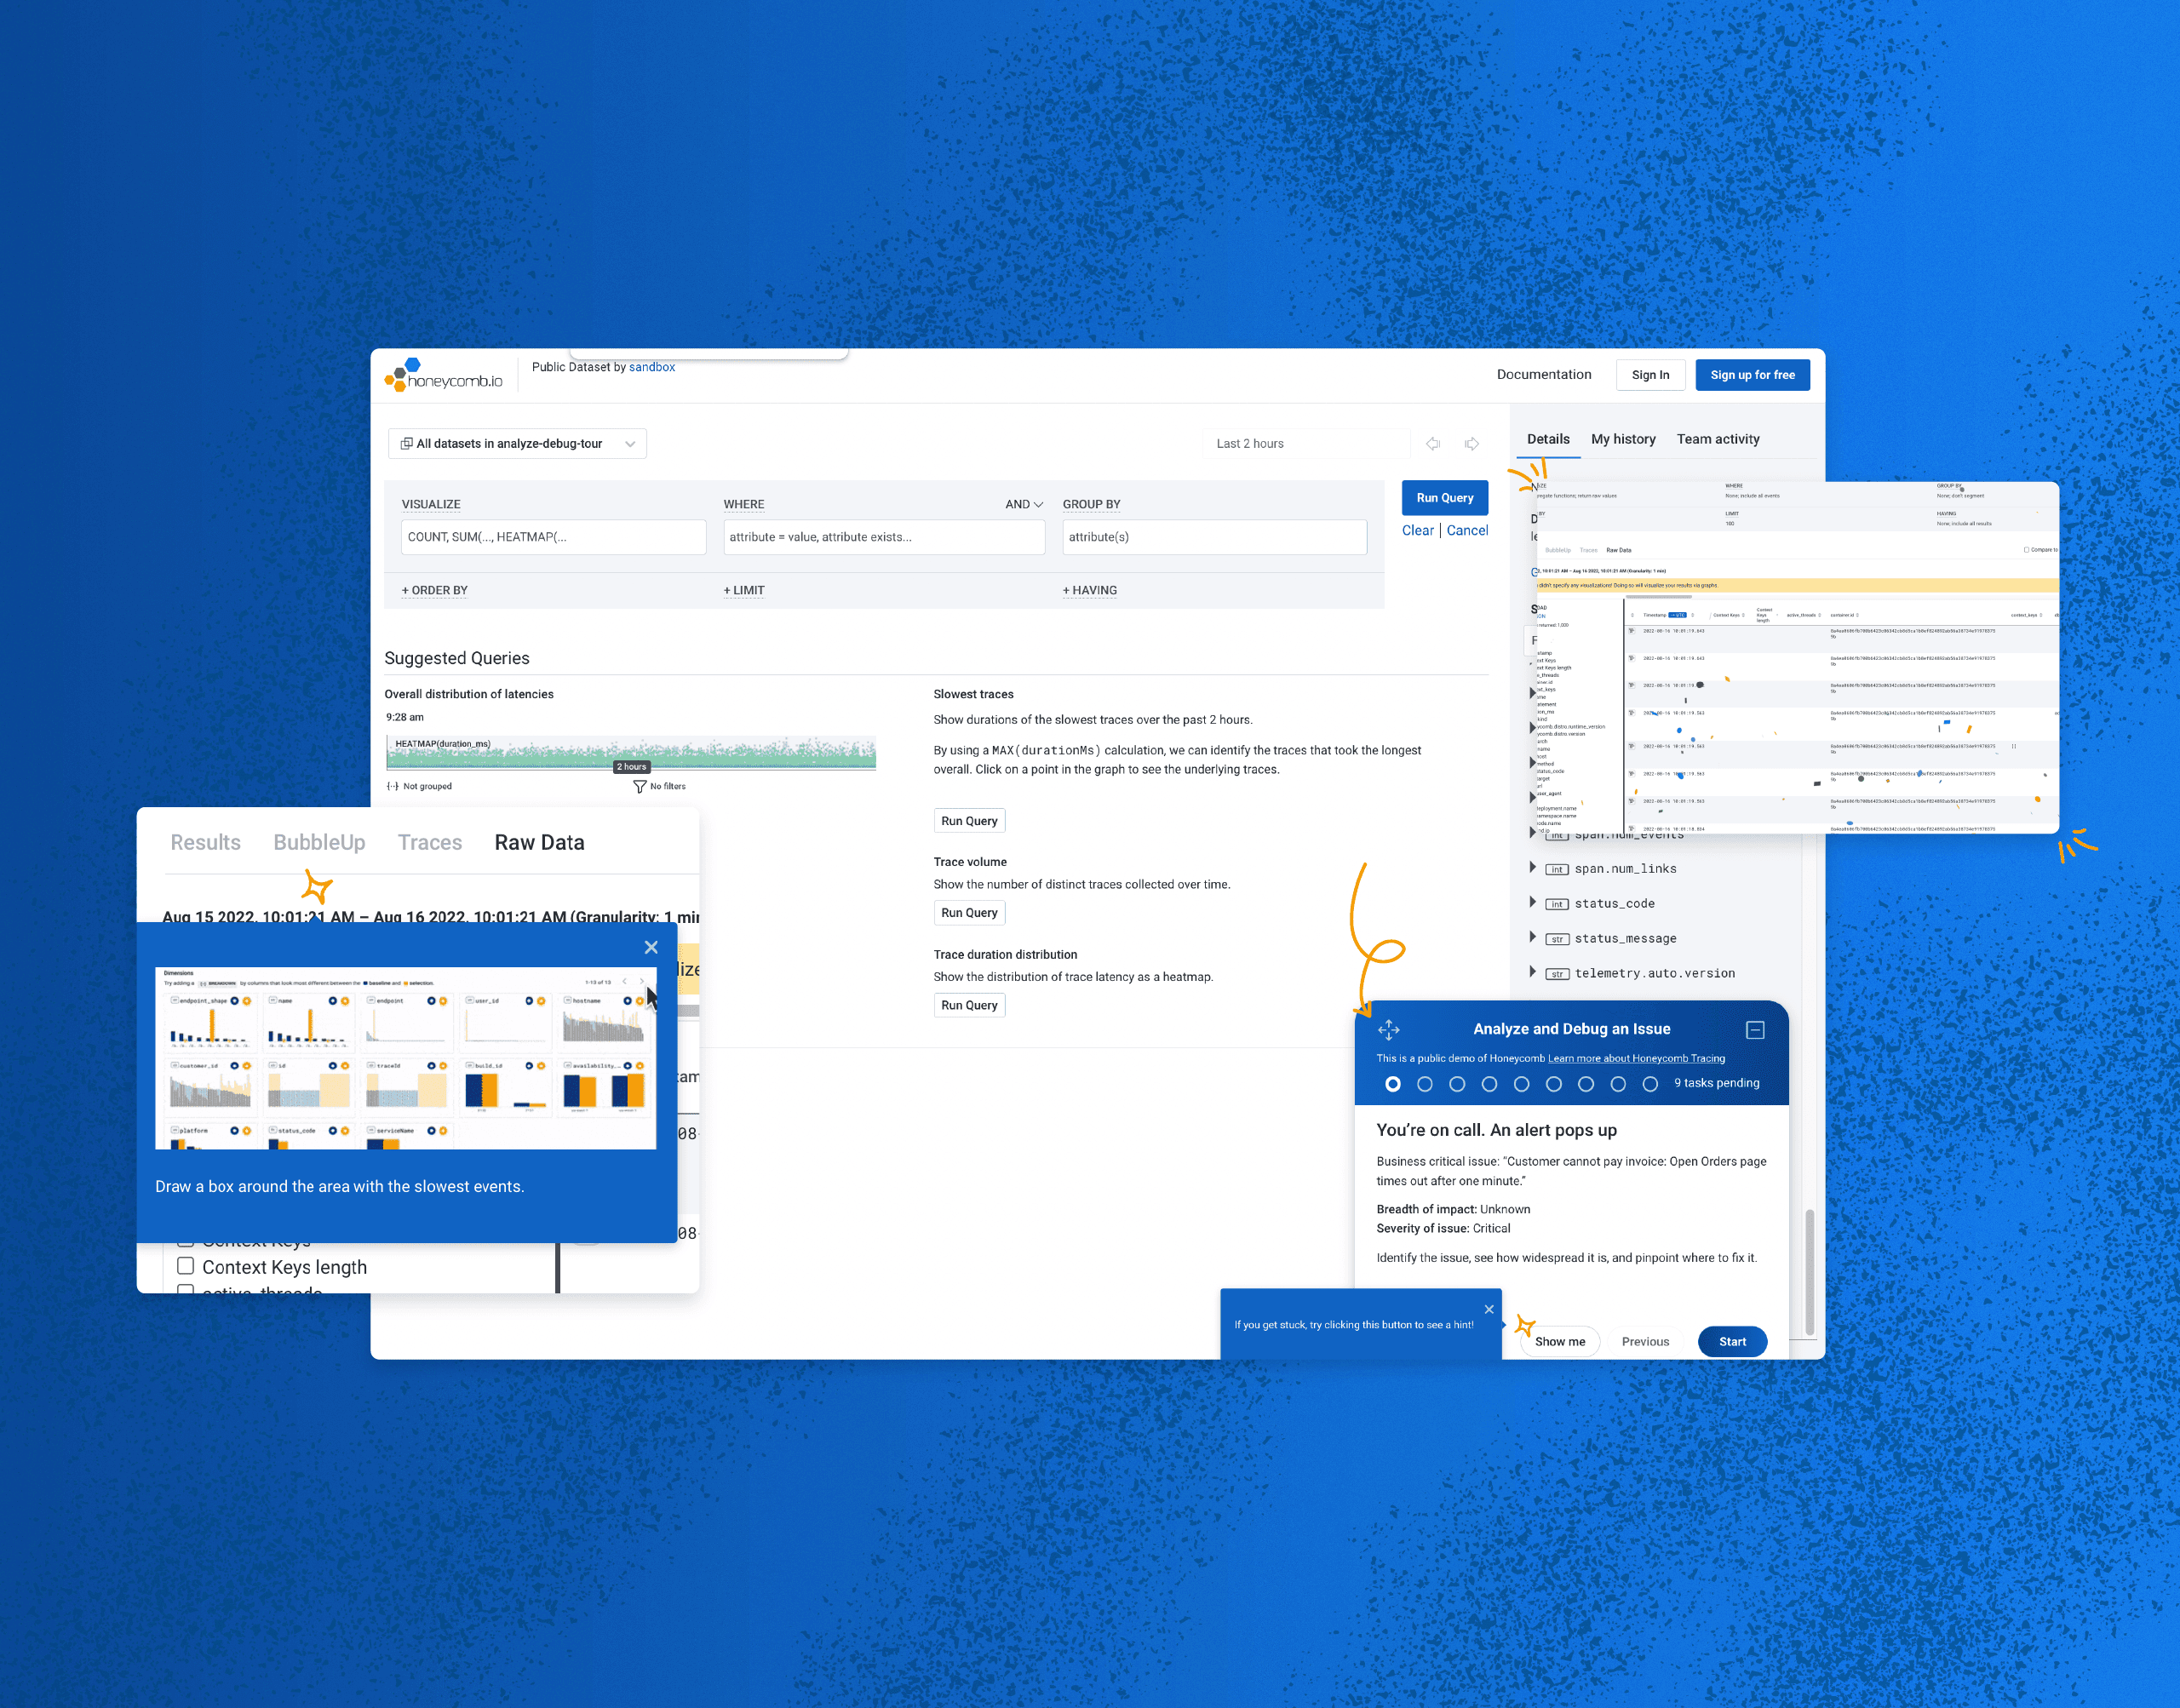
Honeycomb Play is an interactive sandbox that lets users explore Honeycomb’s data-enriched UI through a guided scenario. The hands-on experience takes a deep dive into how Honeycomb enables you to identify issues, assess their impact, and diagnose their causes for remediation.
Observability is about understanding systems, which means more than just production. Moving from logs to tracing and showing causality can be done locally, as well. We can give developers the same superpowers that SREs have: observability-driven development.
Charity Majors
If you let all the power drift over to the engineering managers, pretty soon it doesn’t look so great to be an engineer. Now you have people becoming managers for all the wrong reasons, or everyone saying they want to be a manager, or engineers tuning out and turning in their homework (or quitting). We all want autonomy and impact, we all crave a seat at the table. You need to work harder to save those seats for non-managers.
People use “observability team” as a catchall basket for all kinds of things these days—from cutting-edge tech to truly heinous hacks. Eh, it is what it is. The industry may be in a roiling state of massive flux, but I’m cautiously excited about the changes beginning to take shape and emerge from the muck. And I definitely think it’s worth spending some time talking about what observability teams can and should be.