Honeycomb was built for the AI era. Learn how to futureproof your software for what comes next.
Discover why Honeycomb is the better choice for your engineers, your customers, and your bottom line.
Start your journey with the definitive guide to observability. Download our complimentary ebook.
Bring observability to every software engineer.
Learn about our company, mission and values.
Come for the impact, stay for the culture.
See Honeycomb's latest press releases, media, and more
Learn more about becoming a Honeycomb partner.
Already a Honeycomb customer?
Fred Hebert
Good alerting hygiene consists of a few components: chasing down alert conditions, reflecting on incidents, and thinking of what makes a signal good or bad. The hope is that we can get our alerts to the stage where they will page us when they should, and they won’t when they shouldn’t. However, the reality of alerting in a socio-technical system must cater not only to the mess around the signal, but also to the longer term interpretation of alerts by people and automation acting on them. This post will expand on this messiness and why Honeycomb favors an iterative approach to setting our alerts.
Jeremy Blythe
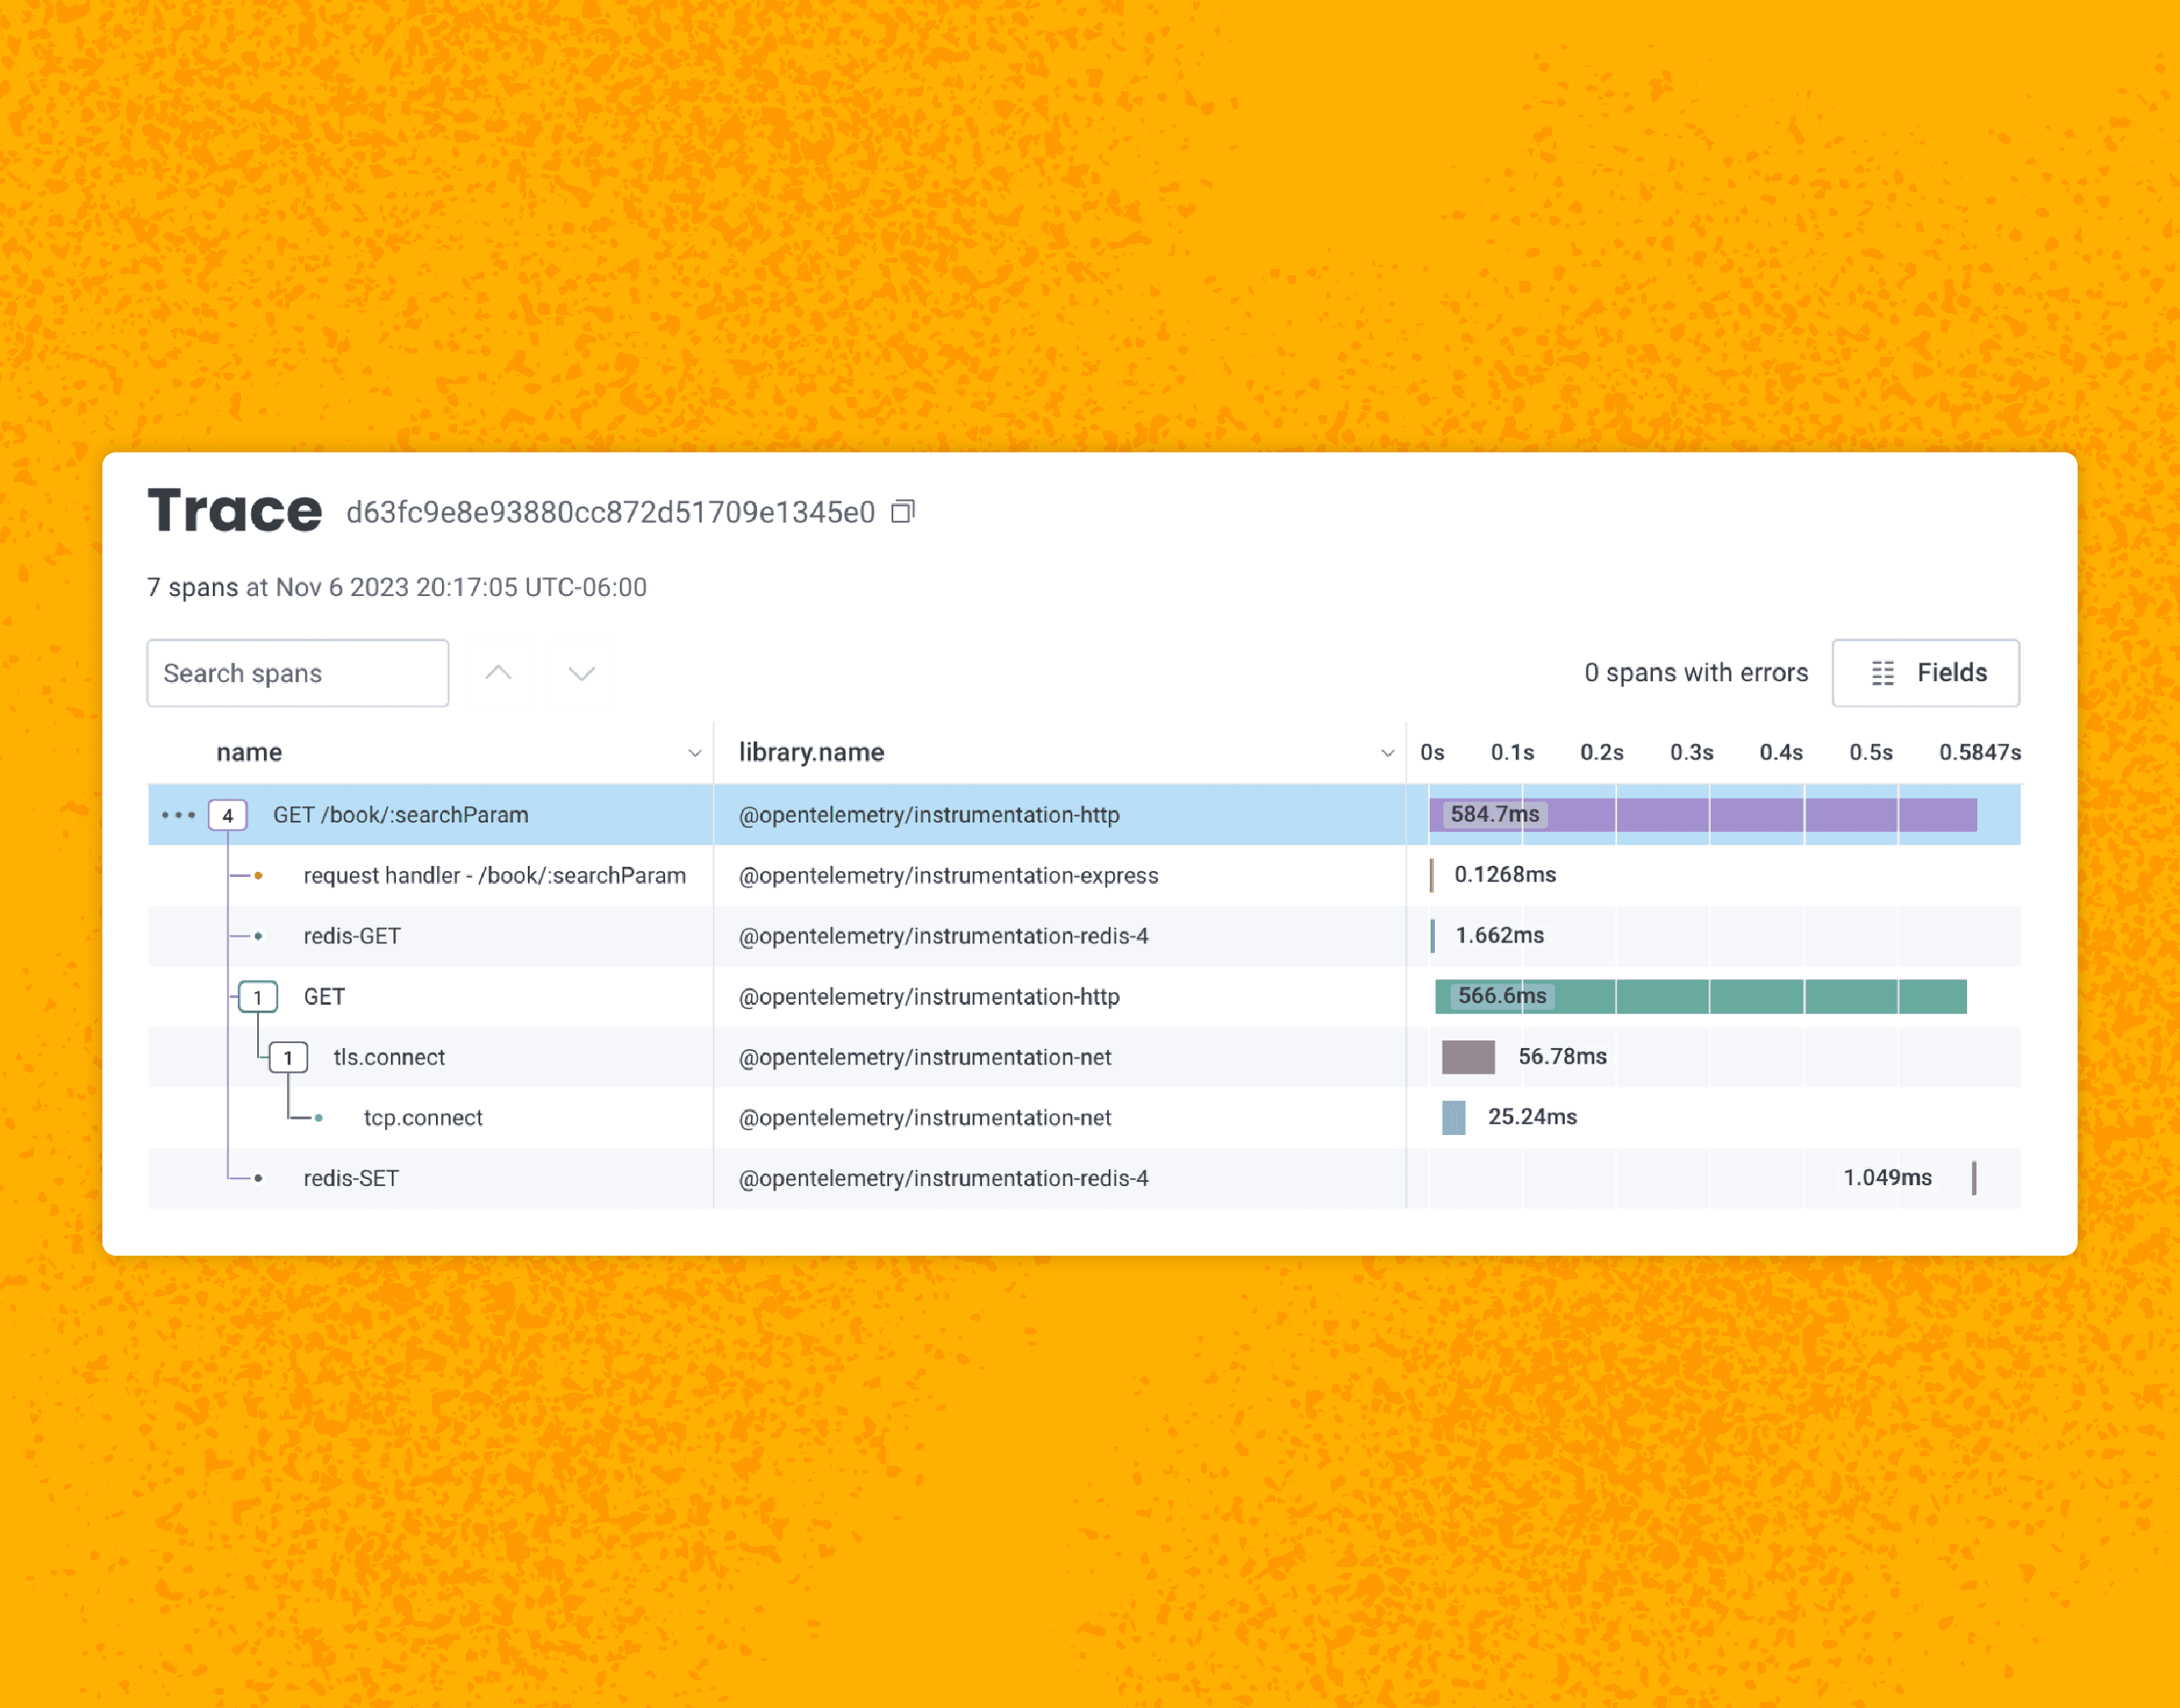
There’s plenty of literature on the mechanics of instrumenting code with OpenTelemetry and delivering it to Honeycomb. However, I’ve not found many guides on the craft of instrumenting code in order to have a good observability experience in your system. A lot of focus is placed on automatic instrumentation—which is great, particularly if you’re new to observability or retrofitting—but it misses the power of good instrumentation at the application level.
Cat Litten
Picture this: It’s 2 p.m. and you’re sipping on coffee, happily chugging away at your daily routine work. The security team shoots you a message saying the latest pentest or security scan found an issue that needs quick remediation. On the surface, that’s not a problem and can be considered somewhat routine, given the pace of new CVEs coming out. But what if you look at your tooling and find it lacking when you start remediating the issue?
Martin Thwaites
The OpenTelemetry Collector is a core part of telemetry pipelines, which makes it one of the parts of your infrastructure that must be as secure as possible. The general advice from the OpenTelemetry teams is to build a custom Collector executable instead of using the supplied ones when you’re using it in a production scenario. However, that isn’t an easy task, and that prompted me to build something.
Fahim Zaman
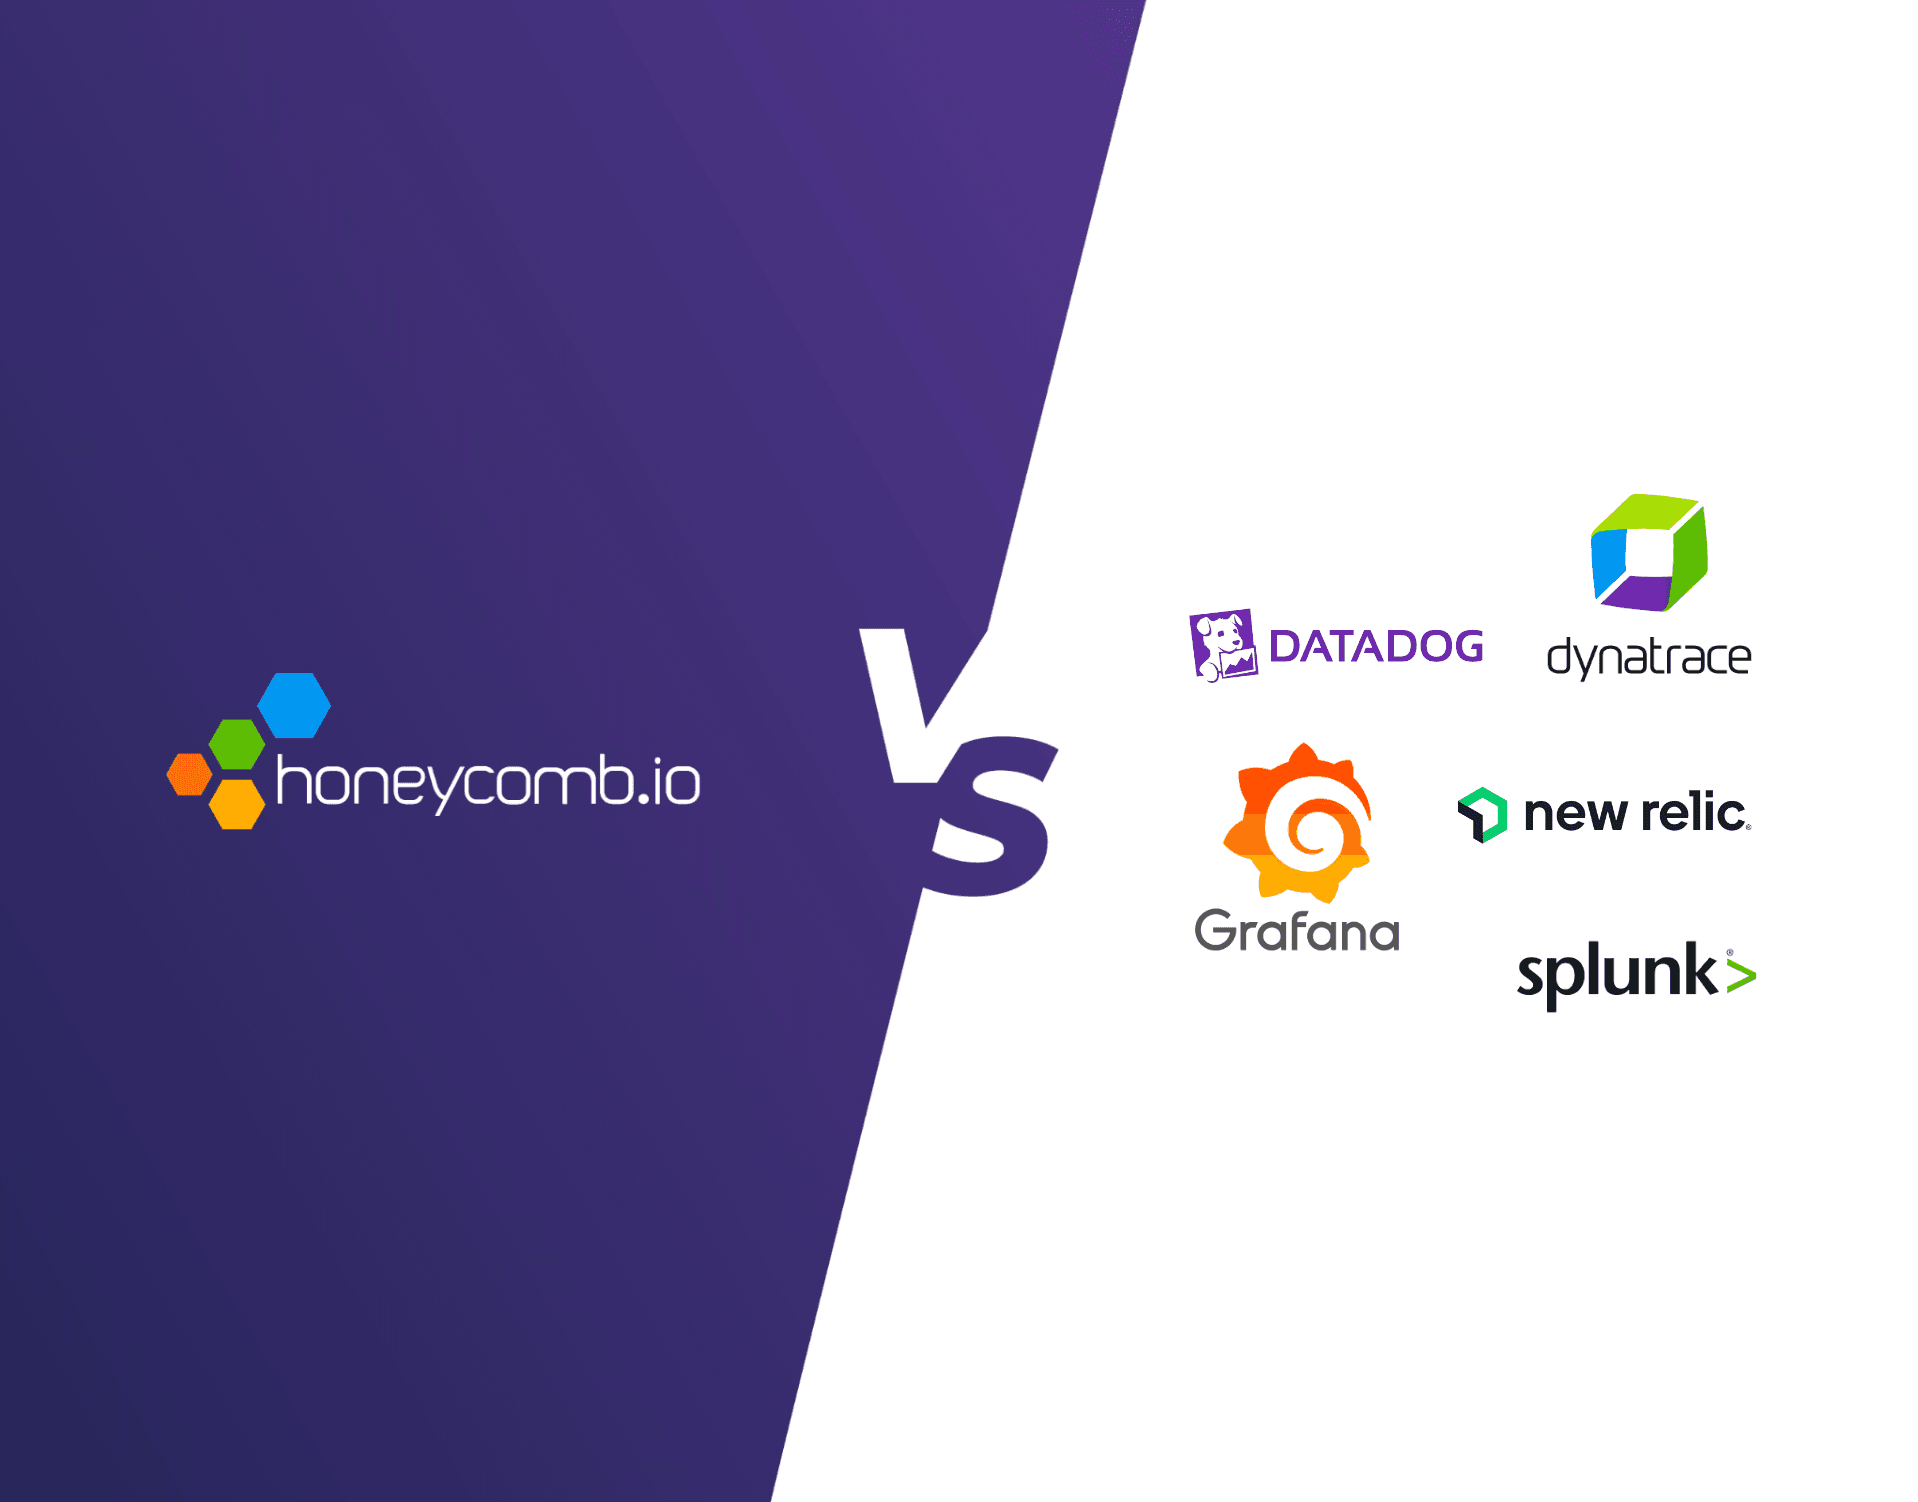
For developers, understanding the performance of shipped code is crucial. Through the last decade, a tablestake function in software monitoring and observability solutions has been to save and track app metrics. Engineers love tools that get out of your way and just work, and the appeal of today’s best-in-class application performance monitoring (APM) suites lies in a seamless day zero experience with drop-in agent installs, button click integrations, and immediate metrics collection. However, the success of no-hassle metrics comes with a caveat—the internet is replete with examples of premiere application monitoring costs spiraling beyond expectations.
Winston Hearn
I’ve been thinking about a risk that—if I’m not careful—could severely hinder my team’s ability to ship on time, celebrate success, and continue work after launch: burnout. I don’t see burnout mentioned often when the work of product management is discussed, but I believe it should be taken much more seriously.
Jessica Kerr (Jessitron)
In a keynote at AI.Dev, Robert Nishihara (CEO, Anyscale) described the shift: A year ago, the people working with ML models were ML experts. Now, they’re developers. A year ago, the process was to experiment with building a model, then put a product on top of it. Now, it’s ship a product, find the market fit, then create customized models.
Natalie Friedman
Today marks an exciting milestone at Honeycomb, and we’re thrilled to share it with you. We officially launched our integration with Microsoft Teams, a step forward in our continuous effort to streamline and enhance your observability experience. Teams now joins our growing list of over 100 Honeycomb integrations.
Phillip Carter
Earlier this year, the folks working on OpenTelemetry launched an effort to stabilize HTTP Semantic Conventions. In November 2023, OpenTelemetry announced that HTTP Semantic Conventions were stable. They accomplished this by merging the existing HTTP Semantic Conventions with the Elastic Common Schema HTTP attribute conventions.
Austin Parker
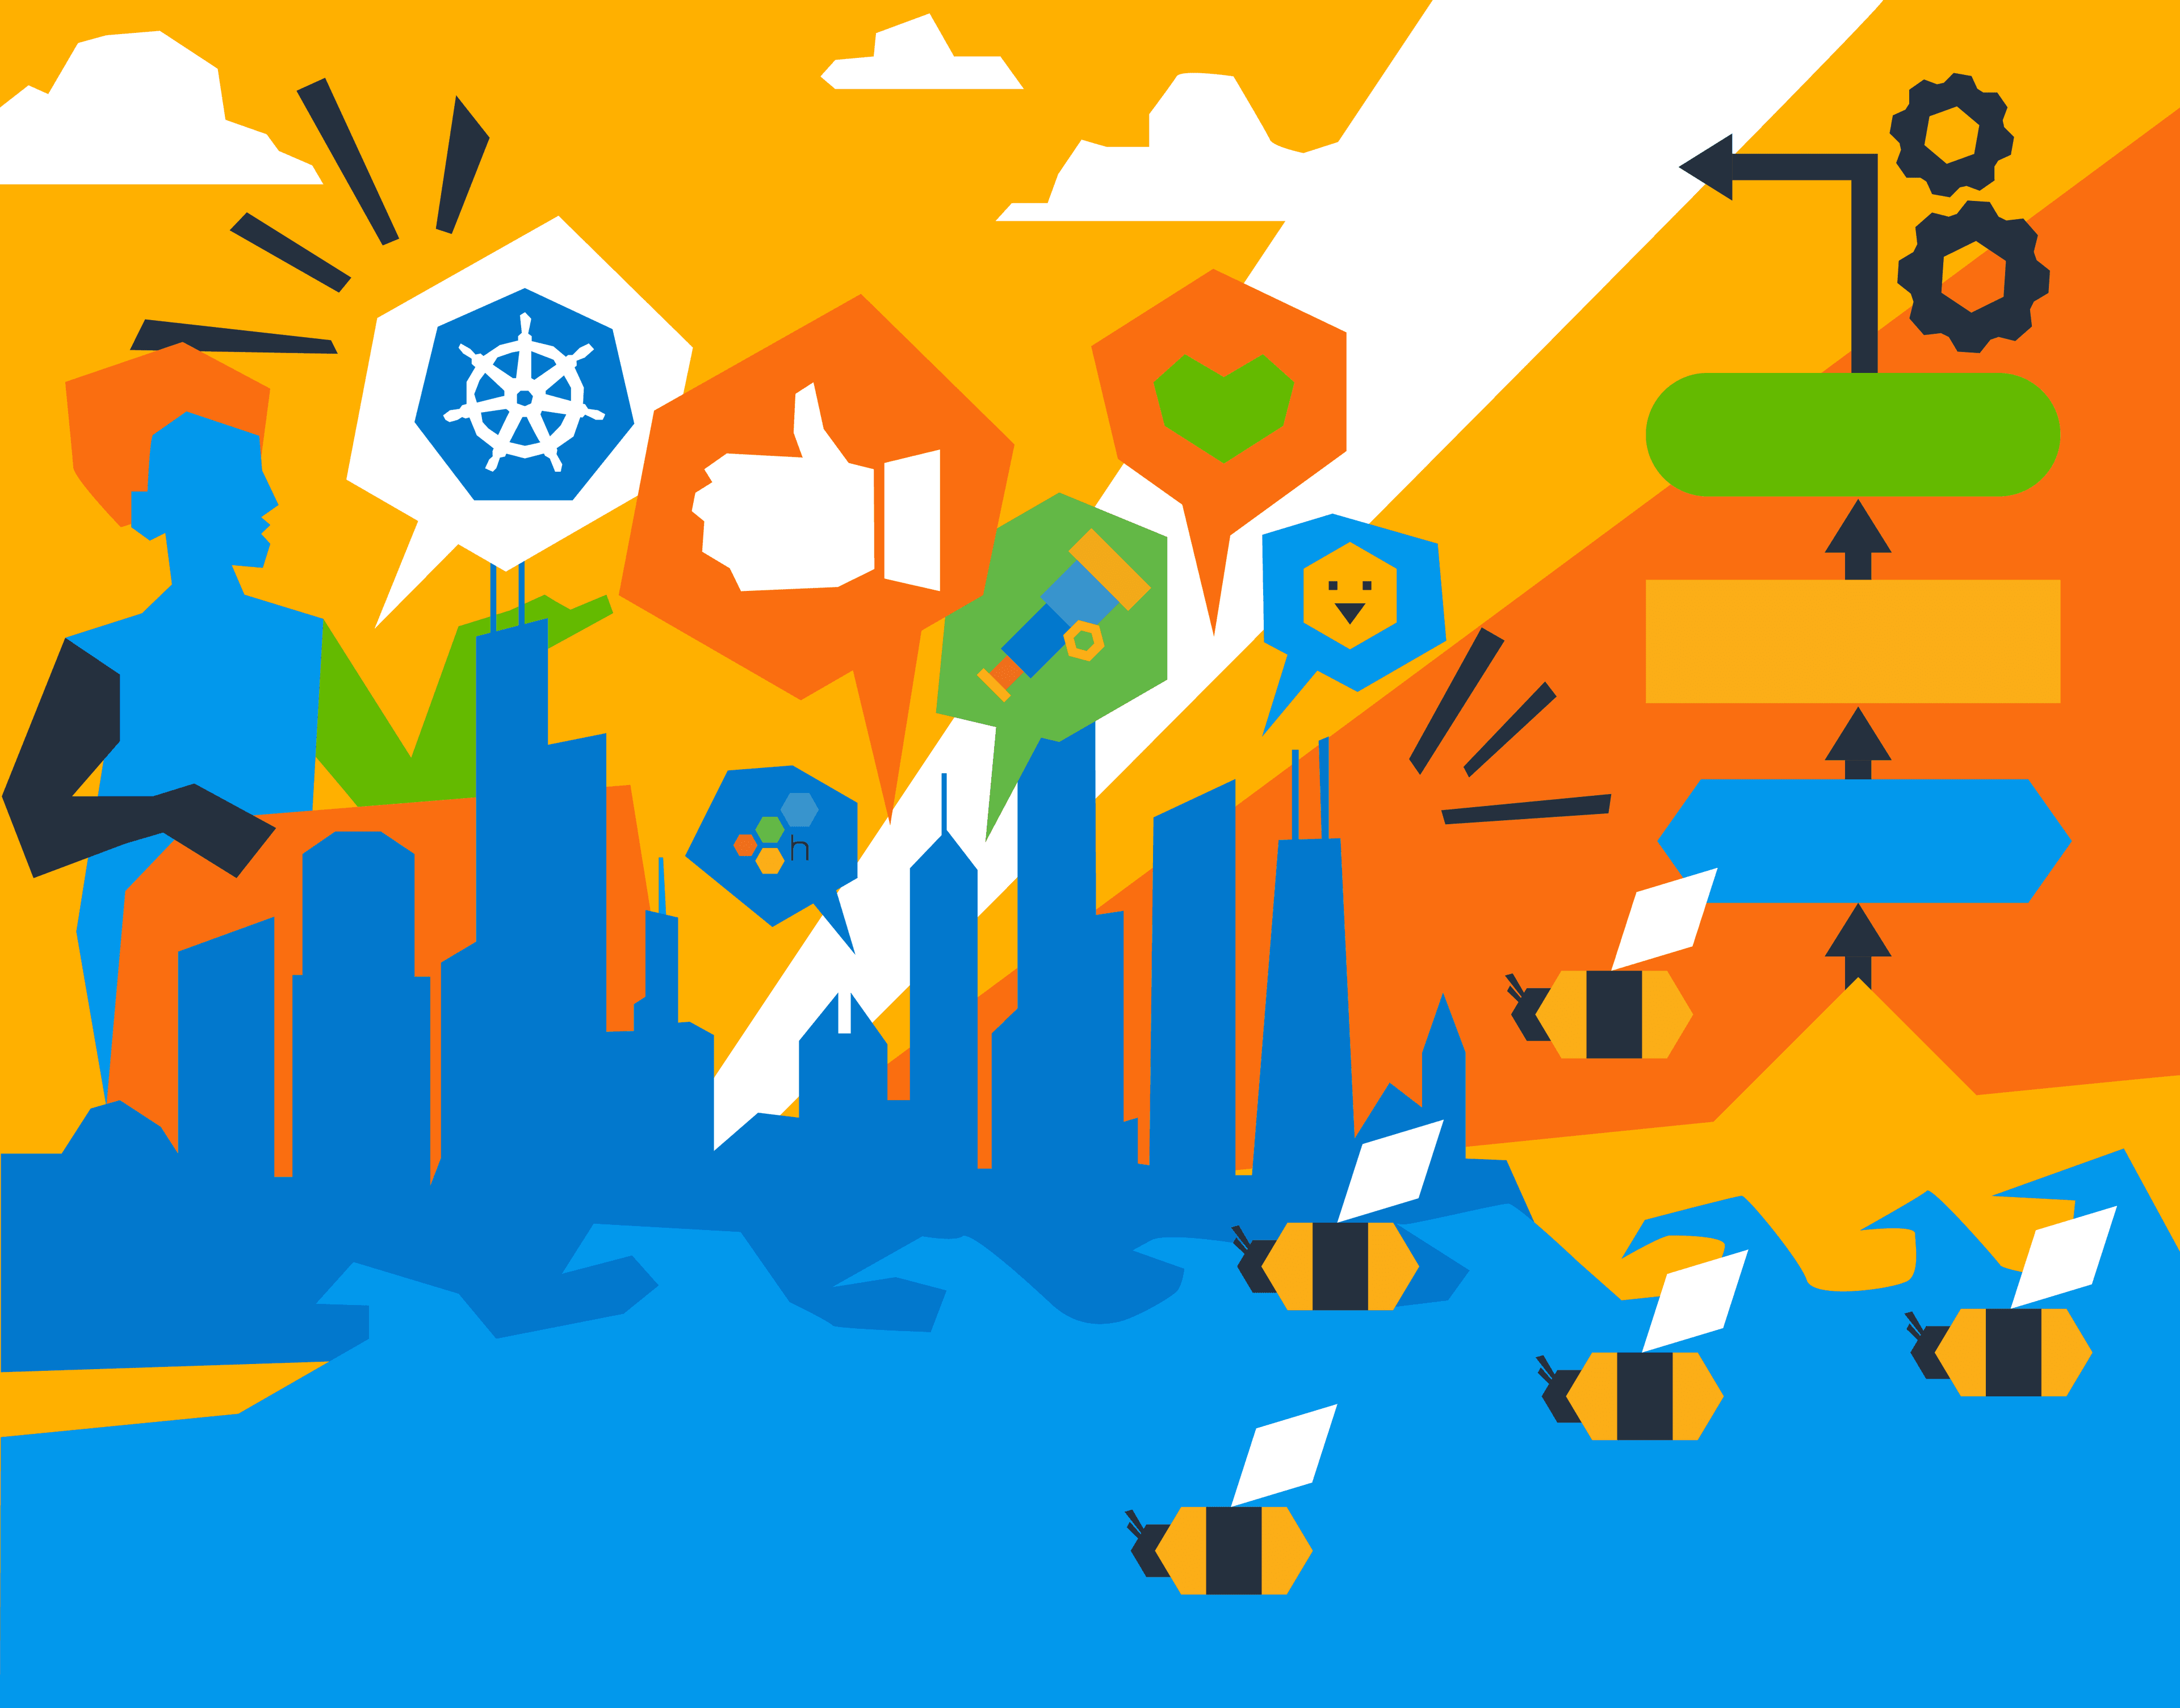
Cloud-native developers and practitioners gathered from around the world to learn, collaborate, and network at KubeCon/CloudNativeCon North America 2023 between November 6th and 9th at McCormick Place in Chicago, IL—myself included. This wasn’t my first time attending—I’ve been coming to KubeCon since 2016—but it was easily one of the most exciting experiences I’ve had as part of the cloud-native community.
Jamie Danielson
Now that we’ve had time to decompress from Kubecon, we wanted to do a writeup about our collective experience. Six of us spoke at the conference and Charity participated in a panel, so we included short talk recaps.
Purvi Kanal
So you’ve taken a look at the core web vitals for your site and… it’s not looking good. You’re overwhelmed, and you don’t know what change to make because everything seems like too big of a project to make a real difference. There are so many measurements to keep track of and the standards cited seem even scarier. This is extremely normal. Web performance standards can feel impossible to meet for a lot of us.
Get it delivered straight to your inbox.
By subscribing to our newsletter, you agree to Honeycomb’s Terms of Service and Privacy Notice.
Observability is important to understand what’s happening in production. But carving out the time to add instrumentation to a codebase is daunting, and often treated as a separate task to writing features. This means that we end up instrumenting for observability long after a feature has shipped, usually when there’s a problem with it and we’ve lost all context. What if we instead treated observability similarly to how we treat tests? We don’t submit code without a test, so let’s do the same with observability: treat it as part of the feature while the code is still fresh in our mind, with the benefit of being able to observe how the feature behaves in production.
George Miranda
Ever since we launched Query Assistant last June, we’ve learned a lot about working with—and improving—Large Language Models (LLMs) in production with Honeycomb. Today, we’re sharing those techniques so that you can use them to achieve better outputs from your own LLM applications. The techniques in this blog are a new Honeycomb use case. You can use them today. For free. With Honeycomb. If you’re running LLM apps in production (or thinking about it), these approaches should be useful.
Mike Terhar
A lot of reasoning in content is predicated on the audience being in a modern, psychologically safe, agile sort of environment. It’s aspirational, so folks who aren’t in those environments may feel like the path there includes doing “the new thing” or using “the new tool.” If you write software and your employer hasn’t caught up to all the newest, best ways to work, I hope this pragmatic post helps you sleep better at night.
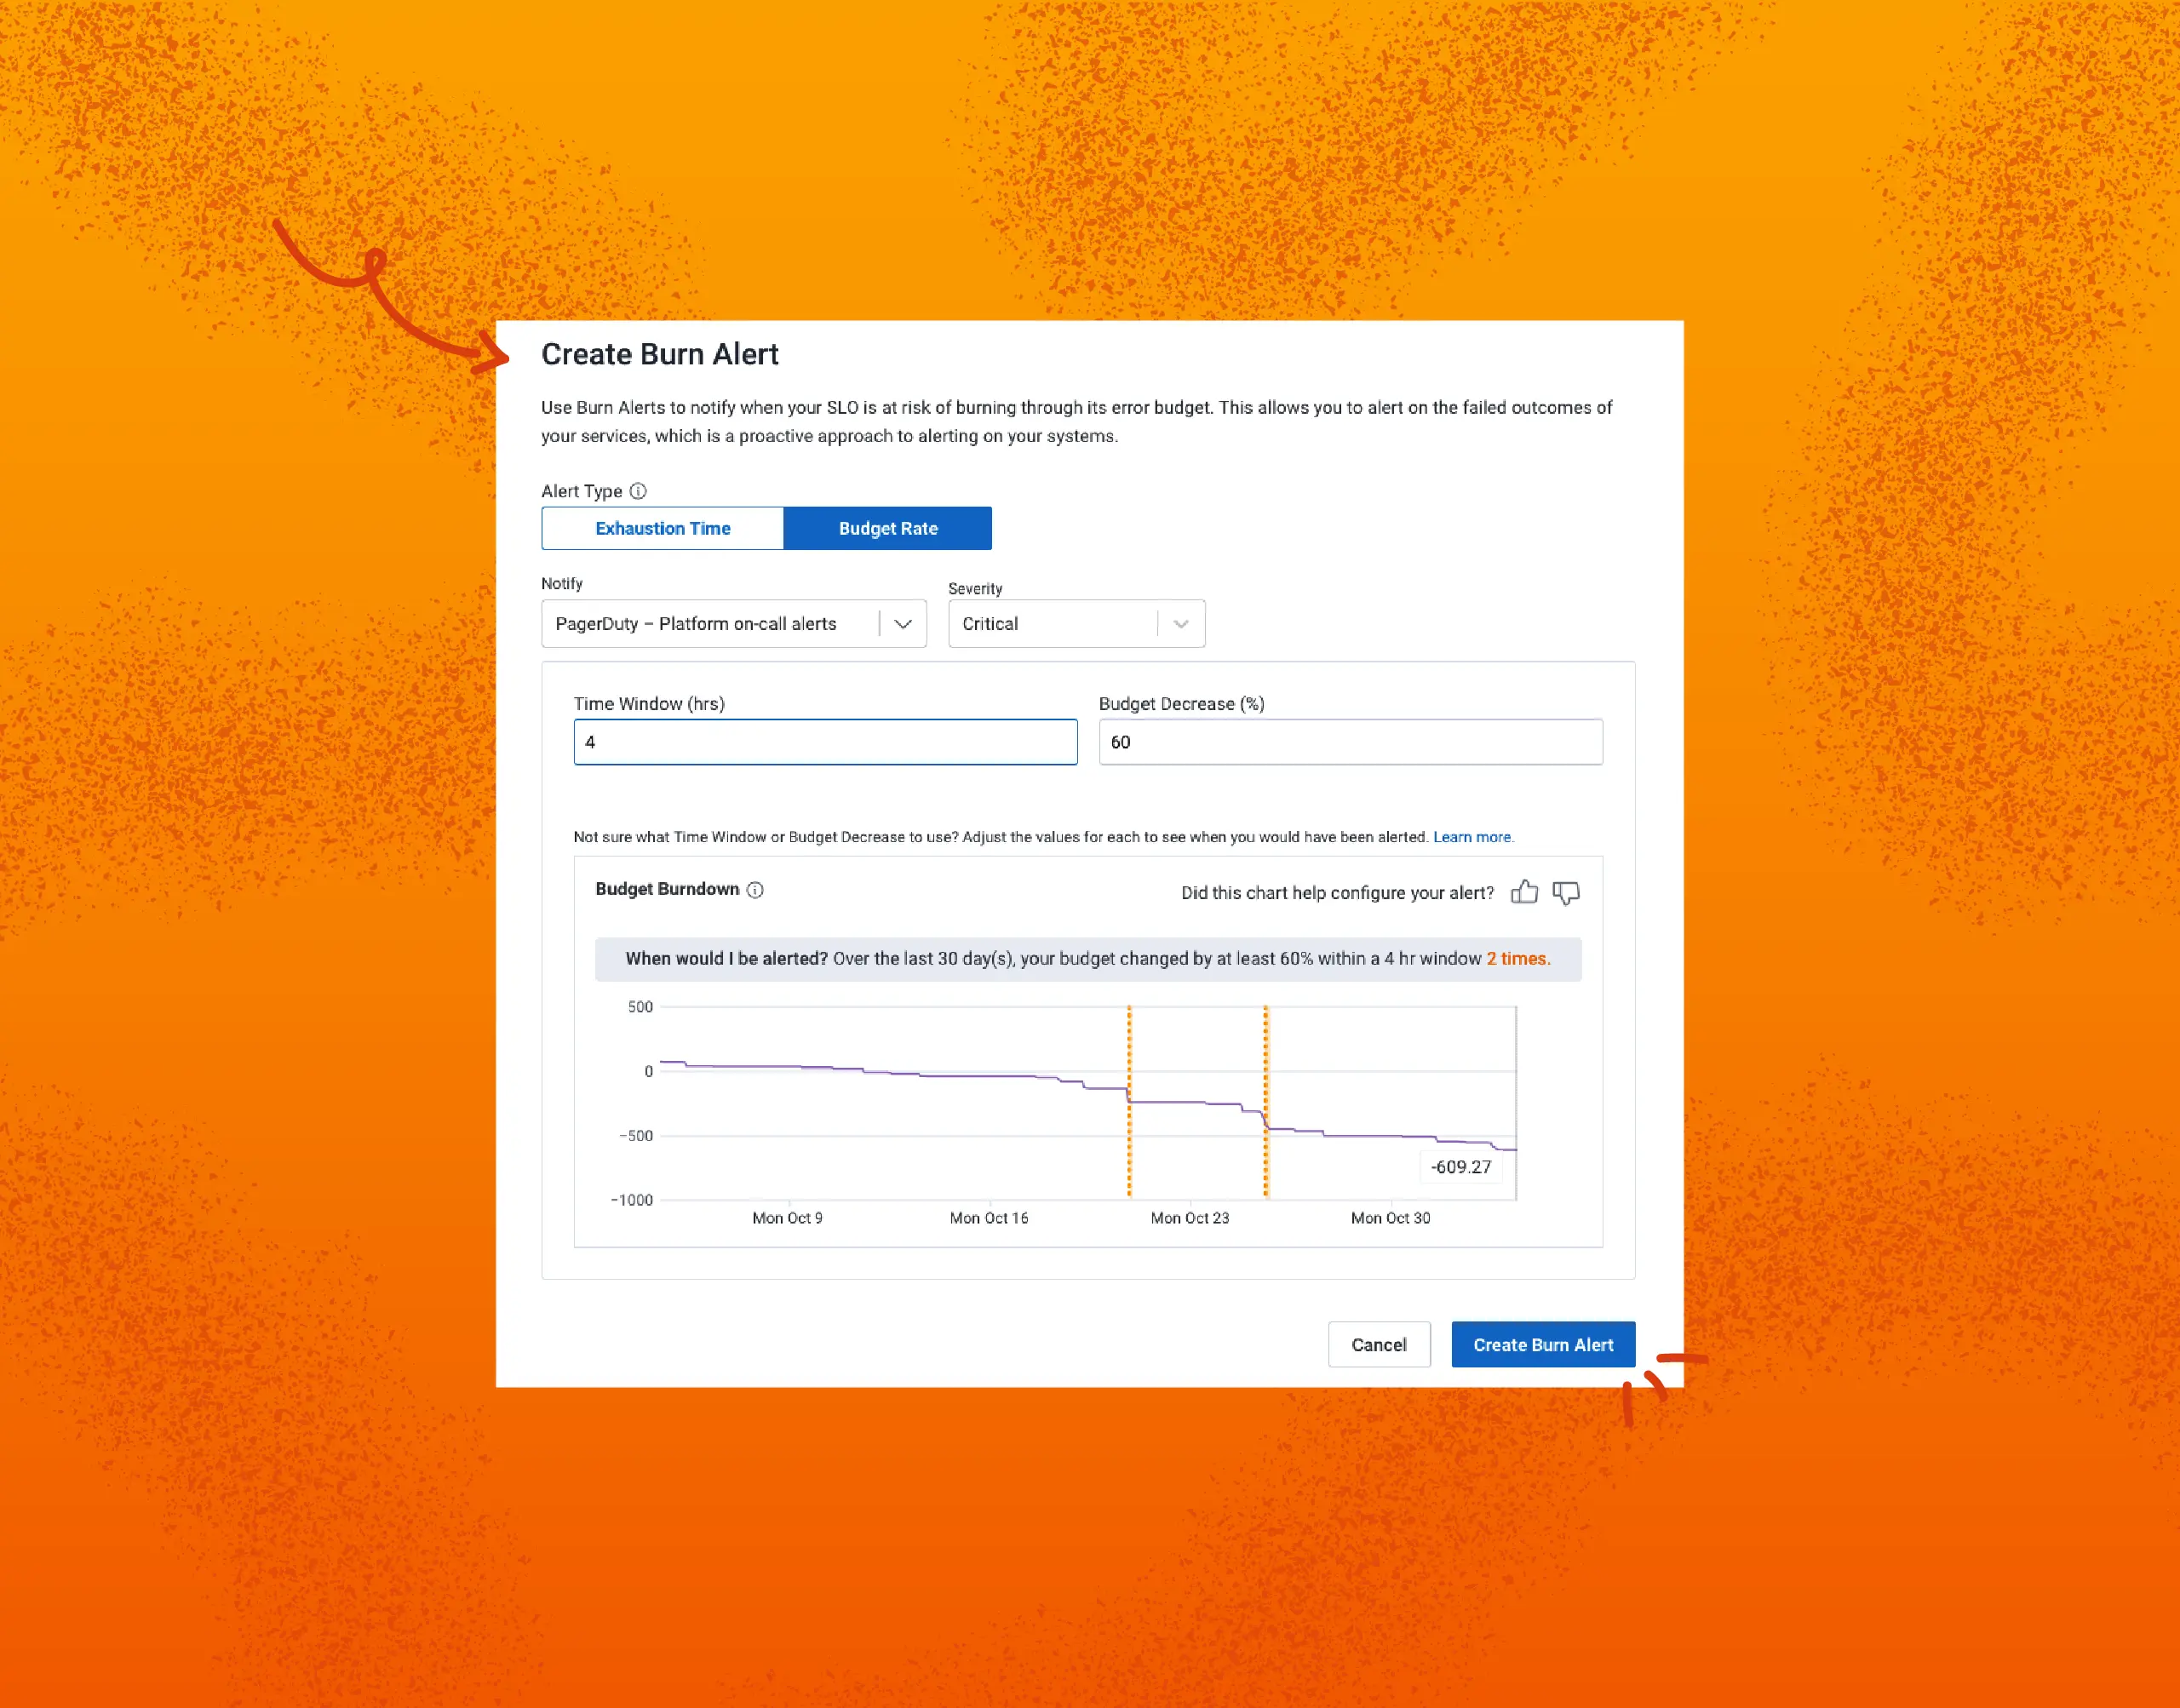
As someone living the Honeycomb ops life for a while, SLOs have been the bread and butter of our most critical and useful alerting. However, they had severe, long-standing limitations. In this post, I will describe these limitations, and how our brand new feature, budget rate alerts, addresses them.
Stop me if you’ve heard this one before: you just pushed and deployed your latest change to production, and it’s rolling out to your Kubernetes cluster. You sip your coffee as you wrap up some documentation when a ping in the ops channel catches your eye—a sales engineer is complaining that the demo environment is slow. Probably nothing to worry about, not like your changes had anything to do with that… but, minutes later, more alerts start to fire off.
In telemetry jargon, a pipeline is a directed acyclic graph (DAG) of nodes that carry emitted signals from an application to a backend. In an OpenTelemetry Collector, a pipeline is a set of receivers that collect signals, runs them through processors, and then emits them through configured exporters. This blog post hopes to simplify both types of pipelines by using an OpenTelemetry extension called the Headers Setter.
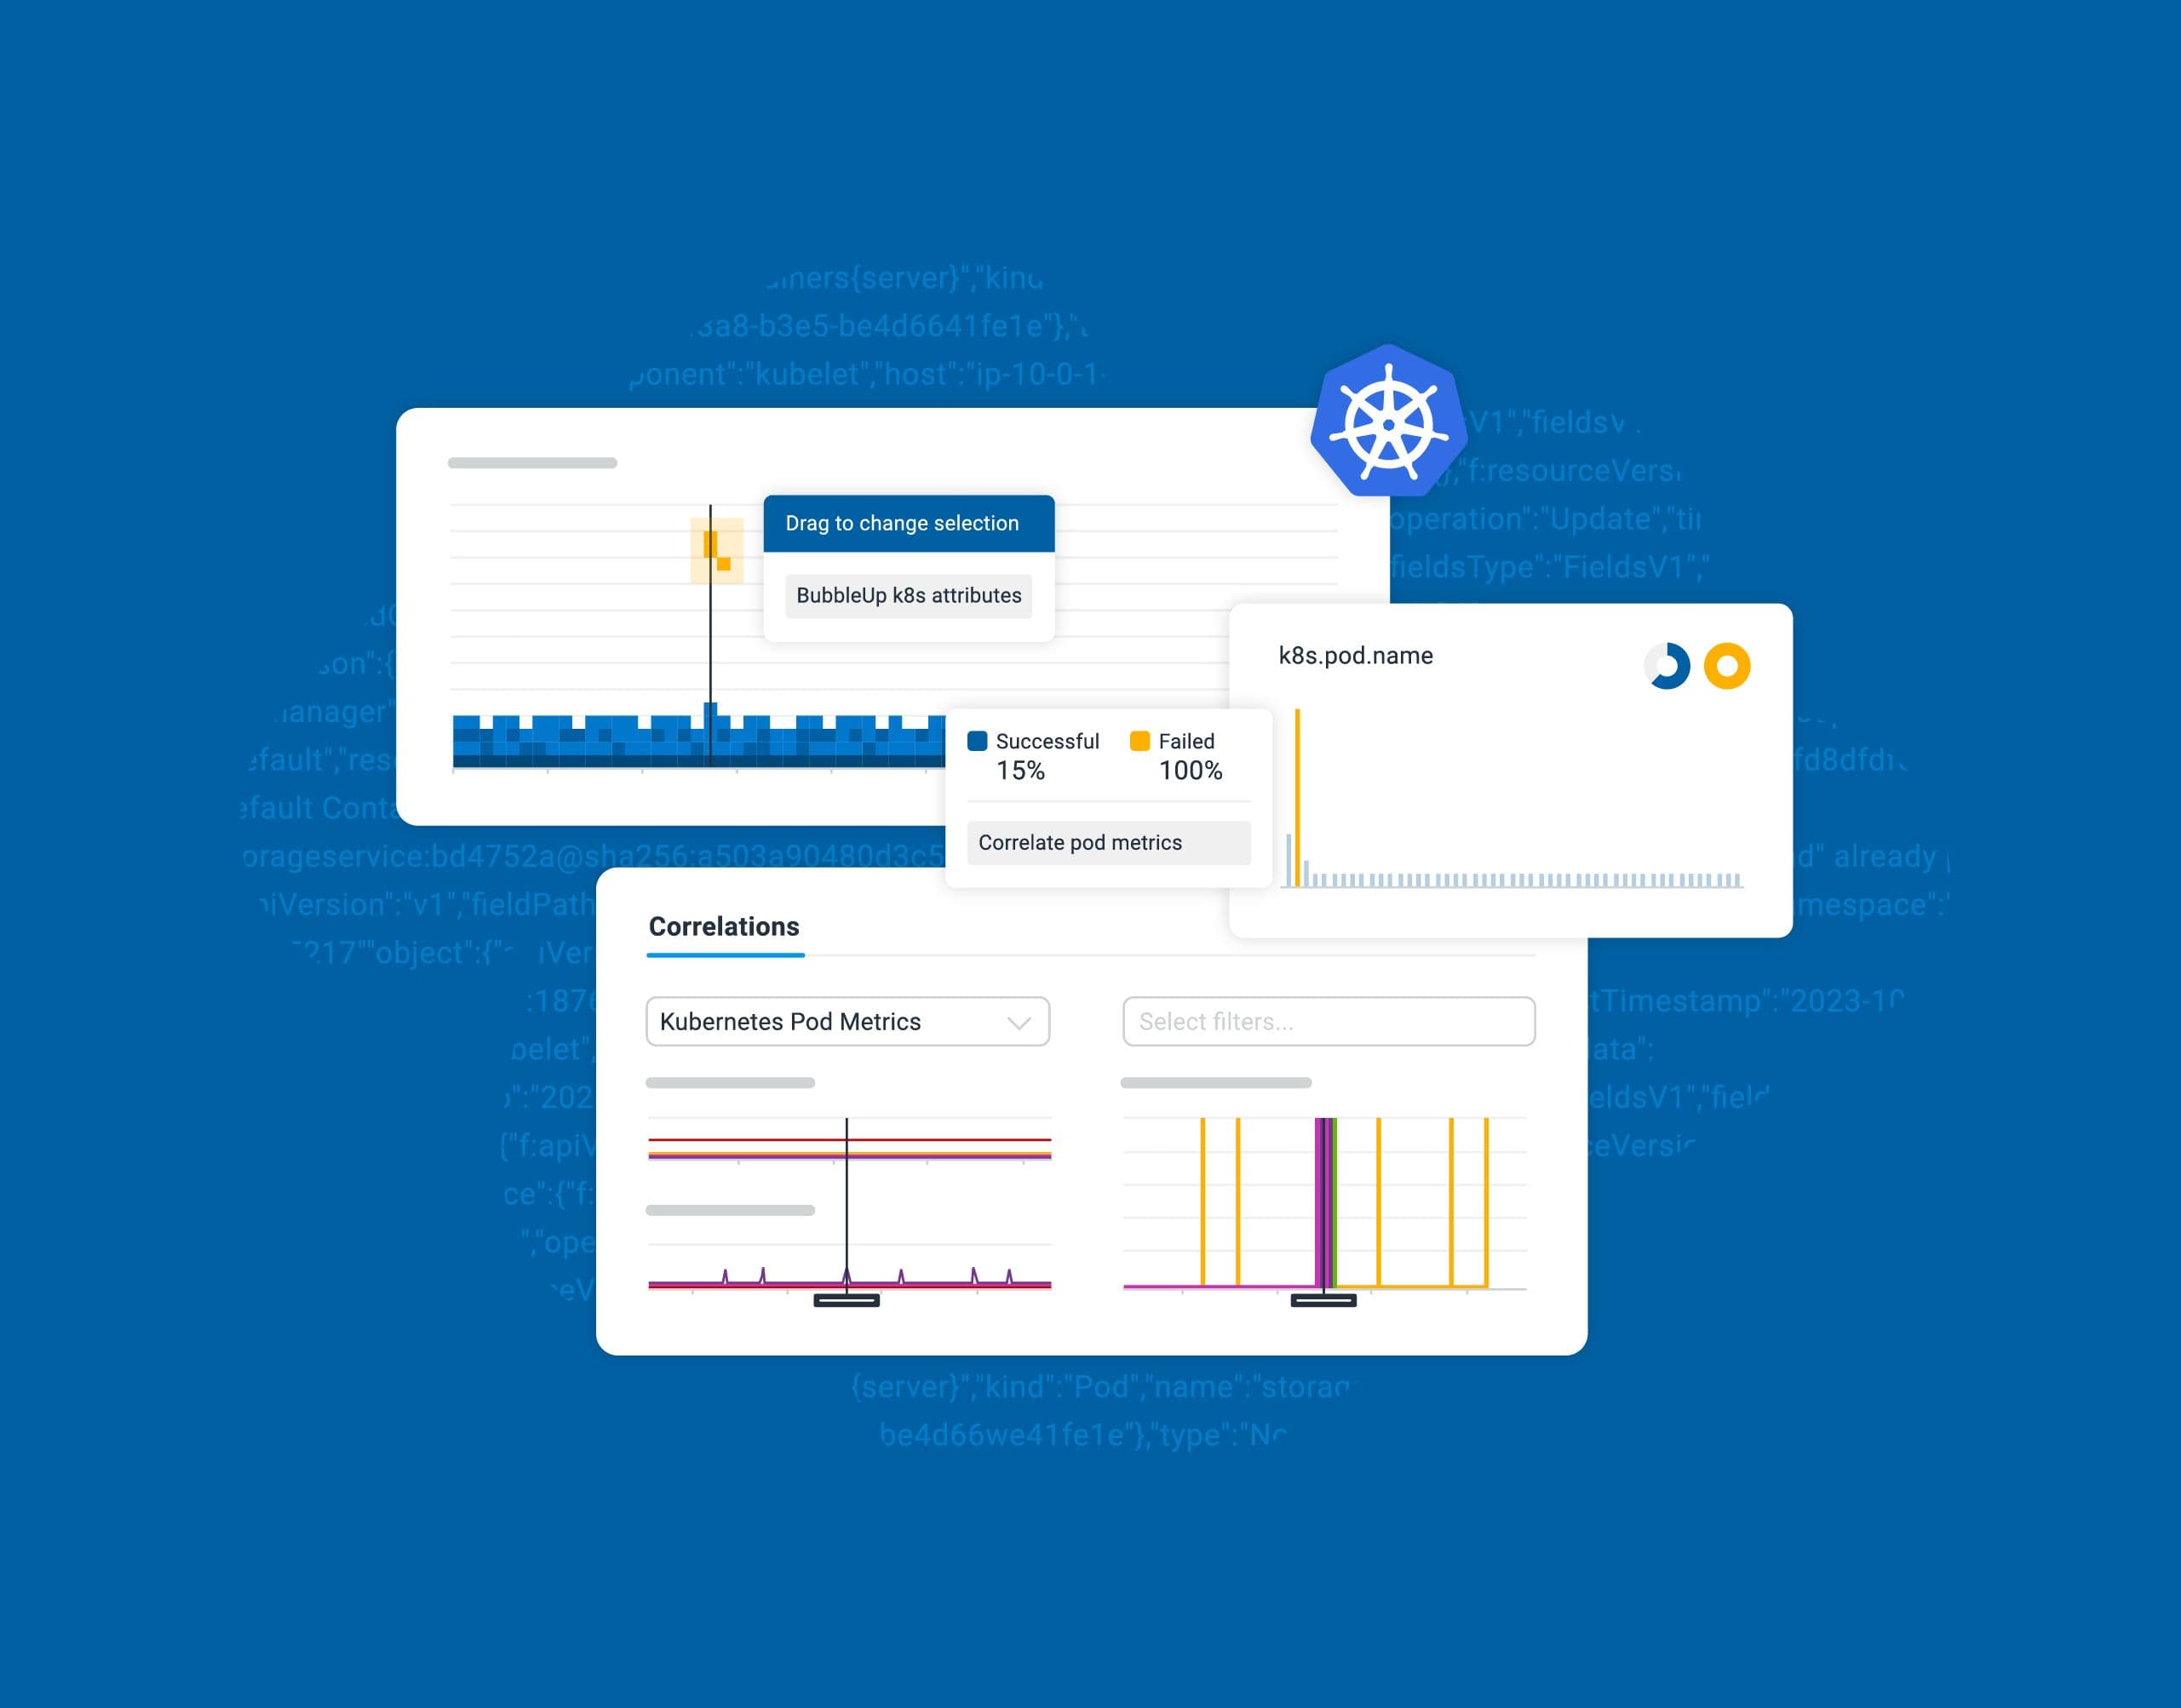
In our continuous journey to support teams grappling with the complexities of Kubernetes environments, we’re thrilled to announce the launch of Honeycomb for Kubernetes, a dedicated solution designed to bridge the growing divide between infrastructure/platform teams and application developers. This is available to all plans (including Free!) at no additional cost.
You probably know that we have a generous free plan that allows you to send 20 million events per month. This is enough for many of our customers. In fact, some have developed neat techniques to keep themselves underneath the event limit. I’m going to share one way here—hopefully no one at Honeycomb notices!