Honeycomb was built for the AI era. Learn how to futureproof your software for what comes next.
Discover why Honeycomb is the better choice for your engineers, your customers, and your bottom line.
Start your journey with the definitive guide to observability. Download our complimentary ebook.
Bring observability to every software engineer.
Learn about our company, mission and values.
Come for the impact, stay for the culture.
See Honeycomb's latest press releases, media, and more
Learn more about becoming a Honeycomb partner.
Already a Honeycomb customer?
Nick Rycar
You know the old saying, I’m sure: “April deploys bring May joys.” Okay, maybe it doesn’t go exactly like that, but after reading what we’ve been up to for the past month, I think…
Phillip Carter
Engineers know best. No machine or tool will ever match the context and capacity that engineers have to make judgment calls about what a system should or shouldn’t do. We built Honeycomb to augment human intuition, not replace it.
Rox Williams
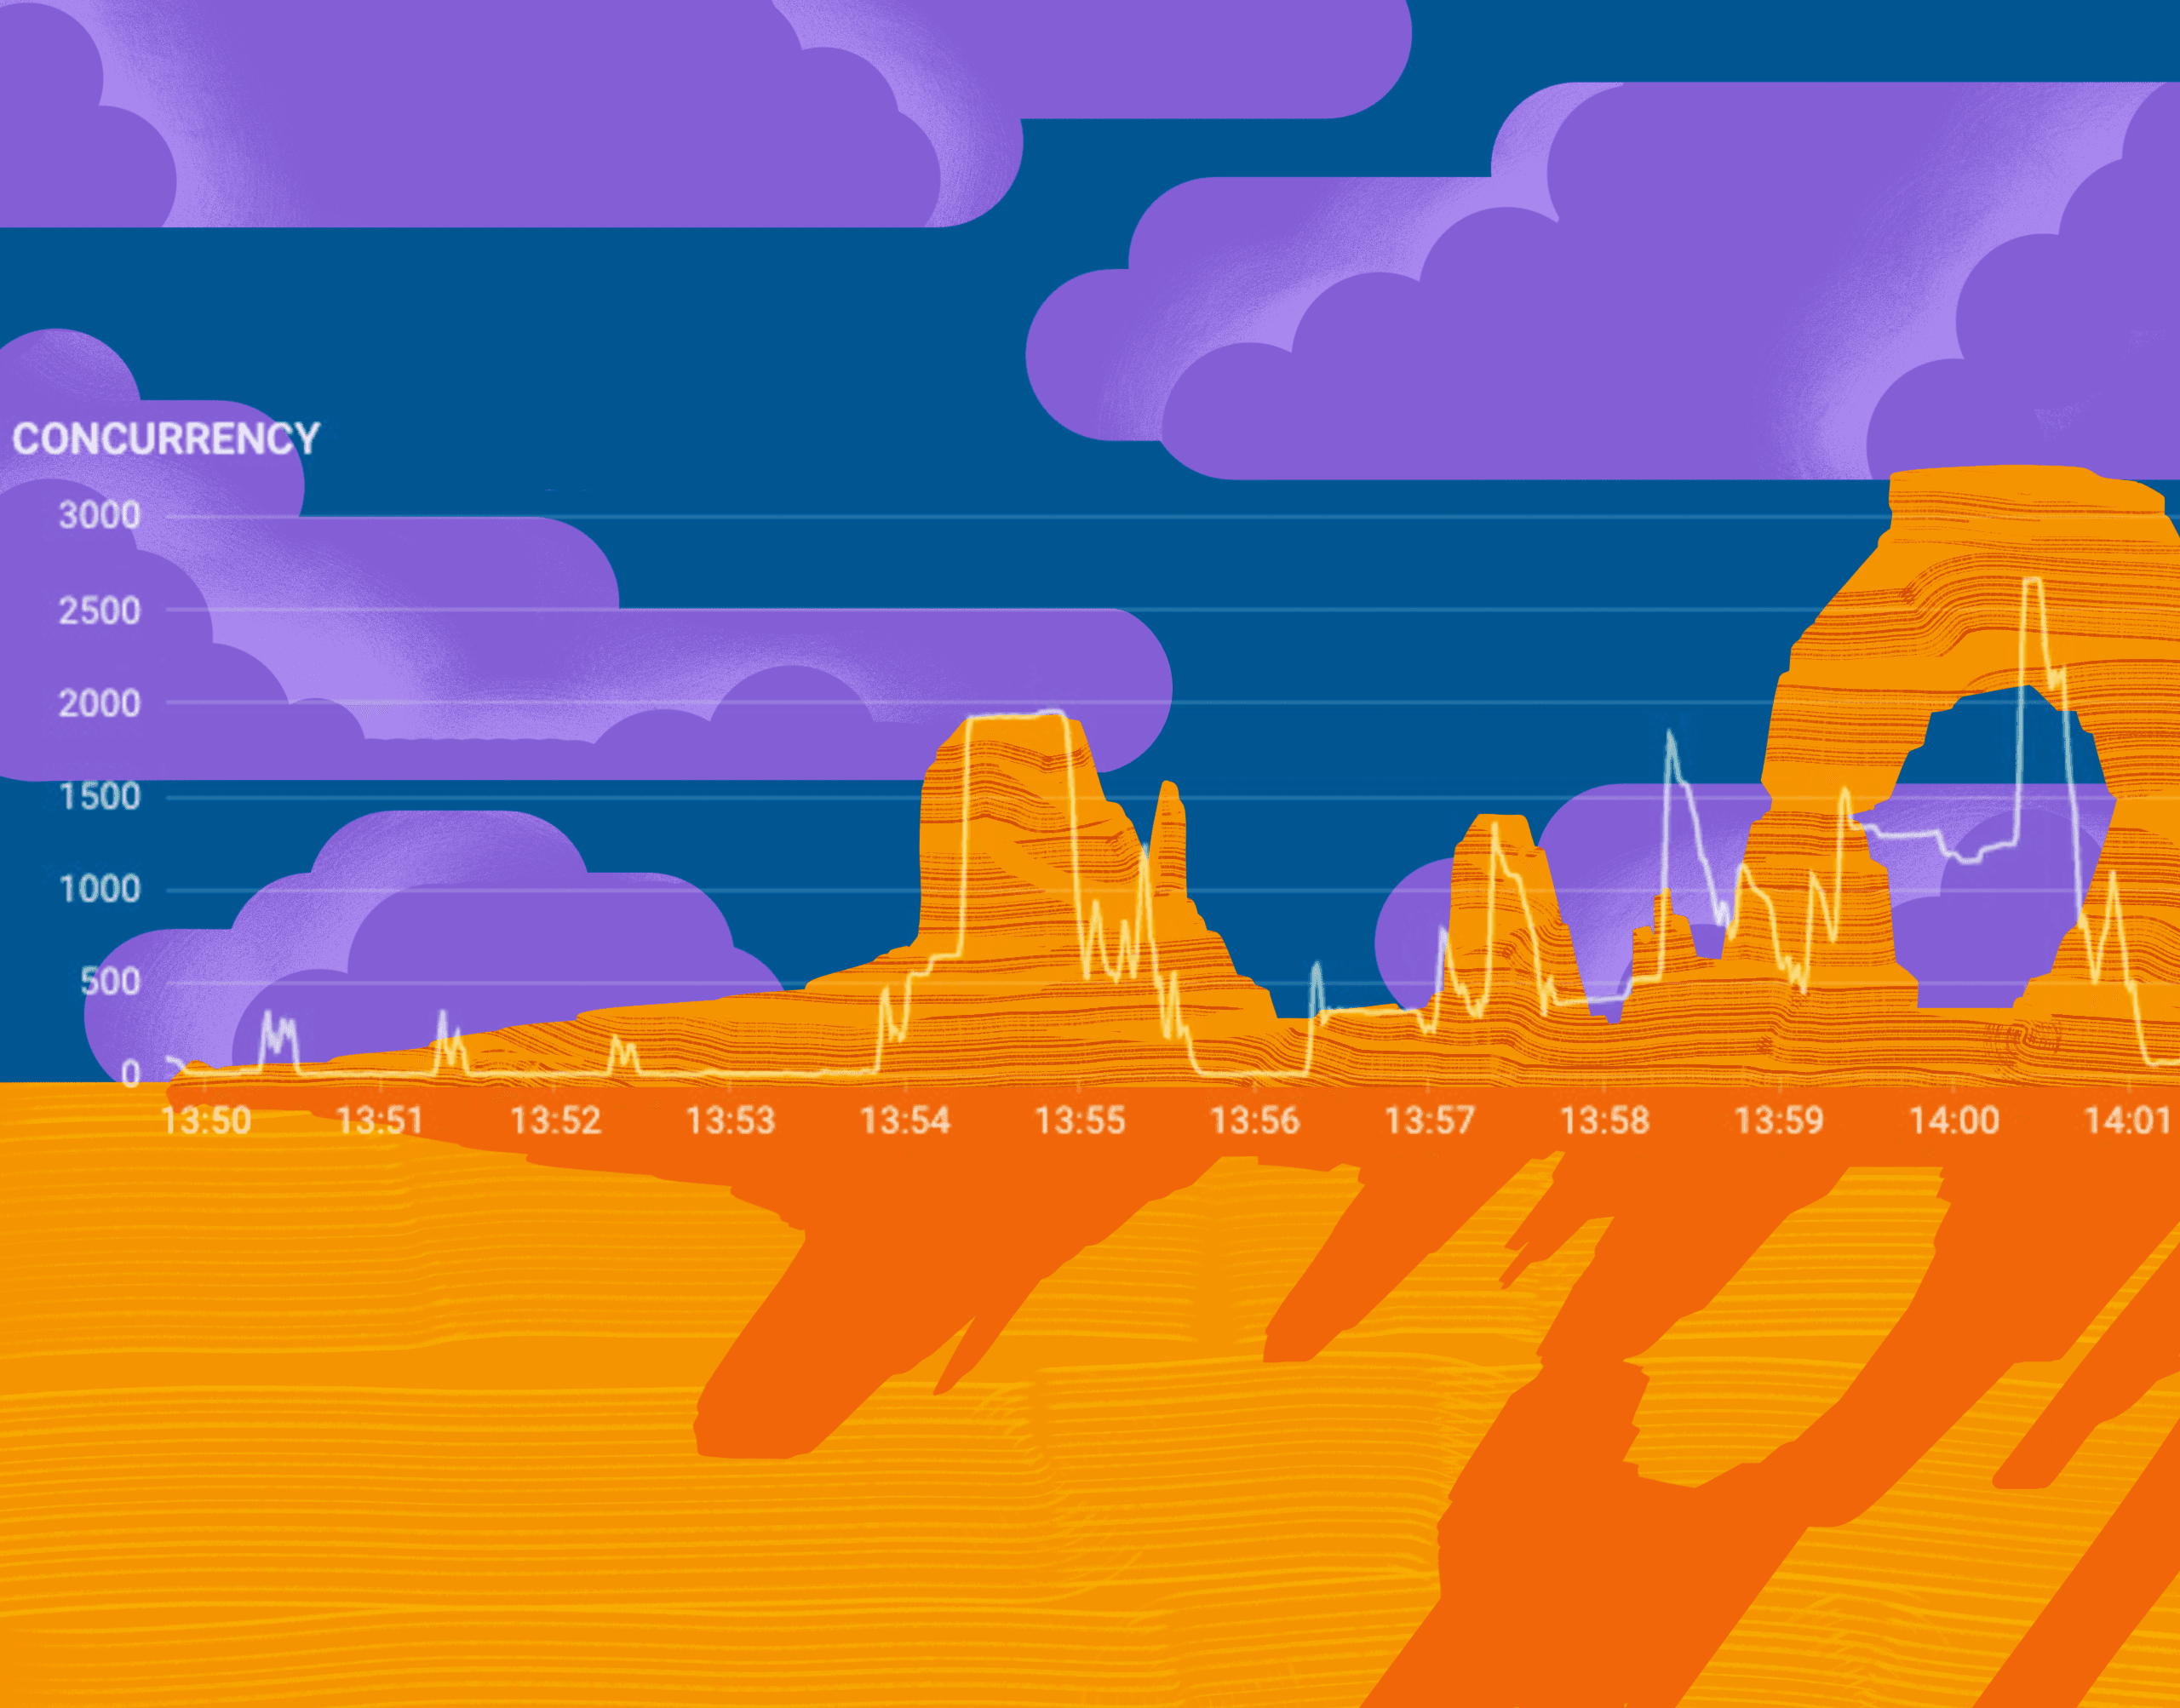
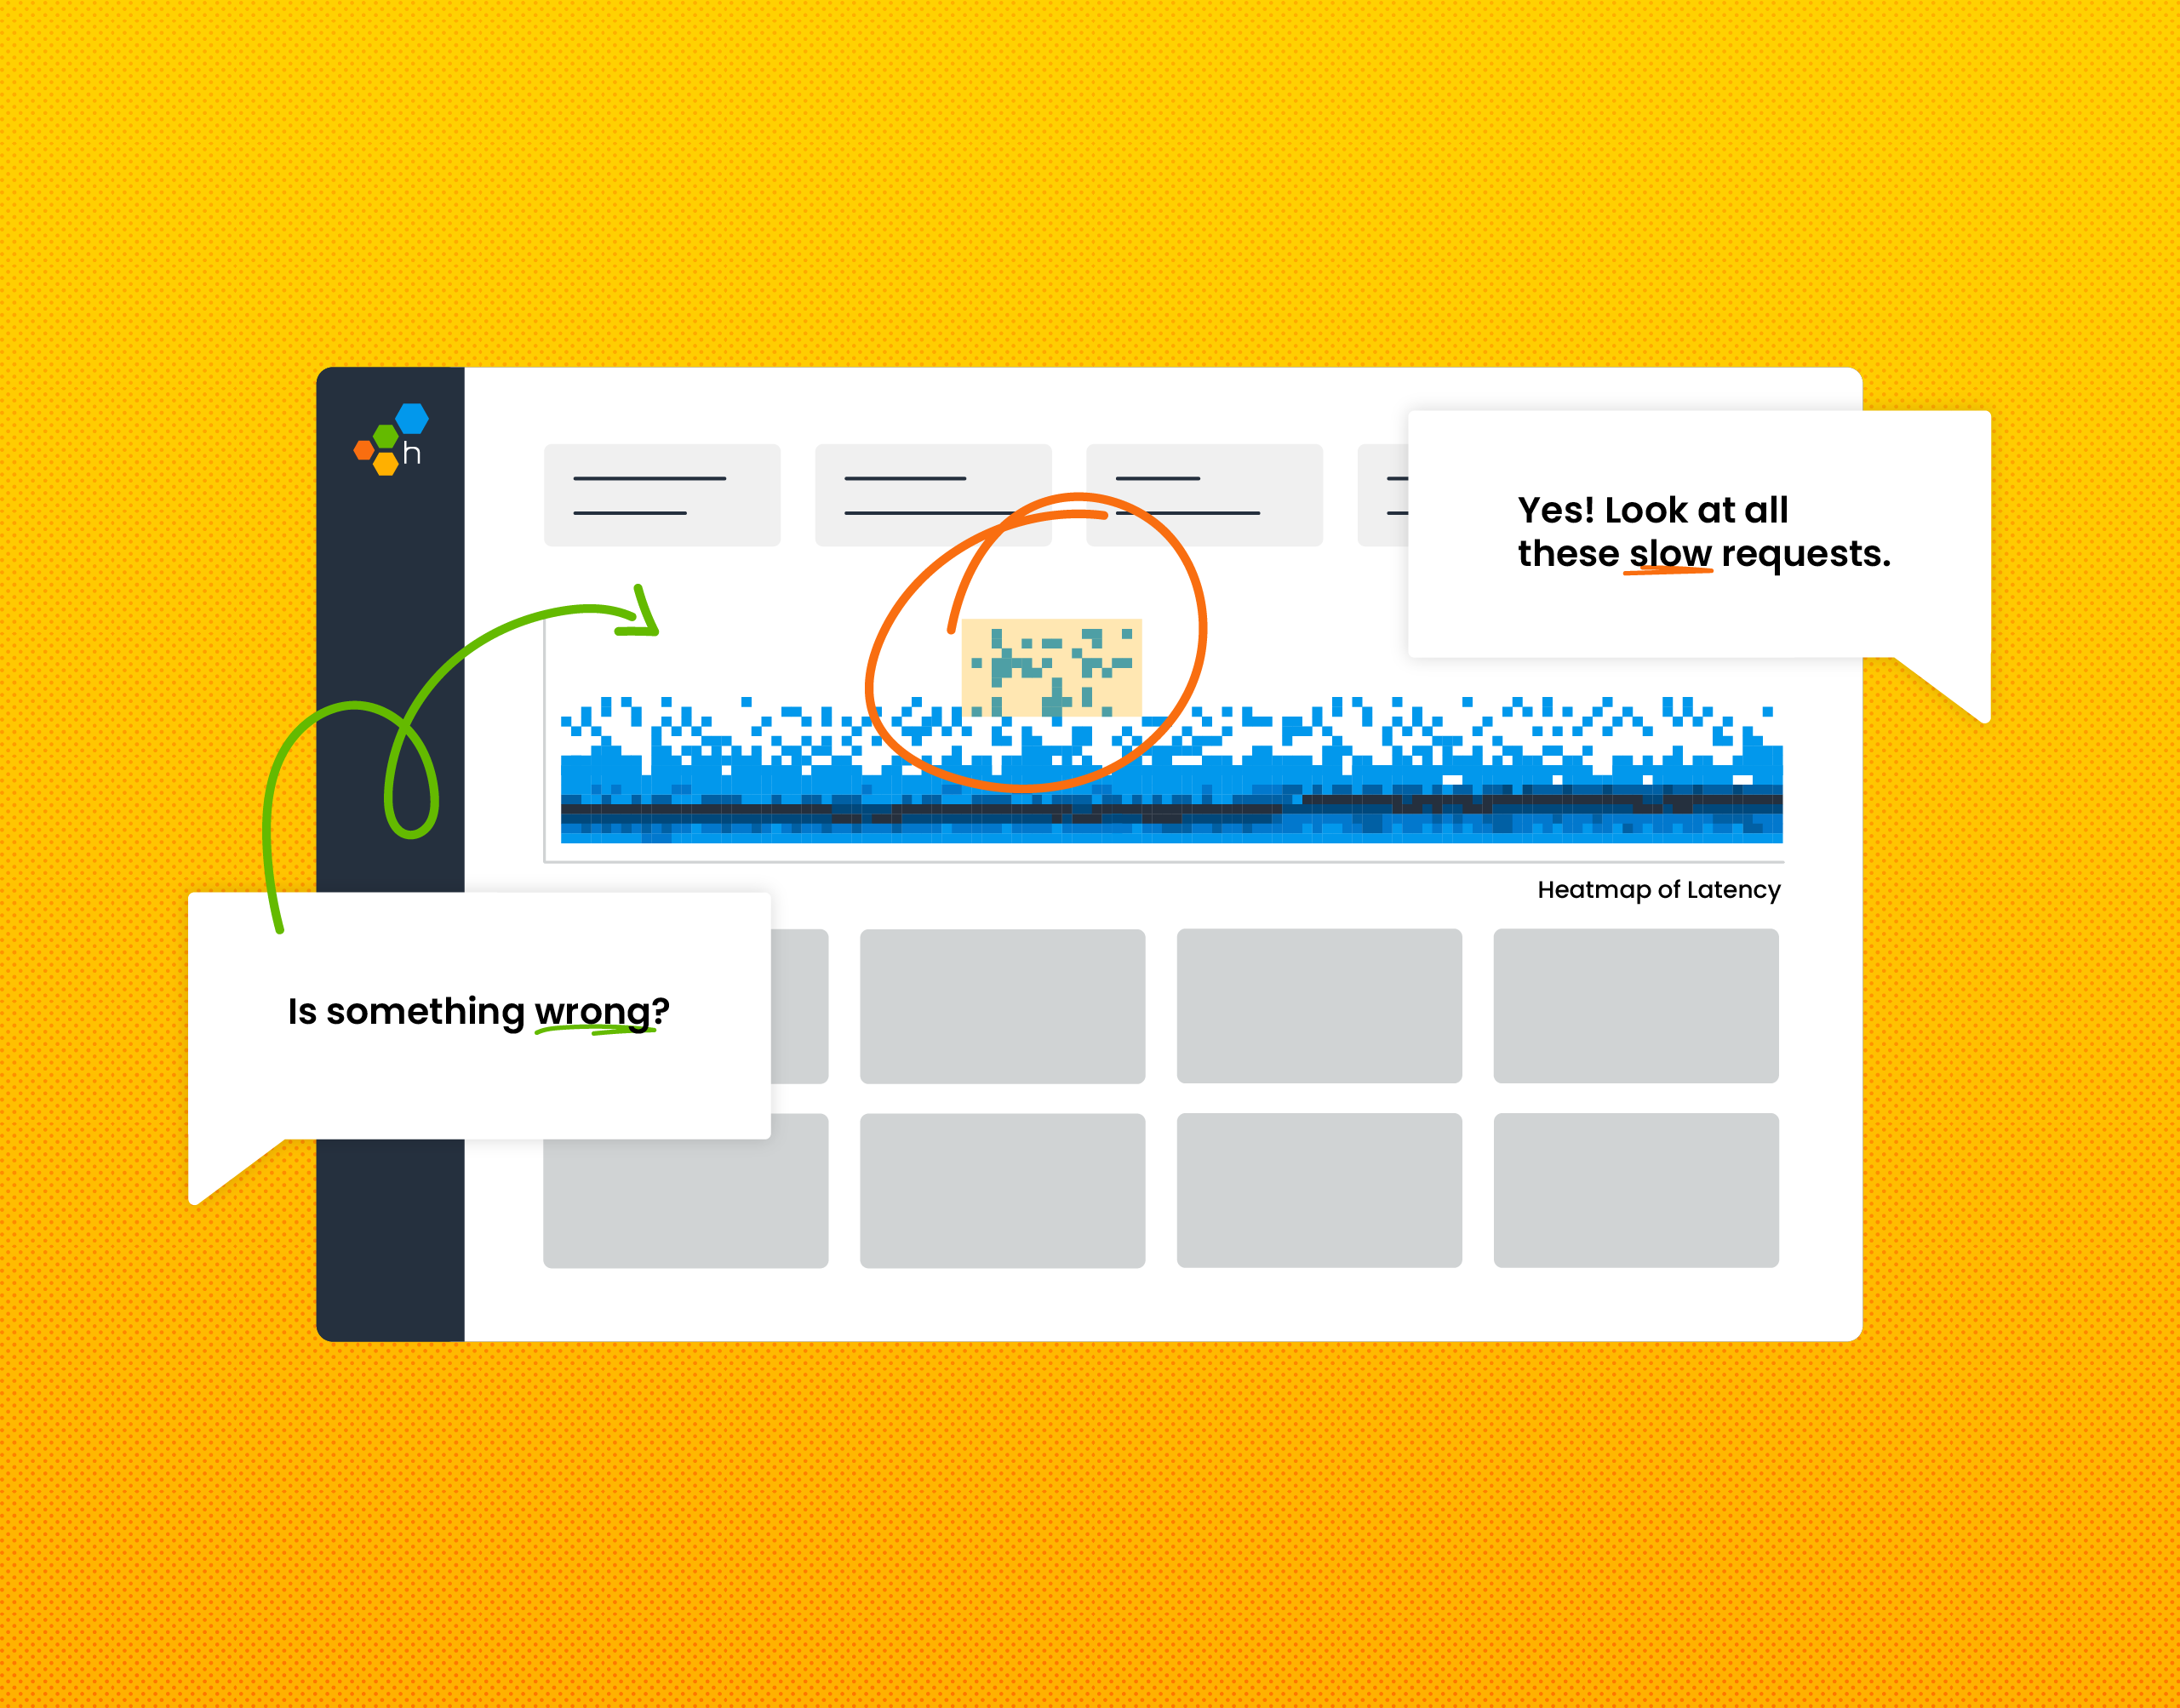
Heatmaps are a beautiful thing. So are charts. Even better is that sometimes, they end up producing unintentional—or intentional, in the case of our happy o11ydays experiment—art.
Jessica Kerr (Jessitron)
The modern standard for observability in backend systems is: distributed traces with OpenTelemetry, plus dynamic aggregations over these events. This works very well in the world of web servers. But what about the web client?
Lex Neva
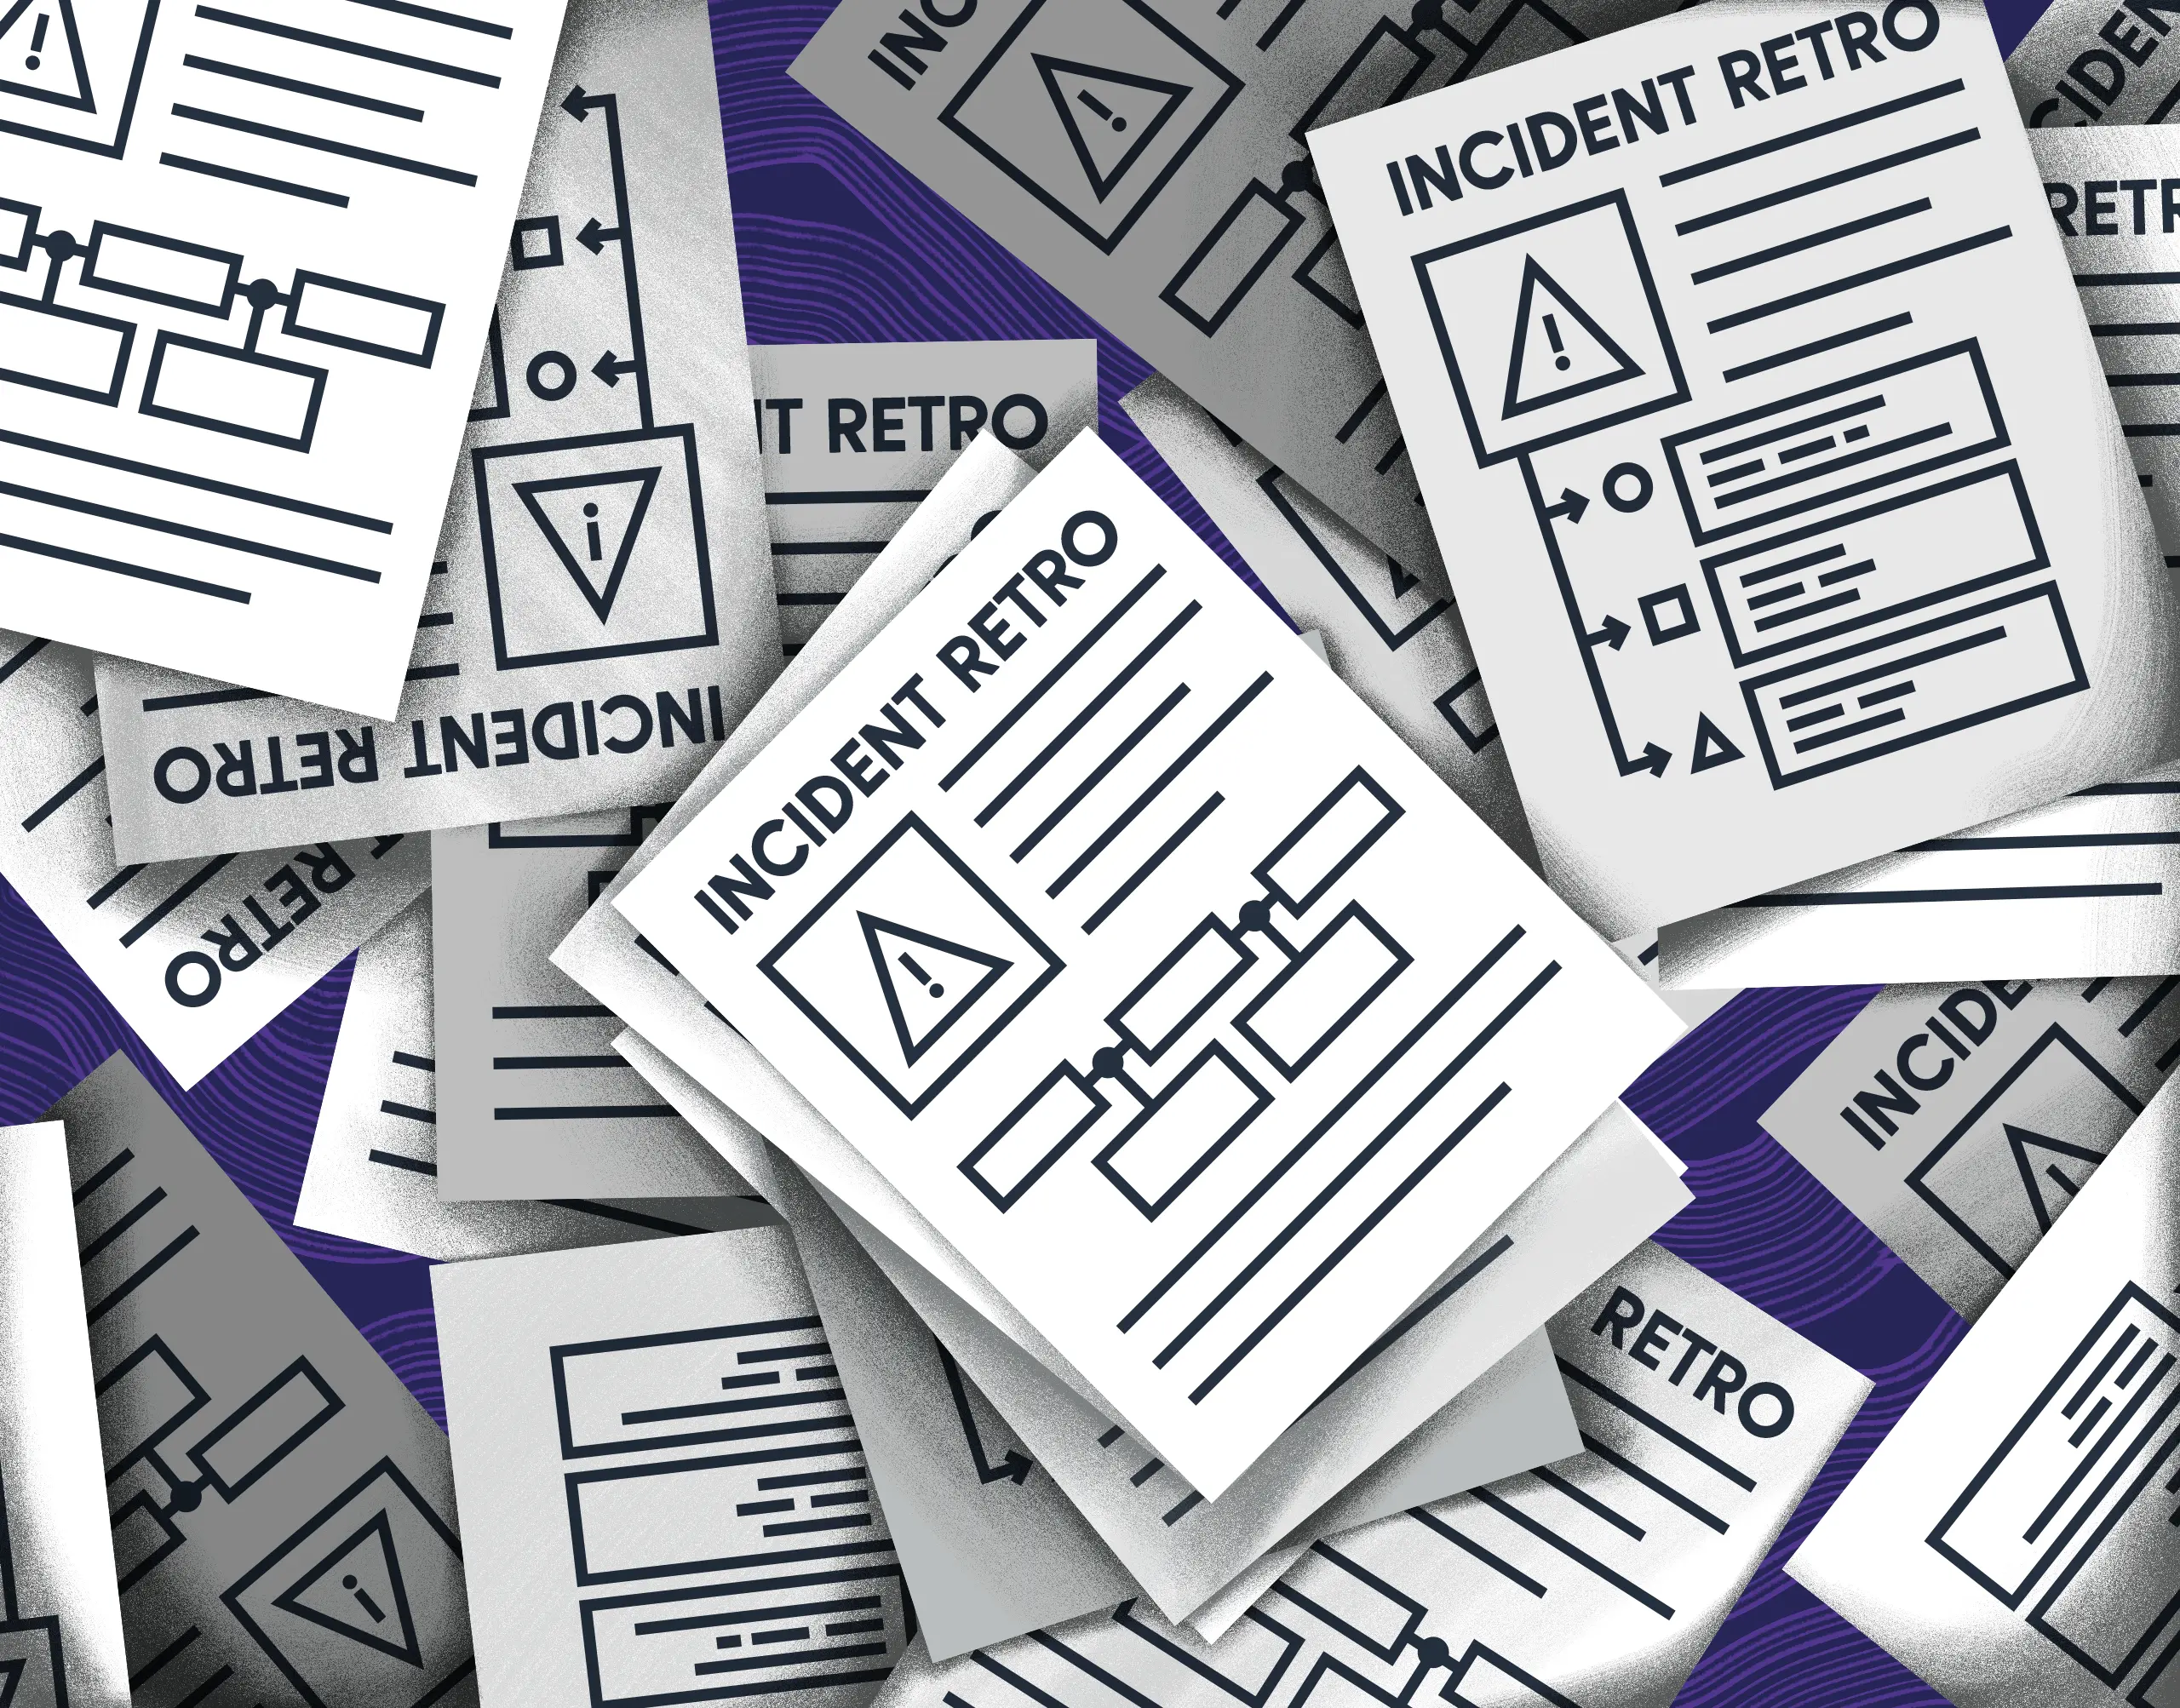
At a recent training session, Jeli spent a great deal of time covering incident retrospectives and what makes an incident worthy of studying. My colleague Ben Hartshorne asked a fascinating question, which I’ll paraphrase here: We’ve been talking about what makes an incident interesting, but what about the reverse? Are there aspects of an incident that would make you say, “We probably shouldn’t bother doing a retrospective on this one?”
Nathan Lincoln
When your alerts cover systems owned by different teams, who should be on call? We get this question a lot when talking about SLOs. We believe that great SLOs measure things that are close to the user experience. However, it becomes difficult to set up alerting on that SLO, because in any sufficiently complex system, the SLO is going to measure the interaction between multiple services owned by different teams. Therefore, the question becomes: who gets woken up at night when an SLO is burning through its error budget?
George Miranda
Honeycomb’s Deployment Protection Rule for GitHub Actions quickly enables canary deployments by letting you use Honeycomb query results to prevent deploying to your next target environment.
Irving Popovetsky
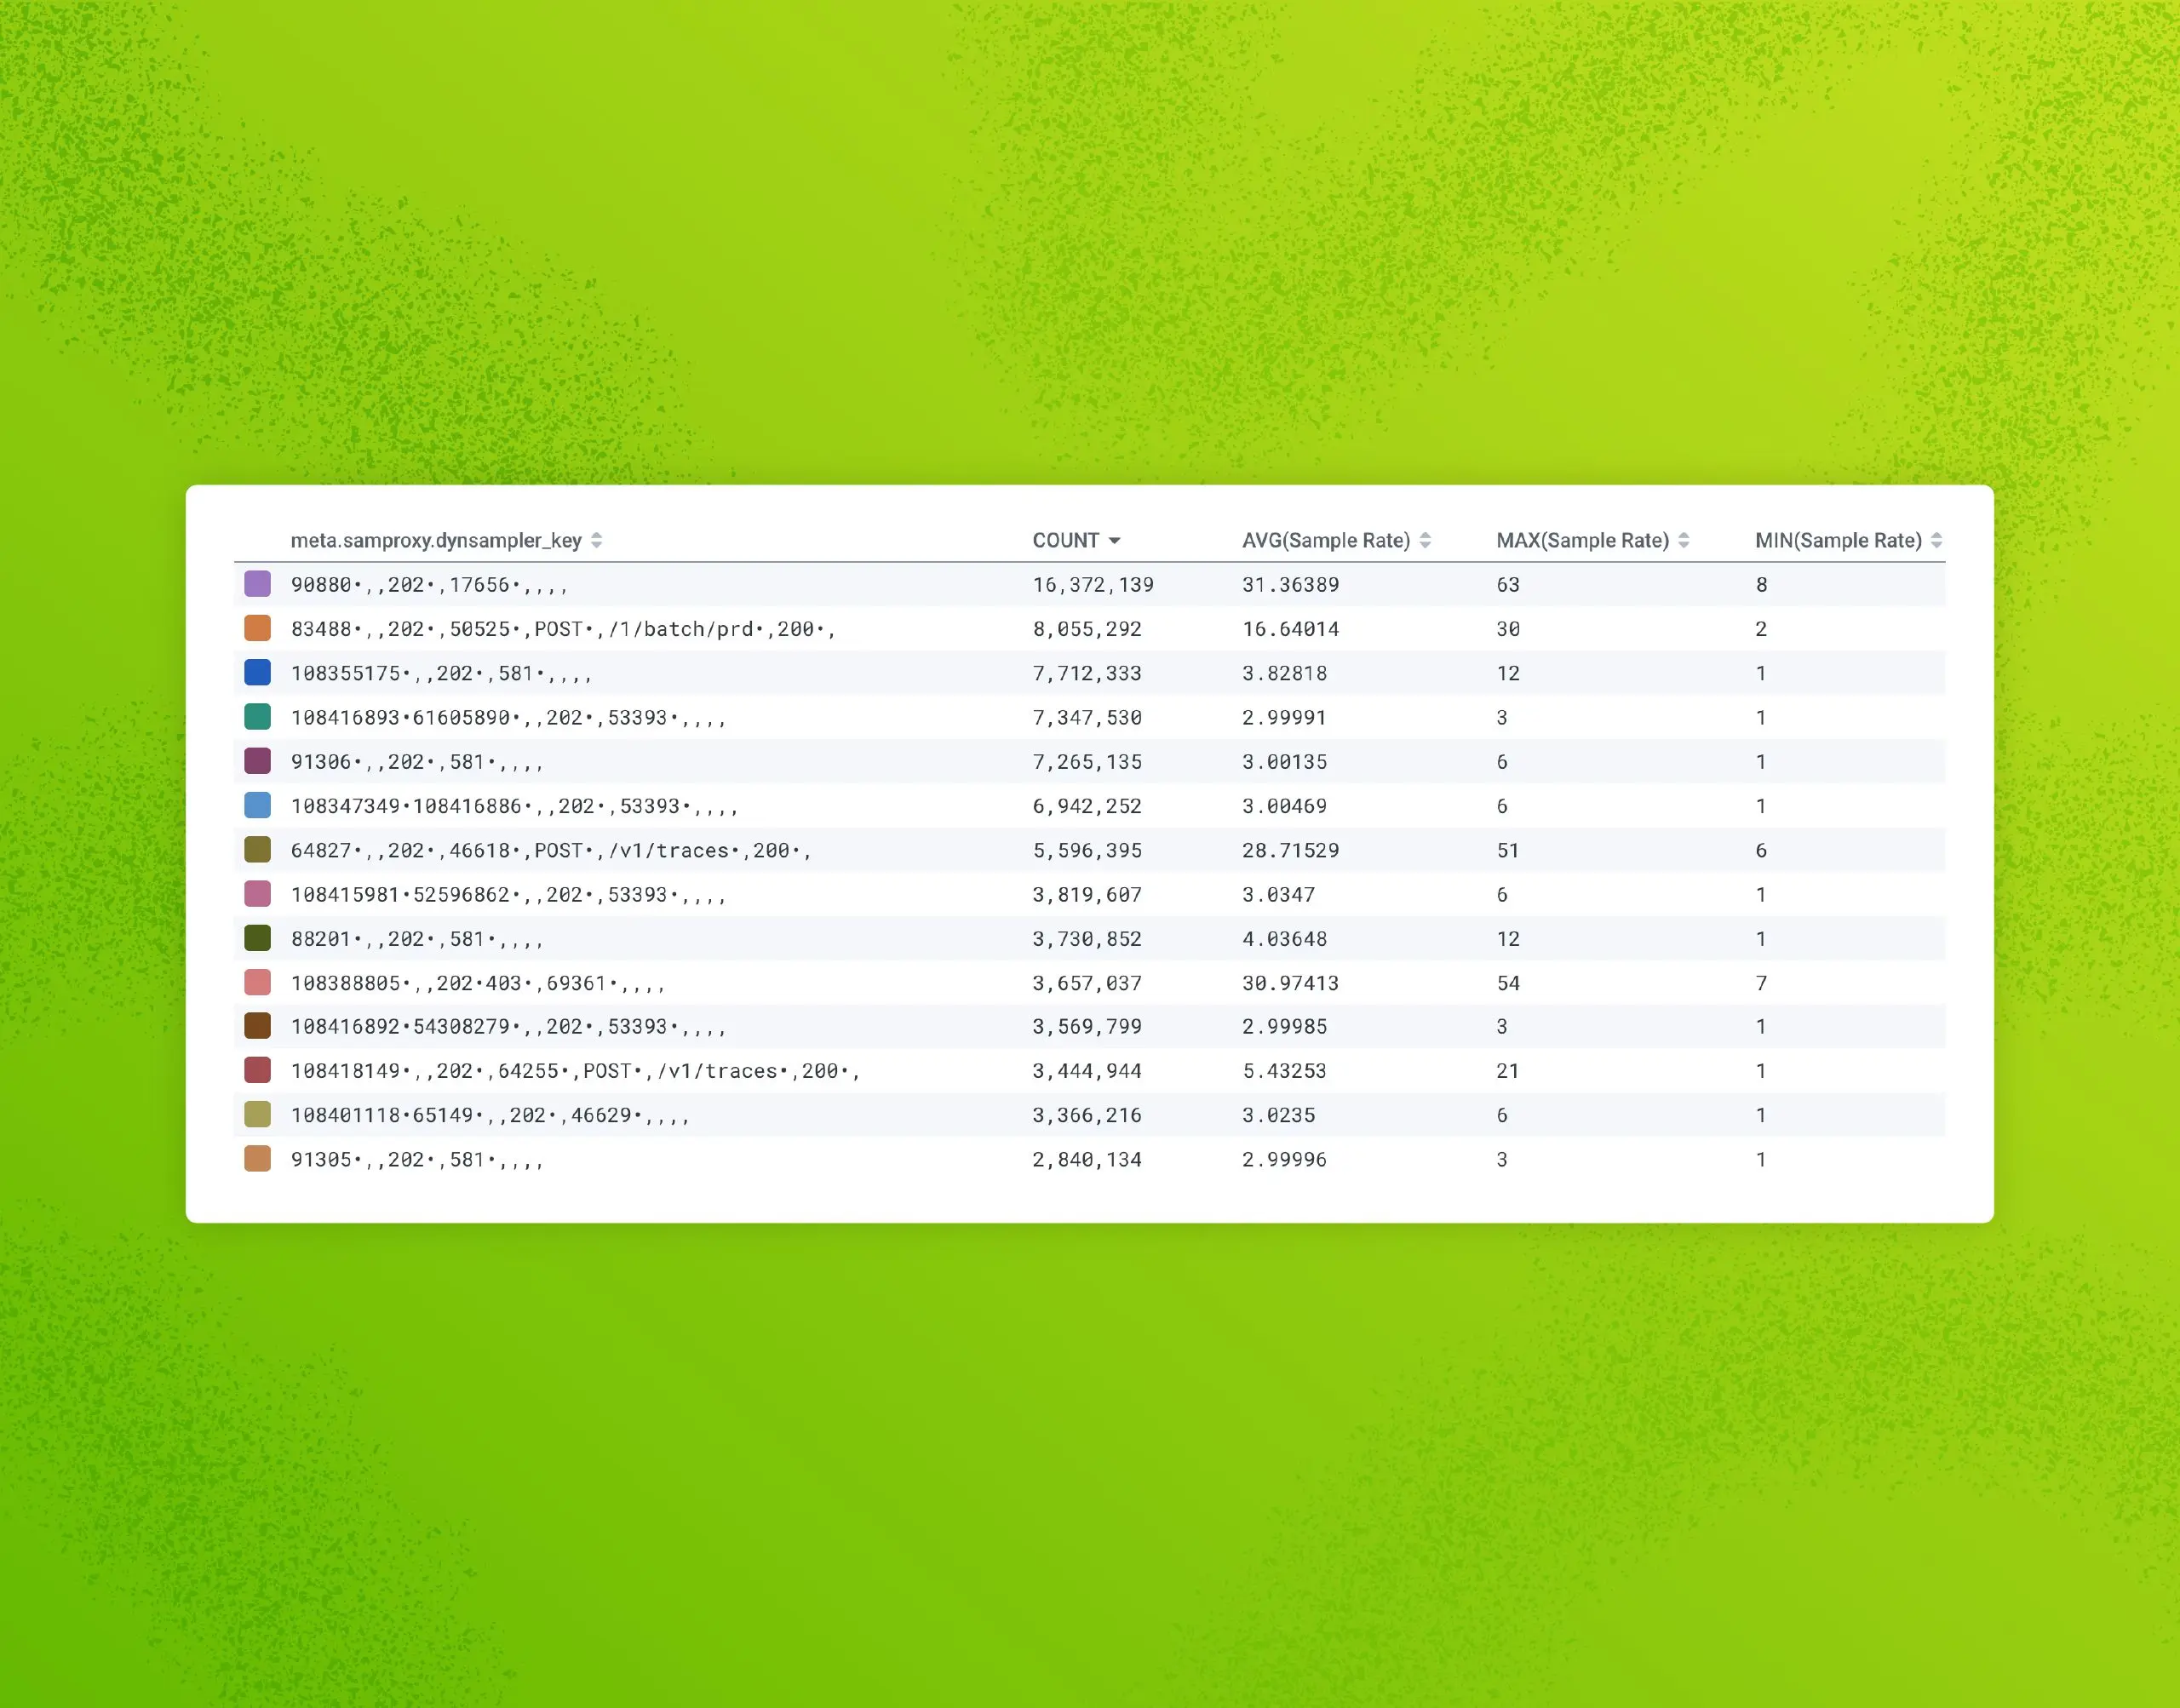
Refinery, Honeycomb’s tail-based dynamic sampling proxy, often makes sampling feel like magic. This applies especially to dynamic sampling, because it ensures that interesting and unique traffic is kept, while tossing out nearly-identical “boring” traffic. But like any sufficiently advanced technology, it can feel a bit counterintuitive to wield correctly, at first.
We’re in Amsterdam for the week of Kubecon EU. Come by our booth to learn more about how you can gain complete observability into your Kubernetes clusters with Honeycomb and OpenTelemetry. In the meantime, enjoy this OTel update!
Martin Thwaites
Contrary to Betteridge’s Law of Tabloid Headlines, the answer to the question, “does OpenTelemetry in .NET cause performance degradation?” is yes, but context is important. I get this question so often that I thought it was time to get some stats on it.
Spring has sprung, and the bees have been busy. Let’s have a look at what’s new in Honeycomb at the close of March.
Christine Yen
The future of observability has never been more exciting, and this latest round ensures we can continue to invest—with conviction—in improving the lives of software engineering teams. We hope this is a moment of welcome change from the soul-crushing headlines plaguing the tech industry these past few months.
Get it delivered straight to your inbox.
By subscribing to our newsletter, you agree to Honeycomb’s Terms of Service and Privacy Notice.
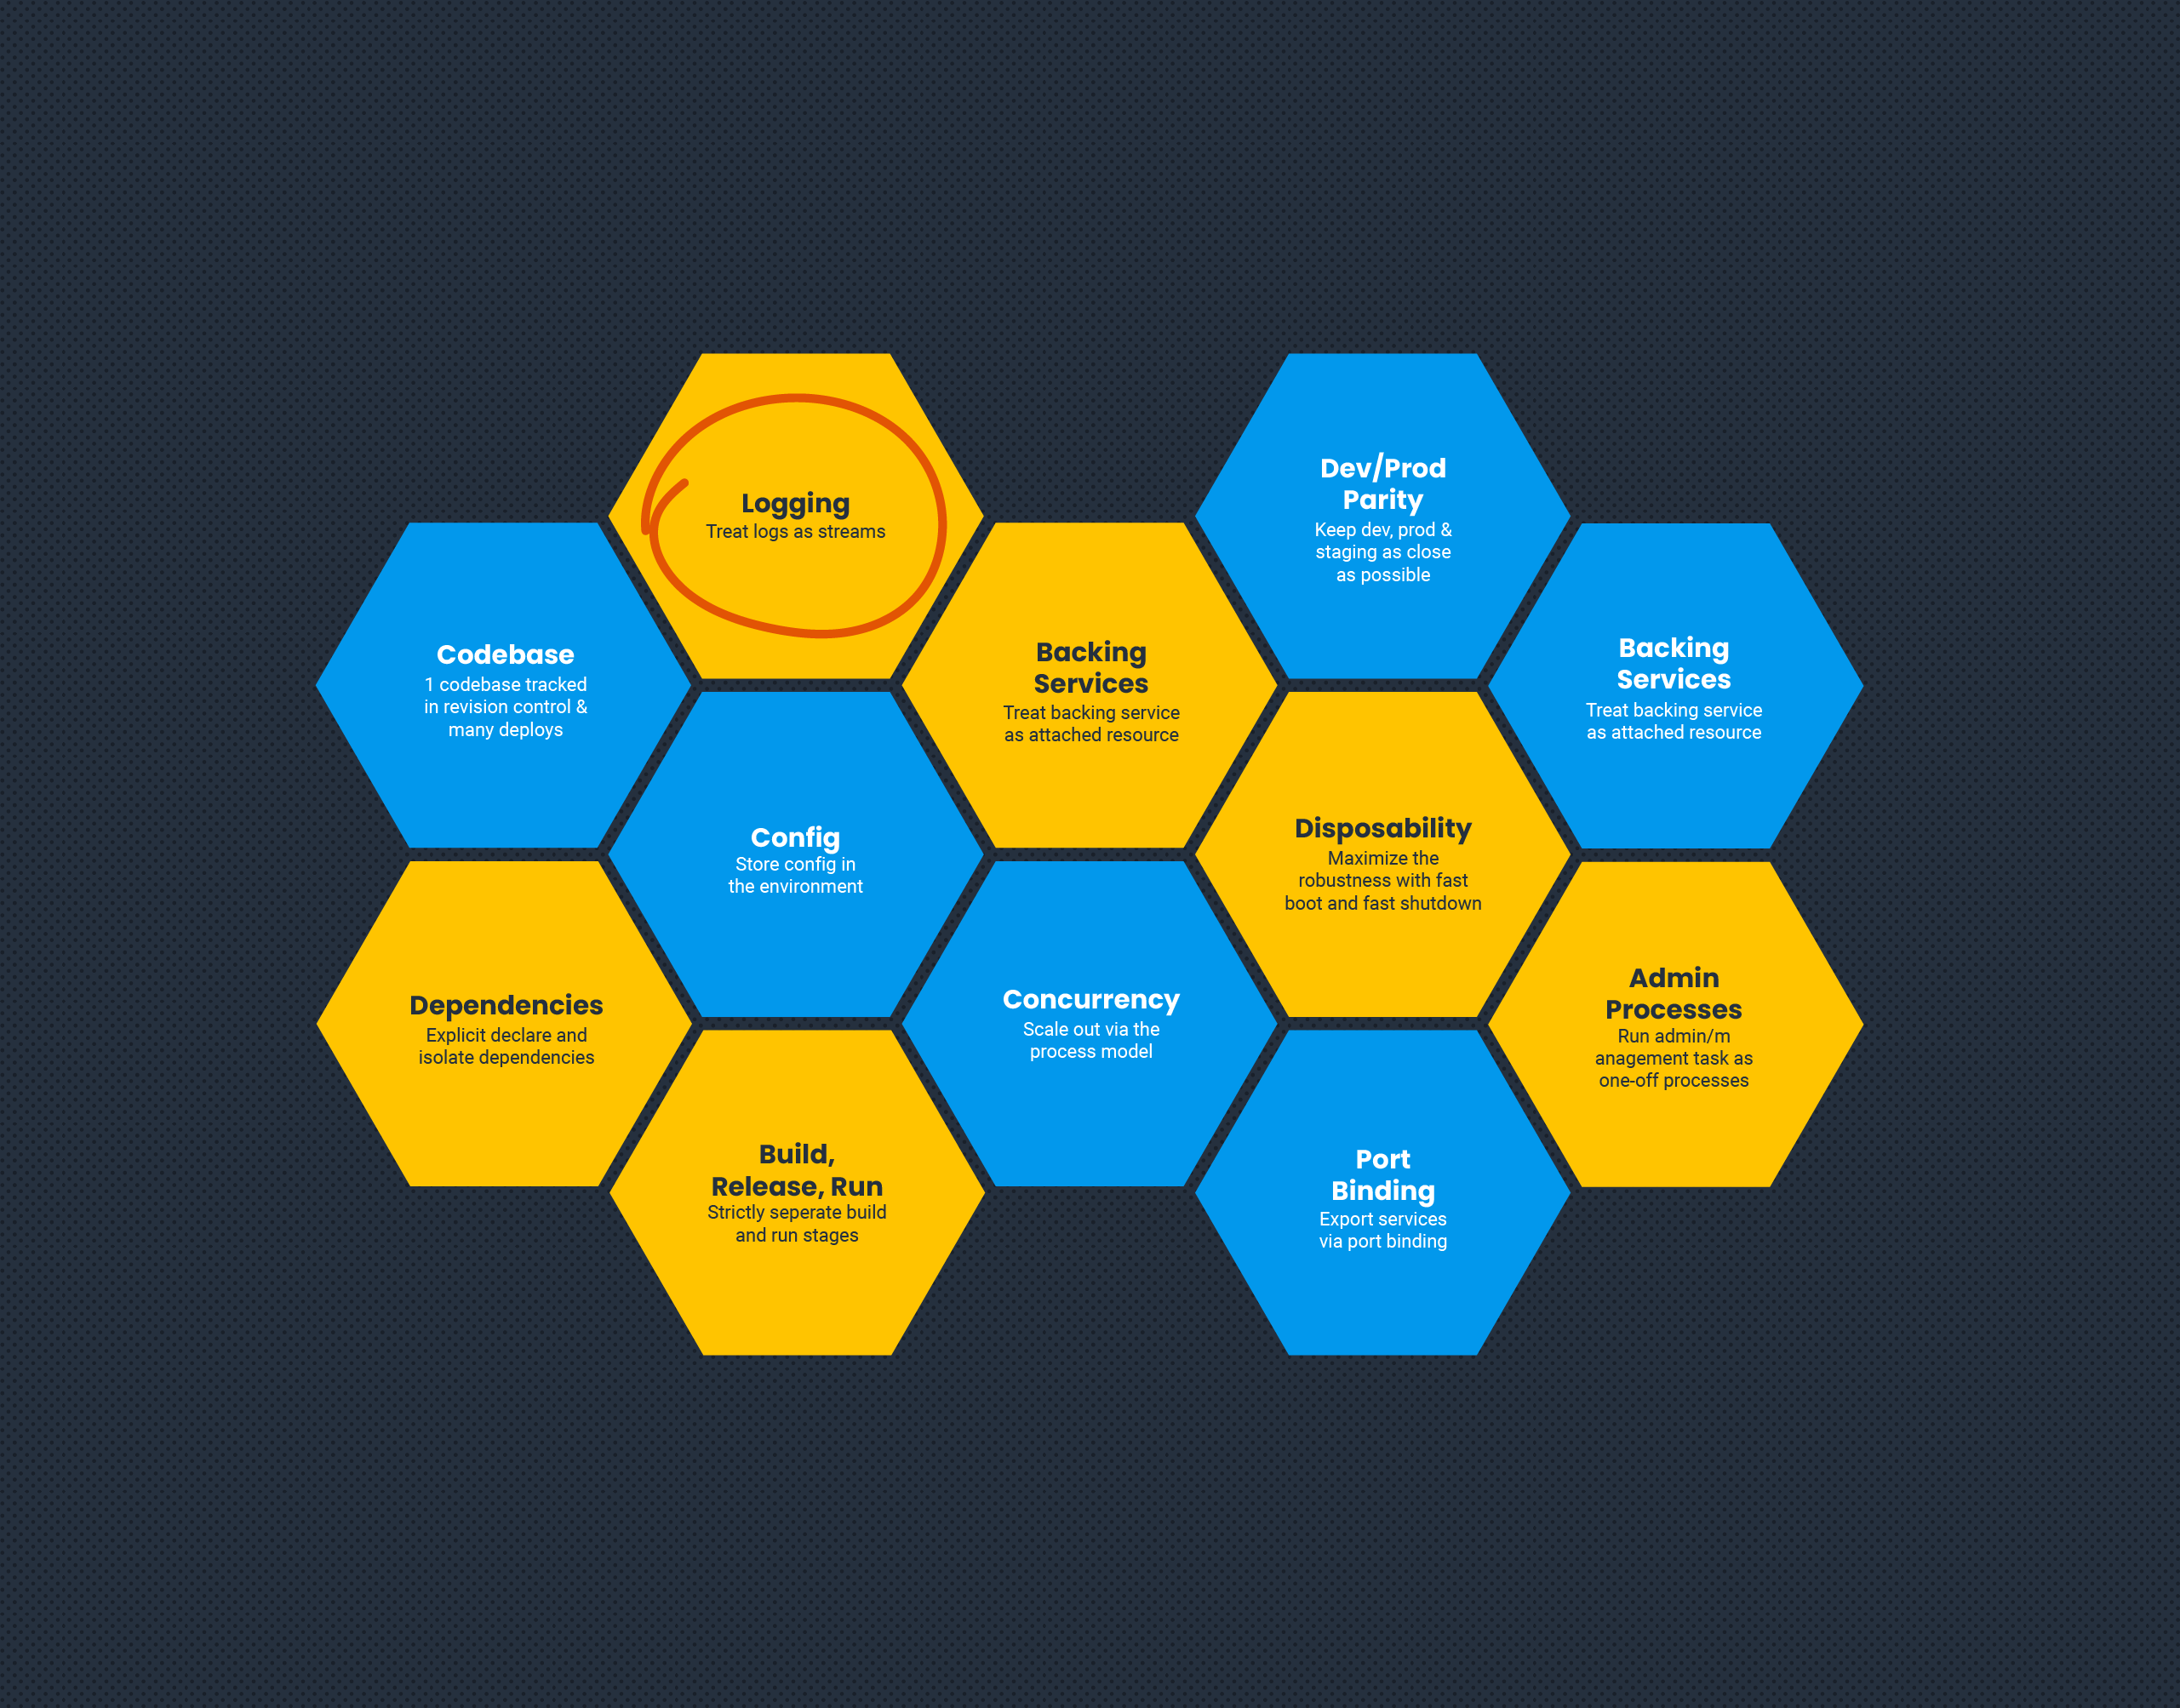
The Twelve-Factor App methodology is a go-to guide for people building microservices. In its time, it presented a step change in how we think about building applications that were built to scale, and be agnostic of their hosting. As applications and hosting have evolved, some of these factors also need to. Specifically, factor 11: Logs.
Dear Miss O11y, I want to make my microservices more observable. Currently, I only have logs. I’ll add metrics soon, but I’m not really sure if there is a set path you follow. Is a guide of some sort, or best practice, like you have to have x kinds of metrics? I just want to know what all possibilities are out there. I am very new to this space.
Fred Hebert
The SRE team is now four engineers and a manager, and we are involved in all sorts of things across the organization, across all sorts of spheres. We are embedded in teams and we handle training, vendor management, capacity planning, cluster updates, tooling, and so on. After growing the team to a point where we could get a better grasp on our mission and identity, we decided to revisit our charter. It is a living document after all, and it was exciting for me to let other folks get their hands in it.
It’s been a minute since our last Feature Focus, and we have a bit of catching up to do! I’m happy to report we’ll resume monthly updates next month, but until then, please enjoy this super-sized winter digest of what we’ve been up to at Honeycomb.
Charity Majors
I’m no stranger to ranting about deploys. But there’s one thing I haven’t sufficiently ranted about yet, which is this: Deploying software is a terrible, horrible, no good, very bad way to go about…
Your API Key (in the x-honeycomb-team header) tells Honeycomb where to put your data. It specifies a team and an environment. Then, Honeycomb figures out which dataset to put each event in, based on the service.name field in the event. Except…
When we work at it, professionals are pretty good at analysis. We can break down a simple system, look at its parts and their relations, and master it. Given enough time and teammates, we can analyze a very complicated system and fix it when it breaks. But complex systems don’t yield to analysis. We have to add another skill: sense-making.
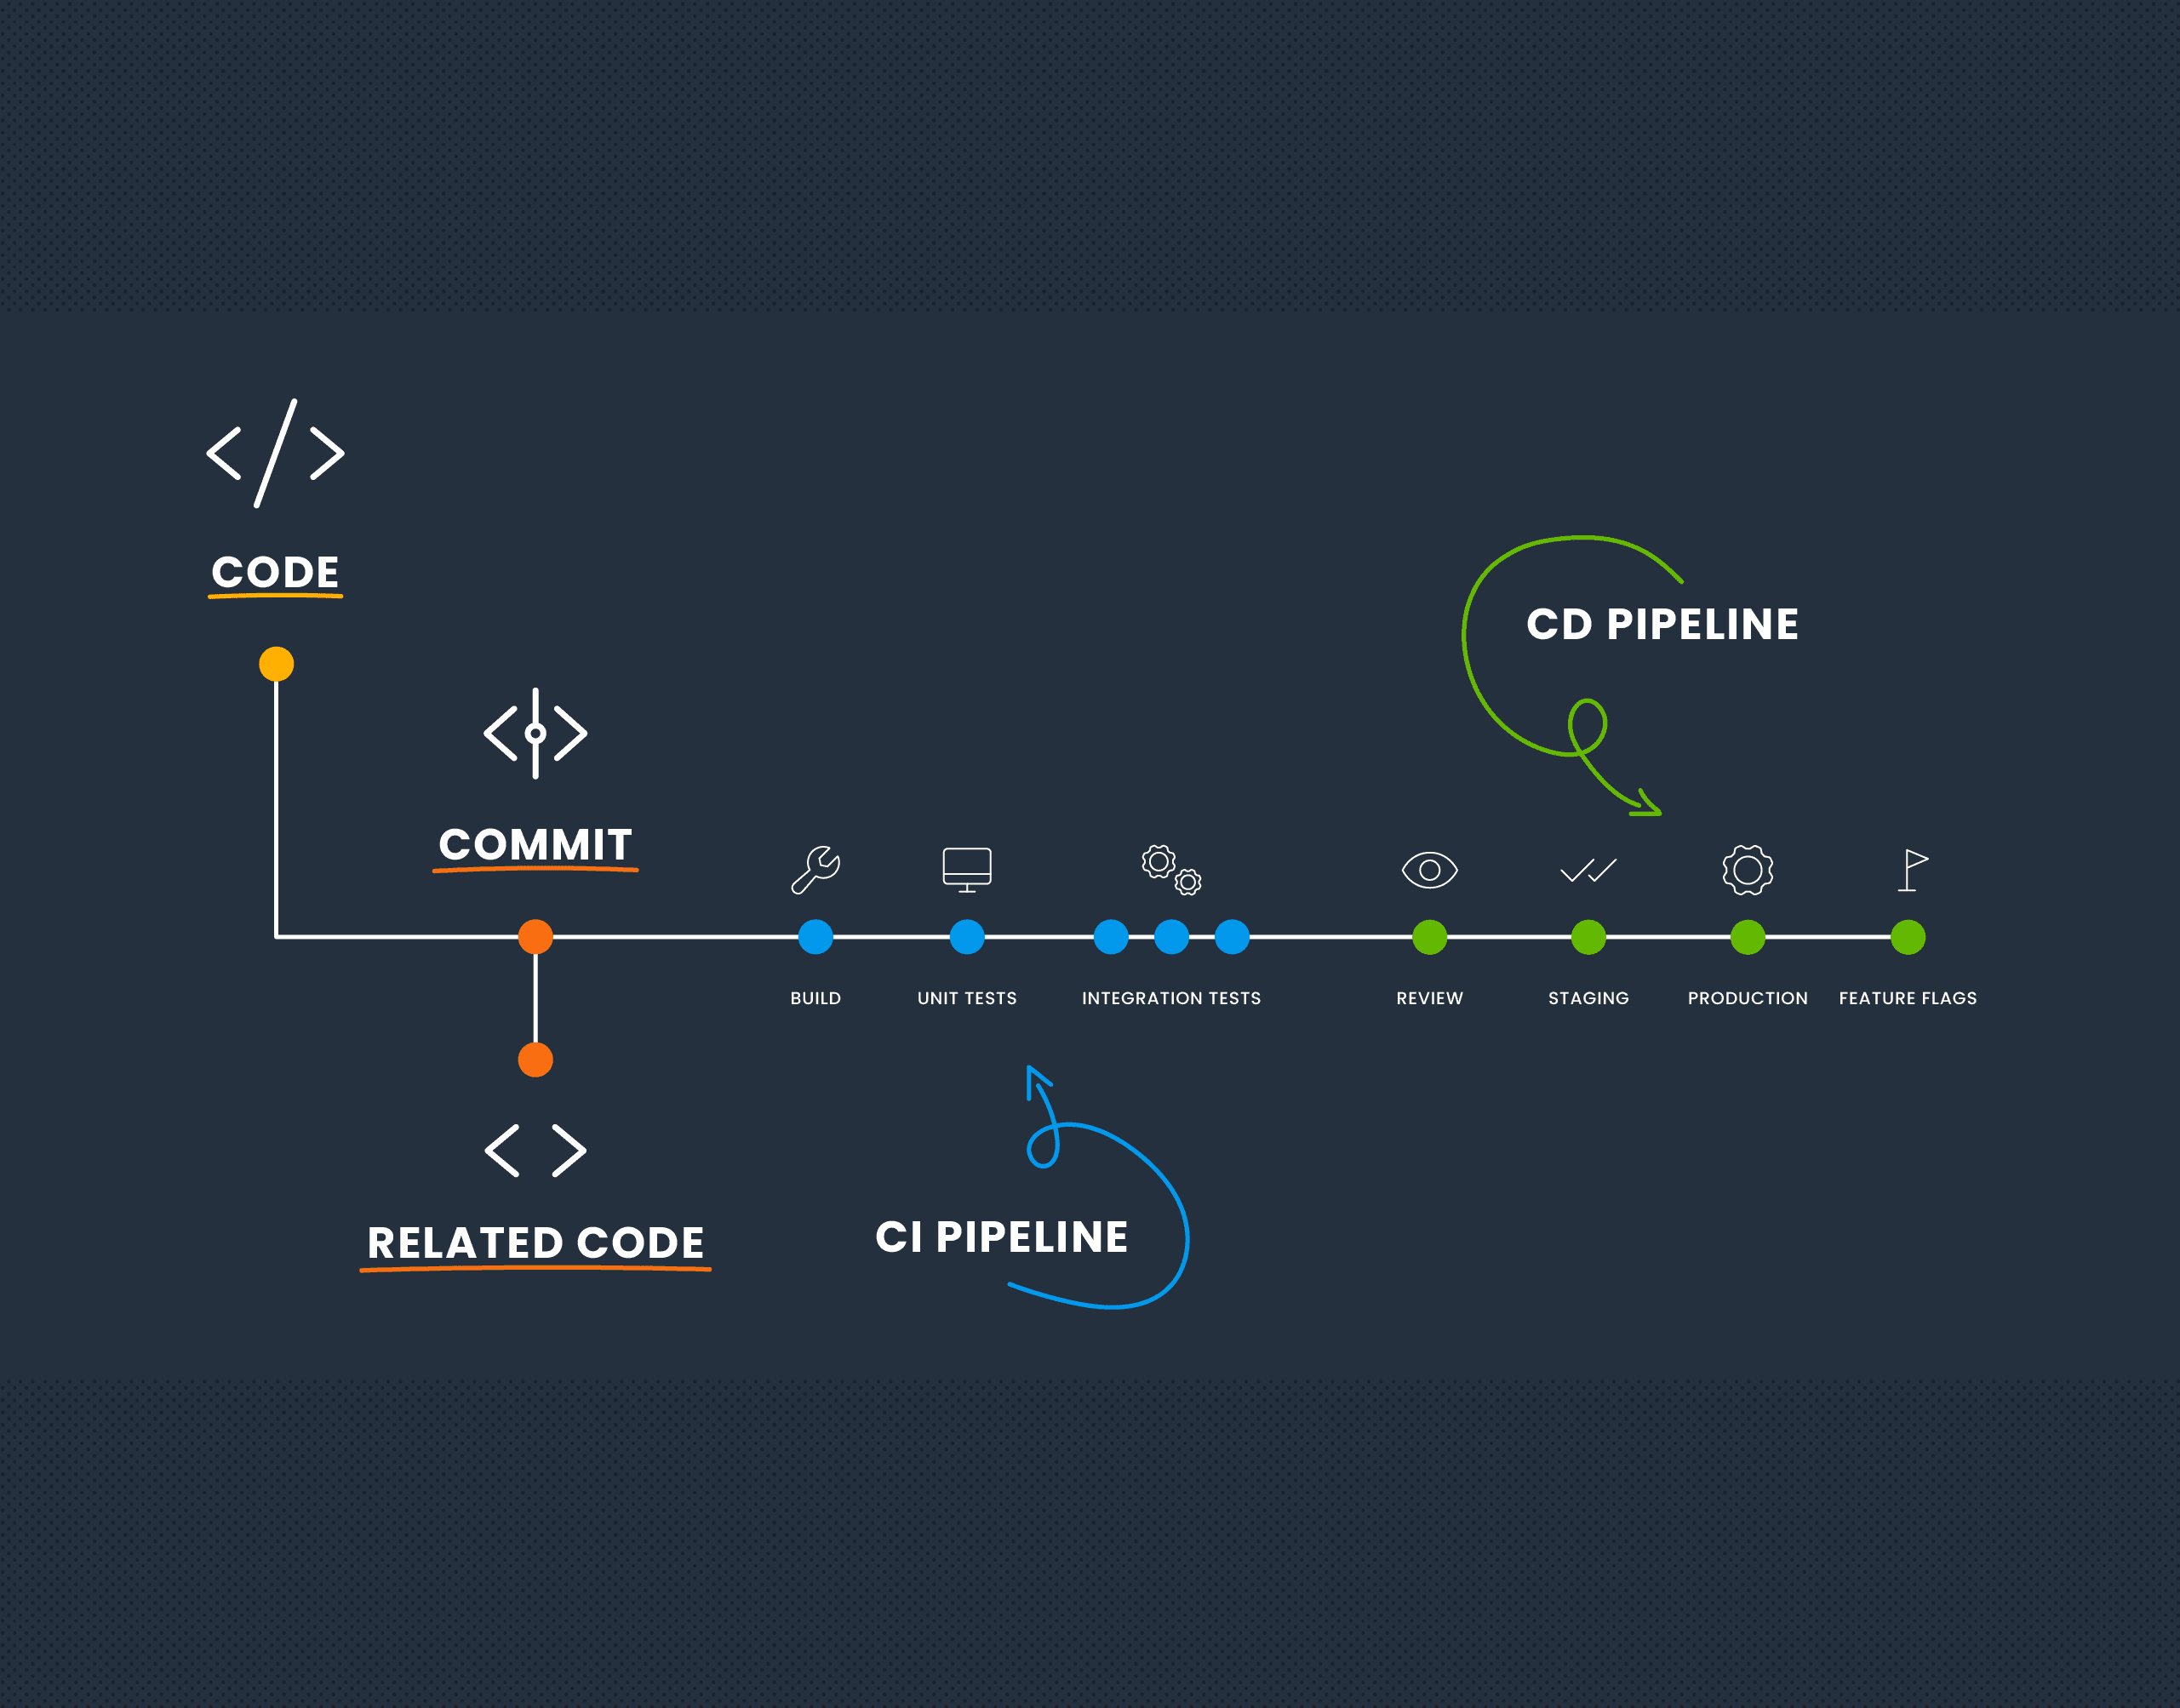
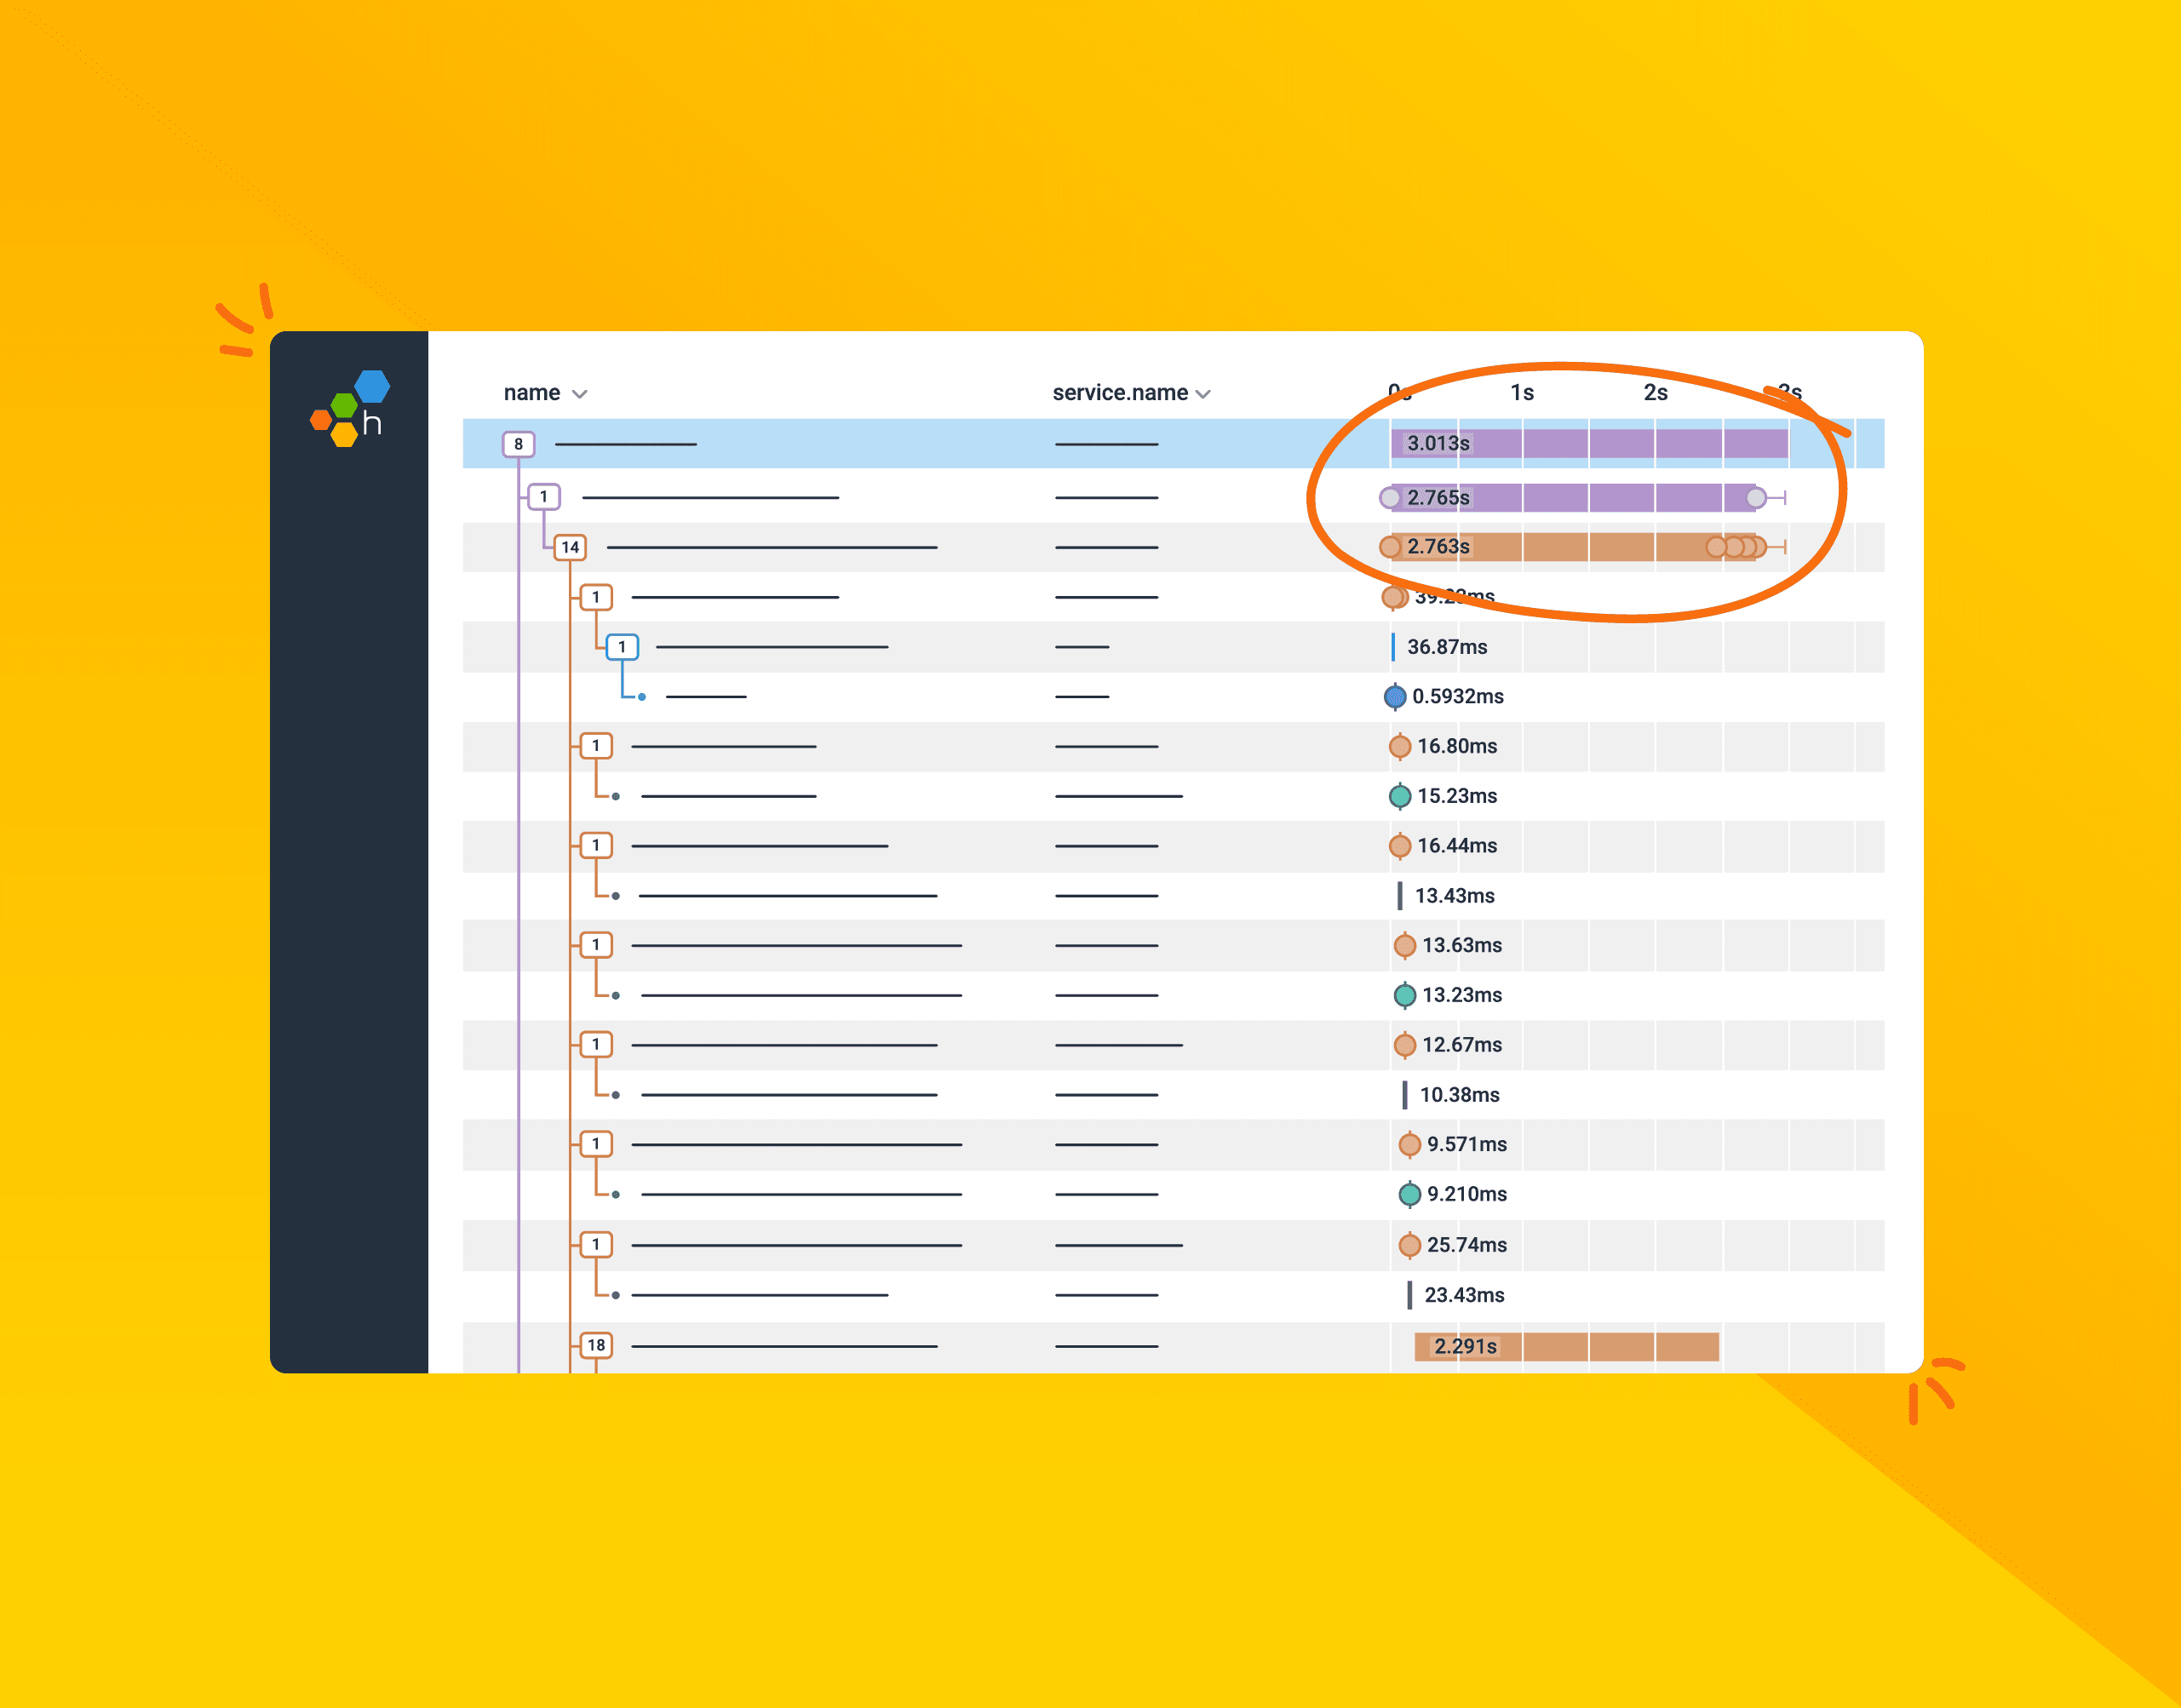
So you’re used to debugging systems using a distributed trace, but your system is about to introduce a message queue—and that will work the same… right? Unfortunately, in a lot of implementations, this isn’t the case. In this post, we’ll talk about trace propagation (manual and OpenTelemetry), W3C tracing, and also where a trace might start and finish.